Abstract
Cancers involving the oral cavity, head, and neck regions are often treated with cisplatin. In cancer therapy, the main target is to eliminate unwanted cancerous cells. However, reports on the nonselective nature of this drug have raised few concerns. Incorrect nutritional habits and lifestyle practices have been directly linked to cancer incidence. Nutrients with antioxidant activity inhibit cancer cells development, destroying them through oxidative stress and apoptosis. α-tocopherol, the potent antioxidant form of vitamin E is a known scavenger of free radicals. In vitro study exhibited effective antitumor activity of α-tocopherol on ORL-48 at 2.5 ± 0.42 µg/mL. Cisplatin exhibited stronger activity at 1.0 ± 0.15 µg/mL, but unlike α-tocopherol it exhibited cytotoxicity on normal human epidermal keratinocytes at very low concentration (<0.1 µg/mL). Despite the lower potency of α-tocopherol, signs of apoptosis such as the shrinkage of cells and appearance of apoptotic bodies were observed much earlier than cisplatin in time lapse microscopy. No apoptotic vesicles were formed with cisplatin, instead an increased population of cells in the holoclone form which may suggest different induction mechanisms between both agents. High accumulation of cells in the G0/G1 phase were observed through TUNEL and annexin V-biotin assays, while the exhibition of ultrastructural changes of the cellular structures verified the apoptotic mode of cell death by both agents. Both cisplatin and α-tocopherol displayed cell cycle arrest at the Sub G0 phase. α-tocopherol thus, showed potential as an antitumour agent for the treatment of oral cancer and merits further research.
Keywords: cisplatin, keratinocytes, cytotoxicity, apoptosis, holoclone
Introduction
The SEER program (Surveillance, Epidemiology, and End Results) Stat Fact Sheets had reported that 45 780 new cases of oral cavity and pharynx cancer have been identified and it was estimated that 8650 people will die of this disease.1 The risk factors of oral cancer include nutritional deficiencies, environment, and lifestyle such as consumption of alcoholic products, tobacco, and betel quid chewing.2,3 As stated by the World Health Organization (WHO), the incidence of oral cancer varies markedly worldwide but globally it is believed to be the 10th most common malignant tumor. Approximately 30% to 35% of cancer deaths in the United States were linked to diet.4,5
A clear majority (>80%) of patients prefer oral chemotherapy, but only provided this is not at the expense of efficacy.6,7 The preference for oral chemotherapy stems largely from the greater convenience of treatment at home (cited by 57% of patients) and avoidance of venipunctures (55%). There are additional concerns with protracted infusional regimens where many patients experience problems with indwelling venous catheters. A third of patients also cited the greater sense of “control” over their treatment that they would gain from oral chemotherapy.7 Quality of life is especially important in the palliative setting and oral treatment can reduce disruption of home life for both patient and their family.8,9
Despite encouraging findings on potentially effective agents and drugs on cancer cells, chemotherapeutic treatments are usually not completely selective for carcinogenic cells. Alongside induction of apoptosis on tumor cells, anticancer agents often also induce apoptosis in normal tissues. Searle et al10 had earlier realized that apoptotic cell death is induced in a subset of normal tissues, which lead to his suggestion that the process may contribute to toxicity associated with chemotherapy. As a consequence of these cytotoxic effects on normal cells, the quality of life of patients with cancer may be lowered.11 In other words, studies suggested that drug-induced apoptosis also causes the loss of normal cell and thus, can contribute to the side effects of cancer therapy.12
Vitamin E is the term for a group of tocopherols (α, β, γ, δ) and tocotrienols (α, β, γ, δ) of which α-tocopherol has the highest biological activity. The 8 members of the vitamin E family are potent antioxidants since they all possess a free phenol hydroxyl group in their functional moiety. Vitamin E is relatively nontoxic and well tolerated by humans.11 The impact of α-tocopherol in the prevention of chronic diseases believed to be associated with oxidative stress has often been studied, and beneficial effects were demonstrated.13 It has been reported to induce apoptosis in erythroid leukemia, prostate cancer cells, and breast cancer cells.14 Many studies in the literature suggested vitamin E a suitable candidate for the adjuvant treatment of cancer since it is an important micronutrient essential for preserving balance between antioxidant and pro-oxidant reactions in tissues.11 Naturally, α-tocopherol is predominantly found in peanuts, almonds, and sunflower seeds.15
Research involving natural products in designing effective chemotherapy for oral cancer is well recognized in the discovery of modern drugs. More than 50% anticancer drugs are from compounds and derivatives of natural products.16 The essential oil from Levisticum officinale, for example, was reported to be effective in inducing growth inhibitory activities on human head and neck squamous carcinoma cells,17 while honokiol from Magnolia sp. exhibited antitumor activities on oral squamous carcinoma cells (OSCC).18 Continuous search for new active compounds with anticancer activities is necessary to increase availability of agents/compounds with less toxicity but with potential of producing more effective results.
In an earlier report, Sakagami et al19 attributed the consistent increase of OSCC to the decline in apoptotic potential and immunity observed in cancerous cells, accompanied by the loss of their ability to differentiate.20 Elimination of unwanted cells is a programmed activity during which apoptosis destroys the unnecessary or harmful cells and tissues to apoptotic bodies that are then removed and degraded by phagocytosis.21 Outcome of several molecular studies suggested that OSCC may result from the imbalance of the regulation between cell survival and apoptosis.19 In other words, for tissue homeostasis, alongside gene-directed program that controls proliferation and differentiation of involved cells, the balance can also be regulated by factors that influence cell survival.12
Methods
Preparation of Cell Lines
Human OSCC cell line, ORL-48 and human epidermal keratinocytes (HEK) were used in the study. ORL-48 obtained from the Cancer Research Institute and Foundation, Subang Jaya Medical Centre (CARIF, Malaysia) was developed from a female patient with gum tumor. The cell line was cultured in DMEM (Delbecco’s modified Eagle medium) F-12 medium (Gibco, Gaithersburg, MD, USA) supplemented with 10% fetal bovine serum, 2 mL of penicillin-streptomycin and 1 mL of amphotericin B. The HEK cell line (CellnTEC, Bern, Switzerland) and cultured in Cnt. Prime media (CellnTEC, Bern, Switzerland). Both cell lines were incubated at 37°C in a humidified atmosphere containing 5% CO2 (Thermo Forma, Gaithersburg, MD, USA). Keratinocytes represented the normal oral mucosa cells in the study and was included to check for the toxicity of agents on normal cells.
Preparation of Test Compounds
Cisplatin or commercially known as cis-diammineplatinum (III) dichloride (Sigma-Aldrich, Selangor, Malaysia) was diluted in 1% dimethyl sulfoxide (DMSO) and later prepared to the desired concentrations for used in experiments. α-Tocopherol (Sigma-Aldrich, Selangor, Malaysia) was diluted in 100% DMSO as stock solution and further diluted to the desired concentrations for used in the experiments (DMSO 1%). The DMEM F-12 was used for the dilution to the desired concentration.
Assessment of Cytotoxicity
The antiproliferative activity of α-tocopherol and cisplatin on ORL-48 and HEK cells were assessed based on a colorimetric assay using neutral red dye.22 Briefly the ORL-48 and keratinocytes cells were seeded at 3 × 10⁴ cells/mL in 96-well plates (Sigma-Aldrich, Selangor, Malaysia). One hundred micrograms per milliliter stock of α-tocopherol and 2000 µg/mL of cisplatin were diluted to varying concentrations of 0.1, 1.0, 2.5, 5.0, 7.5, and 10.0 µg/mL in separate wells using DMEM F-12 containing 10% foetal bovine serum, 1% penicillin-streptomycin, and amphotericin B. The cultures were incubated in a humidified incubator over a period of 72 hours at 37°C and 5% CO2. Wells containing cells in the absence of the agents represented the negative control for the test. Following incubation, the culture medium was discarded and replaced with 100 µL neutral red (1% v/v). The culture plates were further incubated for 2 hours after which the cells were washed with 1 mL of solution containing 1% sodium dodecyl sulfate. The culture plates were placed on a rocker (Sigma-Aldrich, Selangor, Malaysia) for 30 minutes and the density of the detached viable cells that absorbed the red dye was assessed based on the optical absorbance read using an ELISA (enzyme-linked immunosorbent assay) microplate reader (BioTek, Winooski, VT, USA) at a wavelength of 540 nm. The concentration of compounds causing 50% of cell death known as the inhibition concentration (IC50) was determined by a graph of percentage of cell death versus concentrations of the compounds. The experiment was repeated three times in triplicate (n = 9). Similar procedure was carried out on HEK for toxicity evalution purposes. The percentage of inhibition at every concentration was calculated using the formula stated below, where OD denotes optical density.
DNA Fragmentation Analysis
Gel electrophoresis was used to determine the induction of apoptosis by observing the band pattern of DNA fragments from ORL-48 compound-treated cells.22,23 The Suicide-Track DNA Ladder Isolation kit (Merck Millipore, Norcross, GA, USA) was used for the determination whereby a nonisotopic method was used for the detection of DNA laddering in monolayer ORL-48 cells.
DNA Collection
Cells cultured in 6-well titer plates for 48 hours were detached by the addition of accutase (PAA, Pasching, Austria). Following centrifugation at 4000 rpm, the cell pellet was resuspended to a concentration of 5 × 10⁵ to 1 × 10⁶ cells/mL using a Septer 2.0 cell counter (Merck Millipore, Norcross, GA, USA). Prior to electrophoresis, the cells were centrifuged and resuspended in 55 µL of solution #1 (kit component no. JA1825) followed by the addition of 20 µL of solution #2 (kit component no. JA1826). Following an hour’s incubation at 37°C, 25 µL of solution #3 (kit component no. JA1827) was added, gently mixed, and reincubated overnight at 50°C. Two microliters of Pellet Paint Co-Precipitant (kit component no. JA1836), 60 µL of 3 M sodium acetate, and 662 µL of 2-propanol were then added. Following gentle mixing, the microvial was left to stand at room temperature for 2 minutes or until a pink pellet was clearly visible at its bottom. The microvial was centrifuged at 15 000 to 16 000 × g for 5 minutes, and the cell pellet was rinsed twice with 500 µL of 70% ethanol followed by 500 µL of 100% ethanol. Following centrifugation, the final cell pellet was collected, air dried to remove excess ethanol, and resuspended in 50 µL of resuspension buffer.
Gel Preparation
Agarose gel (0.75%) of 0.75 cm thick was prepared in TBE (Tris/borate/EDTA) with the addition of 0.5 mg/mL of ethidium bromide. The agarose mixture was poured into an electrophoresis chamber and a gel comb was inserted to create wells for the test compounds. Once solidified, the gel was transferred into a gel buffer tank. Five microliters of DNA ladder cells were seeded at concentration of 3 × 10⁵ cells/2 mL cell culture media into 6-well plates. After 24 hours of incubation in a CO2 incubator at 37°C, the cells were treated with the test compounds at determined concentrations (0, 2.5, 5.0, 7.5, 10.0 µg/mL). The compound-treated cells were further incubated for 72 hours, after which the cells were washed using 1 mL of phosphate buffered saline (PBS) and detached from each well by 1 mL of accutase. The cells suspension was then centrifuged at 1000 × g for 10 minutes. The DNA in the cell pellet was extracted with Suicide TrackTM DNA Isolation Kit (Merck Millipore, Norcross, GA, USA), as described by the manufacturer. Six microliters of DNA were electrophoresed on 0.75 % agarose gel containing 5 µg/mL ethidium bromide. After electrophoresis, DNA fragments were analyzed with ultraviolet-illuminated camera. Samples in gel loading buffer were carefully loaded into the wells, and 5 µL of 100 bp laboratory DNA ladder was used as a marker. The electrophoresis was run at a constant ∼50 V until the dye front has reached 1 to 2 cm from the bottom of the gel. The gel was then examined through ultraviolet illumination for the detection of DNA products of the compound-treated cancer cells.
Assessment of Morphological Activity
Changes to the morphology of ORL-48 cells in response to treatment by cisplatin and α-tocopherol were monitored, periodically captured and analyzed.23 Briefly, time-lapse microscopy analysis was conducted in a setup encompassing a direct heat CO2 incubator (Thermo Forma, Gaithersburg, MD, USA) and a live resolution digital microscope (in incubator) connected to a LCD touch screen (Juli Br-Live cell movie analyzer, NanoEn Tek, Pleasanton, CA, USA). In the analysis, suspension of cells at a concentration of 3 × 10⁶ cells/mL was dispensed into 6-well titer plates prior to the addition of 200 µL of the respective compounds at concentrations of 2.5 µg/mL. The proliferation of cells under the influence of the respective compounds was closely monitored at specific incubation period of 0, 3, 6, 24, 48, and 72 hours following the addition of the compounds. Responses of the proliferating cells on exposure to the compounds were viewed and captured under Juli Br-Live cell movie analyzer. Images of cells captured at 0 hours showed distribution of cells prior to treatment. The untreated cells represented the control for the experiment. The plate was then incubated in a CO2 incubator.
Ultrastructural Analysis
Analysis on the effect of α-tocopherol and cisplatin on the ultrastructure of intracellular organelles of ORL-48 cells was assessed using a transmission electron microscope (TEM). Examination of ultrastructural characteristics and changes to its morphology induced by α-tocopherol and cisplatin was focused on monolayer of the respective cells treated with 2.5 µg/mL of the respective compound. Following the addition of compounds, the monolayers were retrieved from the incubator at 3 hours. The extract-treated monolayers were then processed for TEM examination. The treated monolayer of cells was fixed by adding 4.0% glutaraldehyde in phosphate buffer in a dropwise manner overnight. The fixative was discarded and the monolayers were washed 2 to 3 times using cacodylate buffer. The monolayers were postfixed in osmium tetroxide for 2 hours at 4°C. The fixed cells were then washed with cacodylate buffer and double distilled water. They were then dehydrated through a graded series of ethanol (concentration range of 35%, 50%, 70%, 95%) and propylene oxide. The sets of fixed cell monolayers were then infiltrated with epoxy resin, embedded by inverting the cover slips over resin-filled flat embedding molds. The resins were allowed to polymerize overnight at 70°C. After polymerization, the cover slips were removed from the resin blocks by brief immersion in liquid nitrogen. The resin blocks that contained the cell monolayers, were transversely sectioned to approximately 1.0 µm thickness with regard to their culture substratum. The sections were stained with lead citrate and uranyl acetate. Once the sections were ready, the ultrastructure of the cells were examined under the TEM. The examination was mainly focused on the ultrastructural changes that occurred in the first 3 hours of treatment.
Immunohistochemical (IHC) Staining Using Flow Cytometry: TUNEL Assay
The FragEL DNA Fragmentation Detection Kit (Merck Millipore, Norcross, GA, USA) was used for the determination of terminal deoxynucleotidyltransferase (TdT)–mediated dUTP nick end labelling (TUNEL) technique. It quantitates and detects the presence of apoptotic cells. ORL-48 cells were seeded at concentration of 1.0 × 10⁶ cells/mL into 6-well plates. The cells were treated and then placed in a CO2 incubator. After the incubation period, the cells were pelleted down by centrifugation at 4°C, at a speed of 1000 rpm for 5 minutes. The media was removed and the cells were resuspended in 4% formaldehyde/PBS to a cell density of 1.0 × 10⁶ cells. The suspension was left to stand at room temperature for 10 minutes before it was again pelleted down by centrifugation. It was suggested by the manufacturer that once fixed the cells can be stored at 4°C for 2 to 6 months. The pelleted cells were collected and resuspended in 80% ethanol to fix the cells. One milliliter of the fixed cells was then transferred into a fresh microcentrifuge tube and centrifuged at 1000 rpm for 5 minutes at room temperature. The ethanol was then removed and the cells were collected and resuspended in 200 µL of Tris buffered saline (TBS) before it was left standing at room temperature for 10 minutes. Following that the cells were again pelleted down, the TBS removed, and the cells were resuspended in 100 µL of 20 µg/mL proteinase K. After 5 minutes, the cells were pelleted down, resuspended in 100 µL of TdT equilibration buffer, and incubated at room temperature for 10 to 30 minutes. The cells were then collected and 60 µL of TdT labeling reaction mixture was added. Following gentle mixing and incubation at 37°C for 1 to 1.5 hours in the dark, the reaction mixture was removed by centrifugation and the cell pellet was resuspended in 200 µL of TBS. The cells were once again washed before a volume of 0.5 mL of TBS was added. The cells labeled with Fluorescein-FragEL were analyzed using a flow cytometry system FACscanto II (BD Biosciences, San Jose, CA, USA) with emission wavelength at 517 nm.
FITC Annexin V-Biotin Apoptosis Assay
FITC (fluorescein isothiocyanate) Annexin V staining precedes the loss of membrane integrity that accompanies the latest stages of cell death resulting from either apoptotic or necrotic processes. FITC Annexin V was used to quantitatively determine the percentage of cells within a population that are actively undergoing apoptosis. Cisplatin/α-tocopherol was added to 1 × 10⁶ of ORL-48 cells. Following incubation, the treated ORL cells were washed with PBS and detached by accutase. Following centrifugation, the cell pellet was resuspended in 1X Binding Buffer at a concentration of 1 × 10⁶ cells/mL. One hundred microliters of the solution were transferred (1 × 10⁵ cells) to a 5 mL culture tube. Five microlitres of FITC Annexin V and 5 µL of propidium iodide (PI) were added. The cells were gently vortexed and incubated for 15 minutes at room temperature (25°C) in the dark. Finally, 400 µL of 1X Binding Buffer was added to each tube. Within 1 hour, analysis by flow cytometry (FACscanto II system) was performed.
Cell Cycle Analysis
ORL-48 cells were seeded into 6-well culture plates at 3 × 10⁴ cells/mL and incubated overnight in 5% CO2 humidified incubator at 37°C. Cells were treated with α-tocopherol and cisplatin and further incubated. Accutase was added to detach the treated cells, which were then resuspended in PBS and transferred to polypropylene tubes. Cells were harvested by centrifugation at 4000 rpm (10 minutes). One hundred milliliters of lysis reagent were added to each tube. Following a 5-minute incubation at room temperature, the cells were stained with 300 mL PI using the Cycle TEST TM PLUS DNA Reagent Kit and incubated for 15 minutes at 37°C. Cell cycle was read using the Cell Quest software within 3 hours. Results were analyzed using the flow cytometry system FACscanto.
Statistical Analysis
Results were computed and expressed as mean ± standard deviation (SD) from 3 determinations performed in triplicate (n = 9).
Results
Cytotoxicity Activity
Both α-tocopherol and cisplatin exhibited antiproliferative activity on ORL-48 cells. The inhibitory concentrations (IC50) were determined at 2.5 ± 0.4 and 1.0 ± 0.2 µg/mL, respectively for α-tocopherol and cisplatin. The IC50 of α-tocopherol and cisplatin on keratinocytes were 4.08 ± 0.05 and < 0.1 µg/mL, respectively (Table 1). This suggested the cytotoxic effect of cisplatin on normal human epidermal keratinocytes.
Table 1.
Cytotoxic Activity of Cisplatin and α-Tocopherol on Cancerous Oral Mucosal Cells ORL-48 and Human Epidermal Keratinocytes Measured by the Concentration Required to Inhibit 50% of Cell Proliferation (IC50).
| Treatment | IC50 (µg/mL) |
|
|---|---|---|
| Oral Mucosal ORL-48 | Human Epidermal Keratinocytes | |
| Cisplatin | 1.0 ± 0.2 | <0.1 |
| α-Tocopherol | 2.5 ± 0.4 | 4.08 ± 0.05 |
Morphological Responses of ORL-48 to α-Tocopherol and Cisplatin
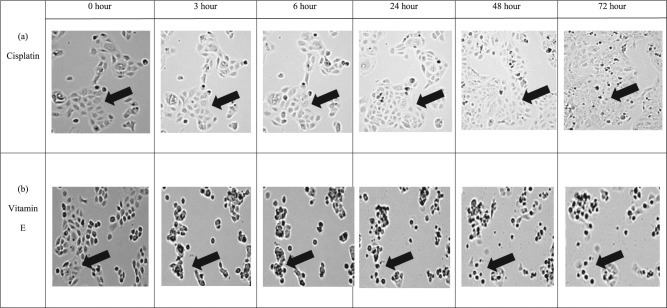
At 2.5 µg/mL, α-tocopherol incurred significant changes to the morphology of ORL-48 cells with shrinkage of cells observed at 3 hours following treatment, which then showed the appearance of apoptotic bodies at 24 hours (Figure 1B). Gradual reduction in cell population was also observed over treatment period from 3 to 72 hours of incubation. Comparatively, no change in the morphology of cisplatin-treated ORL-48 was observed in the first 6 hours of treatment. At 24 hours, the morphology of cells remained unchanged but the sizes were observed much smaller. In contrast to α-tocopherol, no apoptotic bodies were formed with cisplatin (Figure 1A). Instead, a gradual increase in cell population was noticed from the 24-hour time point onward.
Figure 1.
Time lapse microscopy recorded changes on ORL-48 cells on treatment with both (A) 2.5 µg/mL of cisplatin and (B) 2.5 µg/mL of α-tocopherol (vitamin E) over a period of 72 hours. Images were captured using Juli Br-Live cell movie analyzer (40× magnification).
Ultrastructural Analysis
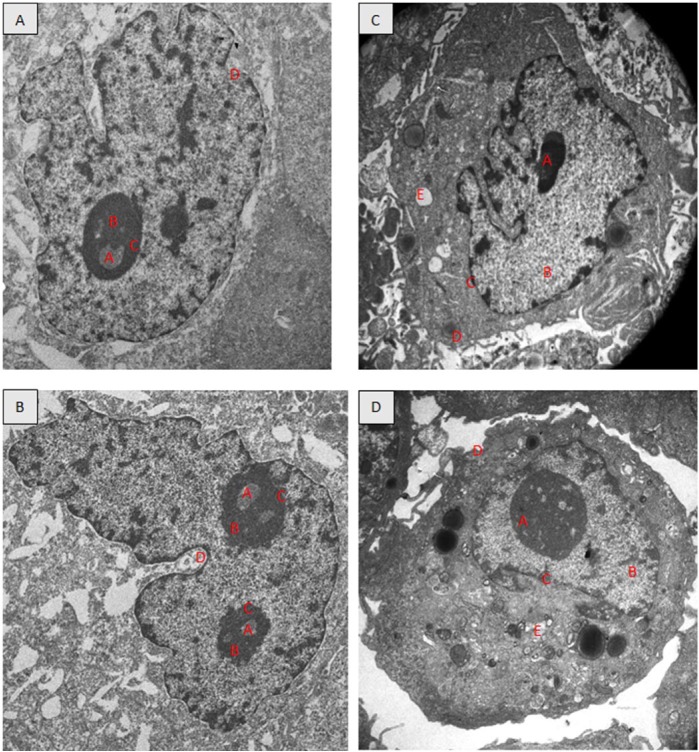
TEM revealed the ultrastructure of the untreated ORL-48 cells (Figure 2A) were generally round. The nucleus is round and contained 1 prominent nucleolus. No signs of chromatin condensation and the cells were cells actively undergoing division (Figure 2B). By contrast, for ORL-48 treated with 2.5 µg/mL of cisplatin and α-tocopherol, none of the cells were found undergoing division. Instead of the enlargement of the nucleus size, vacuole formation, signs of chromatin condensation, and blebbing of membrane plasm was observed for both treatments. The nucleolus gets smaller with the treatment of 2.5 µg/mL cisplatin.
Figure 2.
Transmission electron micrographs showing the ORL-48 cells; untreated (A and B), treated with 2.5 µg/mL cisplatin (C), and treated with 2.5 µg/mL α-tocopherol (D). (4000× magnification). A, nucleolus; B, nucleus; C, nuclear membrane; D, plasma membrane; E, vacuole.
DNA Fragmentation Analysis
Agarose gel electrophoresis performed on ORL-48 treated with 2.5, 5.0, 7.5, and 10.0 µg/mL cisplatin showed the presence of DNA fragments in clear bands that appeared in ladder pattern. The column of bands with the highest density was obtained following treatment of ORL-48 with 7.5 µg/mL of cisplatin (Figure 3A). In contrast, defragmentation of DNA following treatment of ORL-48 with α-tocopherol produced a smearing (Figure 3B).
Figure 3.
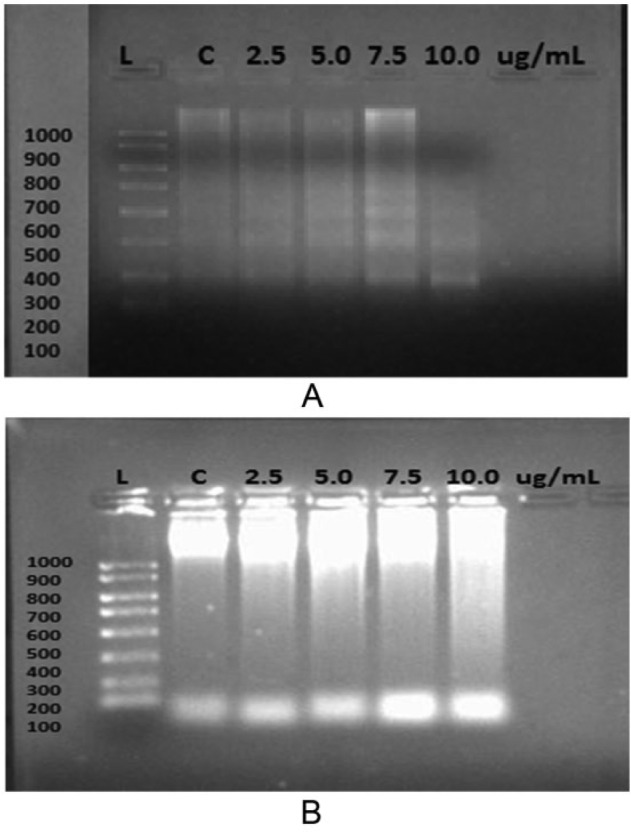
Expression of DNA fragments from ORL-48 cells after treatment with various concentrations of (A) cisplatin and (B) α-tocopherol.
Percentage Presence of Apoptotic Cells—TUNEL Assay
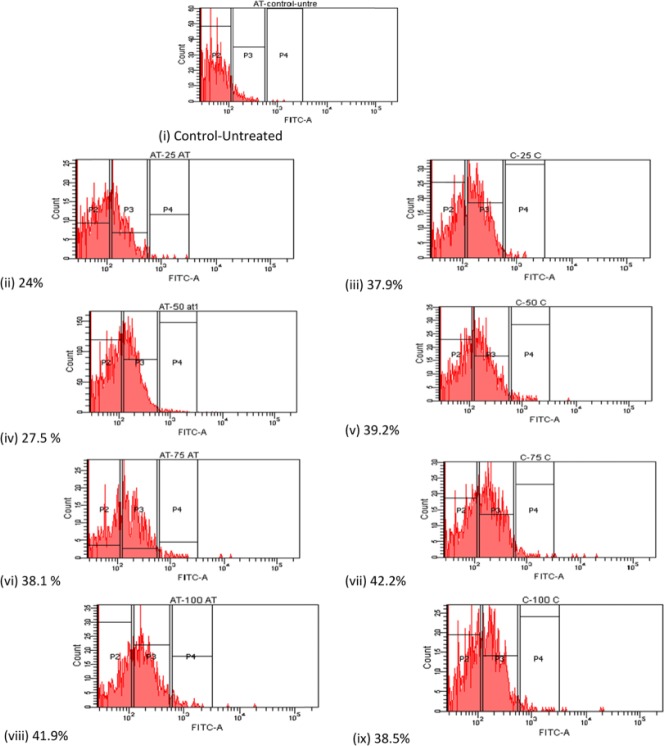
The apoptosis ratio induced by α-tocopherol and cisplatin on ORL-48 cells were quantitatively assessed by flow cytometry. Cells present in the P2 region were classified as control or untreated cancer cells. Fluorescent apoptotic cells stained with V-FITC appeared in regions labeled P3 and P4 (Figure 4) were quantitatively assessed and presented in percentage. Apoptotic cell death induced at various concentrations (2.5-10.0 µg/mL) of α-tocopherol and cisplatin was plotted as in Figure 5. A linear dose-dependent relationship between apoptotic activity and concentration of both test compounds were displayed at <2.5 µg/mL. Comparatively, however, the apoptotic strength of cisplatin was calculated 1.6-fold stronger than that displayed by α-tocopherol. At higher concentrations, apoptotic cell death seemed inconsistent, which eventually reaches a plateau.
Figure 4.
Percentage presence of apoptotic cells on treatment at various concentrations of α-tocopherol comparative to cisplatin: (i) Control; (ii), (iv), (vi), and (viii)—2.5, 5.0, 7.5, and 10.0 µg/mL of α-tocopherol, respectively and (iii), (v), (vii), and (ix)—2.5, 5.0, 7.5, and 10.0 µg/mL of cisplatin, respectively.
Figure 5.
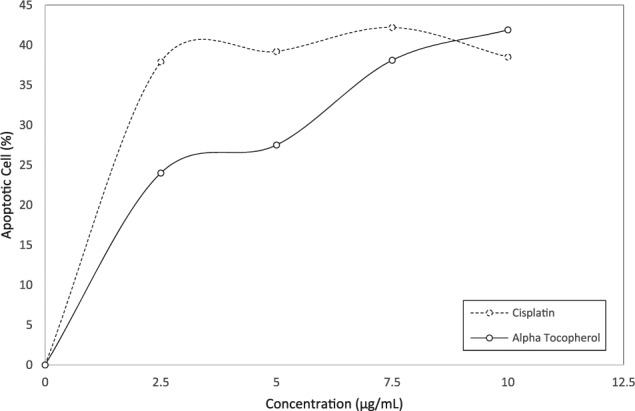
Graph showing the effect of both cisplatin and α-tocopherol at various concentrations on the apoptotic activity of ORL-48. The percentage presence of apoptotic cells was generated from flow cytometry observations in Figure 4.
Apoptotic Cell Presence Using Annexin V-Biotin Apoptosis Assay
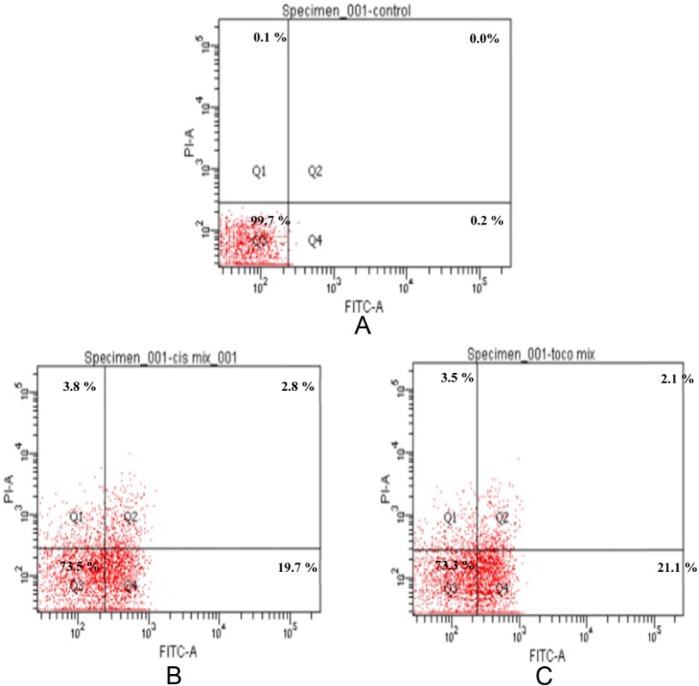
The induction of programmed cell death exerted by cisplatin and α-tocopherol on ORL-48 cells were determined by flow cytometry using Annexin V-FITC/PI double staining approach. Untreated cell was found in the lower left quadrant of the cytograms, these viable cells excluded PI and were negative for Annexin V binding. The upper right quadrant represents the nonviable, necrotic cells, positive for Annexin V binding and showing PI uptake. The lower right quadrant represents the apoptotic cells, Annexin V positive and PI negative, demonstrating Annexin V binding and cytoplasmic membrane integrity (Figure 5). Treated ORL-48 cells were stained positive for Annexin V and negative for propidium iodide (FITC+/PI−) with a significant increase of apoptotic cells from 0.2% to 19.7% (cisplatin) and 21.1% (α-tocopherol) (Figure 6).
Figure 6.
Dot plots of Annexin V-FITC/PI–stained ORL-48 cells exposed to (A) control (media only), (B) 2.5 µg/mL cisplatin, and (C) 2.5 µg/mL α-tocopherol. The 4 quadrants represent necrotic cells (Q1: Annexin V negative; PI positive), late apoptotic or necrotic cells (Q2: Annexin V positive; PI positive), viable cells (Q3: Annexin V negative; PI negative), and early apoptotic cells (Q4: Annexin V positive; PI negative). Numbers indicate the percentage of cells in each quadrant and a minimum of 10 000 events were read.
Cell Cycle Analysis
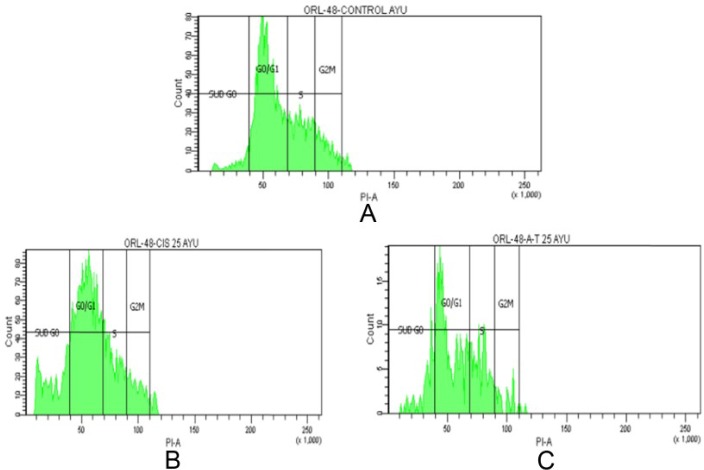
At different stages of the cell cycle, cell nuclei contain different amounts of DNA. Flow cytometry was used to analyze cell cycle distribution of ORL-48 cells following exposure to cisplatin and α-tocopherol. It was determined that cell cycle arrest was induced at the Sub G0 phase (Table 2) for both cisplatin and α-tocopherol showing a significant (P < .05) increase in cell population from 7.0% to 19.7% and 7.0% to 21.4%, respectively. Most of the cells were accumulated in the G0/G1 peak for both (Figure 7).
Table 2.
Effect of Cisplatin and α-Tocopherol on Cell Cycle Distribution of ORL-48 Cells.
| Treatment | Sub G0 (%) | G0/G1 (%) | S (%) | G2/M (%) |
|---|---|---|---|---|
| Control | 7.0 | 28.4 | 12.8 | 10.4 |
| Cisplatin | 19.7 | 24.1 | 11.8 | 8.7 |
| α-Tocopherol | 21.4 | 27.7 | 15.5 | 5.1 |
Figure 7.
Cell cycle distribution of ORL-48 cells treated with (A) control, (B) 2.5 µg/mL cisplatin, and (C) 2.5 µg/mL α-tocopherol.
Discussion
Cisplatin is a widely prescribed chemotherapeutic drug reported efficient in treating head and neck squamous cell carcinoma.24 However, the limiting factor of this drug is that it has also been found to cause ototoxicity, gastrotoxicity, myelosuppression, nephrotoxicity, and allergic reactions and the effect is reported to be dose dependent.25 It was reported much earlier that at low concentrations, cisplatin induces apoptotic cell death but at higher concentration, necrosis ensues.26 Other report explained the cytotoxic action of cisplatin was determined through interaction with DNA, and cell death was exhibited by the loss of cell attachment to the ground matrix resulting in floating cells, accompanied also by blebbing of the cell membrane.27 It is thus important to determine whether any cellular response to cisplatin is a function of the extent of drug uptake or whether it reflects the inherent cellular sensitivity to DNA damage. Studies have shown that cultured mammalian cells vary widely in their capacity to tolerate cisplatin-induced DNA damage.28,29 To enhance the antitumor effect of cisplatin, a combinatorial chemotherapy approach whereby cisplatin was used together with agents such as etoposide and bleomycin are being studied.30
α-Tocopherol was reported effective in enhancing the tumor growth inhibition activity of cisplatin. α-Tocopherol is said to function by modulating the permeability of tumour cell membrane that increases the influx of cisplatin, which then causes the DNA repair machinery to be less efficient due to increased efficiency of adduct formation in the DNA molecule. This effect of α-tocopherol would then render cisplatin more effective as an antitumour agent.31 As an active isomer of vitamin E, α-tocopherol is known for its potent antioxidant property. With free phenol hydroxyl group present in its functional moiety, α-tocopherol suppresses the toxic effect of free radicals through the interaction of a variety of cellular molecules that eventually leads to the inhibition or alteration of cell function through lipid peroxidation. α-Tocopherol has also been reported to induce apoptosis in erythroid leukemia and in prostate and breast cancer cells.14
In this in vitro study, both α-tocopherol and cisplatin showed strong antitumor activity on cancer cells ORL-48 with 50% of growth inhibition (IC50) determined at 2.5 ± 0.4 and 1.0 ± 0.2 µg/mL, respectively (Table 1). The antiproliferative effect of α-tocopherol on oral cancer cells ORL-48 was promising since very low dose was enough to inhibit 50% of ORL-48 proliferation. This property is also shared by α-tocopheryl succinate (TOS), another isomer of vitamin E that exhibited similar activity on 2 human head and neck squamous cell cancer cell lines (JHU-013 and JHU-022 cell lines) at low IC50 of 8.6 µg/mL.32
As expected of a chemotherapeutic antitumor agent, the antiproliferative strength of cisplatin was determined 2.5-fold stronger than α-tocopherol. However, an important concern over the application of cisplatin as an anticancer drug is that it was determined cytotoxic on normal human oral keratinocytes (Table 1). This adds to the concerns of earlier researchers on the nonselectivity of this drug on targeted carcinogenic cells.10 Combining the therapeutic effects of cisplatin with other active agents thus, is heavily undertaken with the aim to enhance its antitumor activity on cisplatin-resistant tumor and at the same time to reduce its side effects that would improve the clinical condition of patients.31 In this study, it was found that in contrast to cisplatin, α-tocopherol was determined nontoxic on normal human keratinocytes and exhibited promising antitumor activity on squamous oral cancer cells ORL-48. It has been reported that the activity of α-tocopherol could be associated with the presence of chromanol ring system in its structure. Chromanols are a family of phenolic compounds that in addition to a chromanol ring system also has a 16-carbon aliphatic side-chain. The presence of chromanol is said to target mitochondria, which exhibit the selective anti-proliferative effects.33 α-Tocopherol is also an intracellular antioxidant which has been reported to inhibit lipid peroxidation of polyunsaturated fatty acid located in lipid membrane.34
With regard to the mechanism of cell death, α-tocopherol was found to induce morphological effect on ORL-48. Through time lapse monitoring, alteration of cell morphology that included distinct shrinkage of cell sizes was observed very early at 3 hours of treatment, and gradually became prominent over the 72-hour treatment period before it finally showed the appearance of apoptotic bodies at 24 hours (Figure 1B). Most of the characteristics reported as signs of apoptosis in earlier references were observed. Gradual reduction in cell population with time was also noted. Interestingly, however, these observations were not exhibited following cisplatin-treatment. Instead, a slow but gradual increase in cell population was noticed (Figure 1A). The contrasting morphological responses of ORL-48 induced by tocopherol and cisplatin may suggest the different adaptation of ORL-48 when cultured under in vitro condition.35 Morphologic heterogeneity is a typical feature of malignant cell lines and has usually been attributed to genetic instability and clonal evolution. It was reported that this behaviorally different subpopulation is probably due to the presence of cells with a range of differing proliferative capabilities, suggesting the presence of cells having differing clongenic potentials.35 This situation may suggest the suppression of meroclones and paraclones in ORL-48 by cisplatin, leaving behind the holoclones. Holoclone is the most proliferative morphologic heterogeneity, which then regrows to harbor tumorigenic cells as indicated by the gradual increased in cell population observed following its treatment (Figure 1A); hence suggesting its resistance to cisplatin therapy.
The apoptotic effect of cisplatin on ORL-48 was validated by the ladder pattern of defragmented DNA bands produced by electrophoresis. Such pattern was observed for cisplatin with bands of best intensity obtained at 7.5 µg/mL of cisplatin (Figure 3A). Despite the signs of apoptosis exhibited on ORL-48 by α-tocopherol (Figure 1B), the ladder band pattern was not observed, instead replaced by a smearing (Figure 3B). The absence of DNA defragmentation activity was suggested not an absolute indication of negative apoptosis. It has been reported earlier that cells can also undergo apoptosis without showing DNA fragmentation due to lack of caspase-3, which is essential for fragmentation of cell chromosomal DNA during tumor necrosis factor–induced apoptosis.36 Caspase activates the endonuclease caspase-activated DNase (CAD) responsible for fragmentation of the DNA at the linker region between nucleosomes.37,38 Results obtained through immunohistochemical and flow cytometric procedures strongly suggested the apoptotic mode of activity by both test agents on ORL-48 (Figure 3). The apoptotic activity of both α-tocopherol and cisplatin was also found to follow a dose-dependent relationship in TUNEL assay at concentration of 2.5 µg/mL and lower (Figure 4). The apoptotic strength of cisplatin at this concentration was however, significantly 1.6-fold stronger than α-tocopherol (P < .05). The apoptotic activity of both compounds was not stable at higher concentrations (Figure 4). Apoptotic cell death by both test agents was further validated by Annexin V-FITC (Figure 5) and TEM micrographs. Figure 2 showed the presence of cellular shrinking, chromatin condensation, and blebbing of plasma membrane.
Cell cycle arrest is a stopping point in the cell cycle and this was induced at the sub-G0 phase for both cisplatin and α-tocopherol (Table 2) showing a significant increase in cell population from 7.0% to 19.7% and 7.0% to 21.4%, respectively (P < .05). It is a resting phase, a period in the cell cycle in which cells exist in a quiescent state where the cell is neither dividing nor preparing to divide, or a distinct quiescent stage that occurs outside of the cell cycle. Most of the cells were accumulated in the G0/G1 peak for both. Any stimulus that initiates cell proliferation needs to promote G0/G1 transition and the entry of cells into the first, that is, G1, phase of the cycle. Once the cells enter the S phase, the DNA is replicated and the cell progresses through G2 and mitosis.39
This is the first part of the study to look into the in vitro responses of α-tocopherol. In order to further study the usefulness of α-tocopherol, a follow-up study on this may include its oral administration in nude mice or in mice where oral cancer is already induced.
Conclusion
Concluding from the study, α-tocopherol was found to exhibit strong antitumor activity on oral cancer cell ORL-48 without incurring toxicity on human epidermal keratinocytes. Despite exhibiting lower antiproliferative potency comparative to cisplatin, the induction of cell death by α-tocopherol occurred much earlier. The mode of cell death by α-tocopherol suggested by electrophoresis and flow cytometry techniques was via apoptosis. The mechanism of action may involve damaging the plasma membrane, which then leads to shrinking of the cells without involving the activation of caspase molecules as in many cases of antitumor activity. It is thus concluded that α-tocopherol showed potential as a good antitumour agent for used in the treatment of oral cancer and hence, merits further investigations into its specific molecular targets in order to be put it into use for the treatment of cancers.
Footnotes
Declaration of Conflicting Interests: The author(s) declared no potential conflicts of interest with respect to the research, authorship, and/or publication of this article.
Funding: The author(s) disclosed receipt of the following financial support for the research, authorship, and/or publication of this article: The authors received financial support from the High Impact Research MoE Grant (UM.C/625/1/HIR/MoE/15) from the Ministry of Education Malaysia.
References
- 1. National Cancer Institute. SEER stat fact sheets: oral cavity and pharynx cancer. 2015. http://seer.cancer.gov/statfacts/html/oralcav.html. Accessed December 22, 2015.
- 2. Ko YC1, Huang YL, Lee CH, Chen MJ, Lin LM, Tsai CC. Betel quid chewing, cigarette smoking and alcohol consumption related to oral cancer in Taiwan. J Oral Pathol Med. 1995;24:450-453. [DOI] [PubMed] [Google Scholar]
- 3. El-Mofty S. Early detection of oral cancer. J Oral Maxillofac Surg. 2010;1:25-31. [Google Scholar]
- 4. Doll R, Peto R. The causes of cancer: quantitative estimates of avoidable risks of cancer in the United States today. J Natl Cancer Inst. 1981;66:1191-1308. [PubMed] [Google Scholar]
- 5. Willett WC. Diet and cancer. Oncologist. 2000;5:393-404. [DOI] [PubMed] [Google Scholar]
- 6. Borner MM, Dietrich D, Stupp R, et al. Phase II study of capecitabine and oxaliplatin in first- and second-line treatment of advanced or metastatic colorectal cancer. J Clin Oncol. 2002;20:1759-1766. [DOI] [PubMed] [Google Scholar]
- 7. Liu G, Franssen E, Fitch MI, Warner E. Patient preferences for oral versus intravenous palliative chemotherapy. J Clin Oncol. 1997;15:110-115. [DOI] [PubMed] [Google Scholar]
- 8. DeMario MD, Ratain MJ. Oral chemotherapy: rationale and future directions. J Clin Oncol. 1998;16:2557-2567. [DOI] [PubMed] [Google Scholar]
- 9. Payne SA. A study of quality of life in cancer patients receiving palliative chemotherapy. Soc Sci Med. 1992;35:1505-1509. [DOI] [PubMed] [Google Scholar]
- 10. Searle J, Lawson TA, Abbott PJ, Harmon B, Kerr JFR. An electron-microscope study of the mode of cell death induced by cancer chemotherapeutic agents in populations of proliferating normal and neoplastic cells. J Pathol. 1975;116:129-138. [DOI] [PubMed] [Google Scholar]
- 11. Constantinou C, Papas A, Constantinou AI. Vitamin E and cancer: an insight into the anticancer activities of vitamin E isomers and analogs. Int J Cancer. 2008;123:739-752. [DOI] [PubMed] [Google Scholar]
- 12. Lowe SW, Lin AW. Apoptosis in cancer. Carcinogenesis. 2000;21:485-495. [DOI] [PubMed] [Google Scholar]
- 13. Brigelius-Flohé R, Traber MG. Vitamin E: function and metabolism. FASEB J. 1999;13:1145-1155. [PubMed] [Google Scholar]
- 14. Sigounas G, Anagnostou A, Steiner M. dl-α-tocopherol induces apoptosis in erythroleukemia, prostate, and breast cancer cells. Nutr Cancer. 1997;28:30-35. [DOI] [PubMed] [Google Scholar]
- 15. McLaughlin PJ, Weihrauch JL. Vitamin E content of foods. J Am Diet Assoc. 1979;75:647-665. [PubMed] [Google Scholar]
- 16. Kim HK, Wilson EG, Choi YH, Verpoorte R. Metabolomics: a tool for anticancer lead-finding from natural products. Planta Med. 2010;74:1539-1555. [DOI] [PubMed] [Google Scholar]
- 17. Sertel S, Eichhorn T, Plinkert PK, Efferth T. Chemical composition and antiproliferative activity of essential oil from the leaves of medicinal herb, Levisticum officinale, against UMSCC1 head and neck squamous carcinoma cells. Anticancer Res. 2011;31:185-191. [PubMed] [Google Scholar]
- 18. Chen XR, Lu R, Dan HX, et al. Honokiol: a promising small molecular weight natural agent for the growth inhibition of oral squamous cell carcinoma cells. Int J Oral Sci. 2011;3:34-42. [DOI] [PMC free article] [PubMed] [Google Scholar]
- 19. Sakagami H, Kobayashi M, Chine CH, Kanegae H, Kawase M. Selective toxicity and type of cell death induced by various natural and synthetic compounds in oral squamous cell carcinoma. In Vivo. 2007;21:311-320. [PubMed] [Google Scholar]
- 20. Vogelstein B, Kinzler KW. Cancer genes and the pathways they control. Nat Med. 2004;10:789-799. [DOI] [PubMed] [Google Scholar]
- 21. Wilfried R, Reed JC. Apoptosis and cancer: when BAX is TRAILing away. Nat Med. 2002;8:216-218. [DOI] [PubMed] [Google Scholar]
- 22. Majid MZ, Zaini ZM, Razak FA. Apoptosis-inducing effect of three medicinal plants on oral cancer cells KB and ORL-48. Sci World J. 2014;2014:1-8. [DOI] [PMC free article] [PubMed] [Google Scholar]
- 23. Elmore S. Apoptosis: a review of programmed cell death. Toxicol Pathol. 2007;35:495-516. [DOI] [PMC free article] [PubMed] [Google Scholar]
- 24. Boulikas T, Vougiouka M. Recent clinical trials using cisplatin, carboplatin and their combination chemotherapy drugs (review). Oncol Rep. 2004;11:559-595. [PubMed] [Google Scholar]
- 25. Miller RP, Tadagavadi RK, Ramesh G, Reeves WB. Mechanisms of cisplatin nephrotoxicity. Toxins. 2010;2:2490-2518. [DOI] [PMC free article] [PubMed] [Google Scholar]
- 26. Lieberthal W, Triaca V, Levine J. Mechanisms of death induced by cisplatin in proximal tubular epithelial cells: apoptosis vs. necrosis. Am J Physiol. 1996;270:F700-F708. [DOI] [PubMed] [Google Scholar]
- 27. Chen YH, Wang JY, Pan BS, et al. Cordycepin enhances cisplatin apoptotic effect through caspase/MAPK pathways in human head and neck tumor cells. Onco Targets Ther. 2013;6:983-998. [DOI] [PMC free article] [PubMed] [Google Scholar]
- 28. Ohkawa K, Tsukada Y, Dohzono H, Koike K, Terashima Y. The effects of co-administration of selenium and cis-platin (CDDP) on CDDP-induced toxicity and antitumour activity. Br J Cancer. 1988;58:38-41. [DOI] [PMC free article] [PubMed] [Google Scholar]
- 29. Onoda JM, Jacobs JR, Taylor JD, Sloane BF, Honn KV. Cisplatin and nifedipine: synergistic cytotoxicity against murine solid tumours and their metastases. Cancer Lett. 1986;30:181-188. [DOI] [PubMed] [Google Scholar]
- 30. Pera MF, Jr, Sessford D, Roberts JJ. Toxicity of cisplatin and hydroxymalonatodiammine platinum (II) towards mouse bone marrow and B16 melanoma in relation to DNA binding in vivo. Biochem Pharmacol. 1982;31:2273-2278. [DOI] [PubMed] [Google Scholar]
- 31. Sarna S, Kumar A, Bhola RK. α-Tocopherol enhances tumour growth inhibition by cis-dichlorodiammine platinum (II). Braz J Med Biol Res. 2000;33:929-936. [DOI] [PubMed] [Google Scholar]
- 32. Gu X, Song X, Dong Y, et al. Cancer therapy: preclinical vitamin E succinate induces ceramide-mediated apoptosis in head and neck squamous cell carcinoma in vitro and in vivo. Clin Cancer Res. 2008;14:1840-1849. [DOI] [PubMed] [Google Scholar]
- 33. Cheng G, Zielonka J, McAllister DM, et al. Mitochondria-targeted vitamin E analogs inhibit breast cancer cell energy metabolism and promote cell death. BMC Cancer. 2013;13:285. doi: 10.1186/1471-2407-13-285. [DOI] [PMC free article] [PubMed] [Google Scholar]
- 34. Choi Y, Lee J. Antioxidant and antiproliferative properties of a tocotrienol-rich fraction from grape seeds. Food Chem. 2009;114:1386-1390. doi: 10.1016/j.foodchem.2008.11.018. [DOI] [Google Scholar]
- 35. Locke M, Heywood M, Fawell S, Mackenzie IC. Retention of intrinsic stem cell hierarchies in carcinoma-derived cell lines. Cancer Res. 2005;65:8944-8950. [DOI] [PubMed] [Google Scholar]
- 36. Janicke RU. Caspase-3 is required for α-fodrin cleavage but dispensable for cleavage of other death substrates in apoptosis. J Biol Chem. 1998;273:15540-15545. [DOI] [PubMed] [Google Scholar]
- 37. Enari M, Sakahira H, Yokoyama H, et al. A caspase-activated DNase that degrades DNA during apoptosis, and its inhibitor ICAD. Nature. 1998;391:43-50. [DOI] [PubMed] [Google Scholar]
- 38. Sakahira H, Enari M, Nagata S. Cleavage of CAD inhibitor in CAD activation and DNA degradation during apoptosis. Nature. 1998;391:96-99. [DOI] [PubMed] [Google Scholar]
- 39. Kumar V, Abbas AK, Fausto N, Mitchell RN. eds. Robbins Basic Pathology. 8th ed. Philadelphia, PA: Saunders Elsevier; 2007. [Google Scholar]


