Abstract
Flavokawain B (FKB) is known to possess promising anticancer abilities. This is demonstrated in various cancer cell lines including HeLa cells. Cervical cancer is among the most widely diagnosed cancer among women today. Though FKB has been shown to be effective in treating cancer cells, the exact molecular mechanism is still unknown. This study is aimed at understanding the effects of FKB on HeLa cells using a microarray-based mRNA expression profiling and proteome profiling of stress-related proteins. The results of this study suggest that FKB induced cell death through p21-mediated cell cycle arrest and activation of p38. However, concurrent activation of antioxidant-related pathways and iron sequestration pathway followed by activation of ER-resident stress proteins clearly indicate that FKB failed to induce apoptosis in HeLa cells via oxidative stress. This effect implies that the protection of HeLa cells by FKB from H2O2–induced cell death is via neutralization of reactive oxygen species.
Keywords: flavokawain B, HeLa, cervical cancer, antioxidant, iron sequestration
Introduction
Cervical cancer is the second most common type of cancer associated with high mortality in women besides breast cancer, especially in regions with low human development index.1 Reduced incidence of cervical cancer in regions with a high human development index is mainly a result of the availability of Pap smear screening.1,2 However, cervical cancer is still one of the major types of cancer that contributes to cancer-associated mortality because cancer metastasis occurs in both early- and late-detected patients. Radiotherapy is the most commonly used treatment, and chemotherapy using cisplatin has been used as adjuvant to improve the performance of radiotherapy.3 Nevertheless, the outcome of current therapy is still poor, with no further improvement in survival and toxicity.2 Thus, exploring novel cytotoxic agents that cause minimal side effects is essential.
Natural antioxidants, including flavonoids and polyphenols, derived from herbal extracts have gained increasing interest as powerful sources of safe chemopreventive and chemotherapeutic agents for cervical cancer. These antioxidants were found to specifically target cervical cancer cells via induction of apoptosis, growth arrest, and inhibition of signal transduction pathways.4 Among the antioxidants, chalcones are one of the members of the flavonoid family with promising antitumor potential. The molecular structure of chalcones is 2 aromatic rings connected by an unsaturated 3-carbon bridge. Edible plants such as kava-kava are a great source of chalcone, and chemical synthesis by the Claisen-Schmidt condensation method has made the large-scale production of chalcone for future therapeutic application possible.5 Several chalcones such as the 1,3-diphenylpropen-1-one chalcone family have been tested, with cytotoxicity against cervical cancer attributed to their inhibitory effect on proteasomal activity.6,7 Flavokawain is one type of chalcone with multiple bioactivities, including anti-inflammatory, antioxidant, and antitumor activities. There are 3 types of flavokawains—namely, flavokawain A, B, and C. Among them, flavokawain B (FKB) is the most well studied and possesses the greatest sensitivity against most of the evaluated cancer cell lines compared with flavokawain A and C.5FKB was reported to be a more potent inhibitor of hepatoblastoma HepG2 cells than cervical cancer HeLa cells via inhibition of intracellular antioxidants GSH and SOD2 and subsequently promoted intracellular oxidation and apoptosis.8 However, the detailed cytotoxicity of FKB on HeLa cells has not been well studied. To understand the flavokawain-regulated mechanism in HeLa cells, this study evaluated the gene expression profile of FKB-treated HeLa cells.
Materials and Method
Preparation of FKB and HeLa Cells
FKB was synthesized, purified, and characterized according to our previous report.9 Cervical cancer HeLa cells were purchased from ATCC (ATCC, USA) and cultured in RPMI-1640 (Sigma, USA) supplemented with 10% fetal bovine serum (GE Healthcare Life Sciences, USA) in a 37°C incubator with 5% CO2.
MTT Cell Viability Assay
Viability of FKB-treated HeLa cells was screened by the MTT cell viability assay according to Mosmann.10 Briefly, HeLa cells (8 × 10⁴ cells/mL) were seeded in a 96-well plate overnight. Then, FKB was serial diluted (ranging between 100.00 and 1.56 µM), applied to the HeLa cells, and further incubated for 72 hours. Untreated control HeLa cells were prepared concurrently. After that, MTT solution (5 mg/mL) was added to all wells and further incubated for 3 hours. After the solution was discarded, the purple crystals were solubilized with 100 µL of dimethyl sulfoxide, and the absorbance was read at a wavelength of 570 nm using a µQuant plate reader (Bio-tek Instruments, USA). The percentage of cell viability was calculated by dividing the absorbance of the sample by the absorbance of the control. The concentration that inhibited 50% of HeLa cell viability was obtained from the sigmoid curve of cell viability versus flavokawain concentration.
Cell Treatment
Based on the IC50 (half-maximal inhibitory concentration) value obtained from the MTT assay, HeLa cells were treated with 17.5 µM of FKB in 6-well plate and incubated for 24 and 48 hours. After the incubation time, untreated control and FKB-treated HeLa cells were harvested, washed, and subjected to the following bioassays.
Flow Cytometry Analyses
Flow cytometry was used to evaluate the cell cycle profile, apoptosis, and mitochondrial membrane potential of FKB-treated HeLa cells. The cell cycle profile of untreated controls and HeLa cells treated with FKB for 48 hours was evaluated using BD CycletestTM Plus DNA kit according to the manufacturer’s protocol. Briefly, harvested control and treated HeLa cells were incubated with 250 µL of Solution A (10 minutes), followed by 200 µL of trypsin inhibitor and RNase buffer Solution B (10 minutes), and finally by 200 µL of propidium iodide (PI; 10 minutes). The samples were then analyzed by BD FACSCalibur using BD CellQuest Pro software (BD, USA). For apoptosis quantification, BD Annexin-V/PI apoptosis kit (BD, USA) was used according to the manufacturer’s protocol. In brief, harvested control and FKB-treated HeLa cells were incubated with 5 µL of AnnexinV-FITC and 5 µL of PI for 15 minutes. Then, the samples were topped up with 400 µL of binding buffer and analyzed by BD FACSCalibur using BD CellQuest Pro software (BD, USA). BD MitoScreen JC-1 kit was used for quantification of mitochondrial membrane potential. In brief, harvested control and FKB-treated HeLa cells were incubated with 500 µL of JC-1 working solution (15 minutes), washed, and resuspended with 500 µL of assay buffer. The samples were then analyzed by BD FACS Calibur using BD CellQuest Pro software (BD, USA).
Gene Expression Profiling Using Microarray
Differential gene expression of untreated HeLa cells and HeLa cells treated with FKB for 48 hours was assayed by Agilent one color microarray using a human gene expression v2 microarray chip (Agilent Technologies, USA). In brief, RNA was extracted from control and FKB-treated HeLa cells by Qiagen RNeasy plus mini kit (Qiagen, USA). Then, the quantity and quality of extracted RNA were tested by nano-drop spectrometer (Eppendorf, USA) and 2100 Bioanalyzer with RNA pico chip (Agilent Technologies, USA). Three biological replicates of control and treated HeLa cell RNA with bioanalyzer RIN number >9 were subjected to microarray using SurePrint G3 Human Gene Expression 8 × 60K v2 microarray kit (Agilent Technologies, USA) according to the manufacturer’s protocol and scanned with Agilent DNA microarray scanner. Differential expression comparison between untreated controls and HeLa cells treated with FKB for 48 hours was analyzed by GeneSpring GX (Agilent Technologies, USA). Genes based on gene ontology with expression level and with significant changes as determined by Student’s t-test (P< .05) and fold changes >2 are presented in this study. The results from this microarray study can be accessed via NCBI GEO using the accession number GSE72974.
Quantitative Reverse Transcriptase Real-Time Polymerase Chain Reaction (qRT-PCR)
Total RNA subjected to microarray analysis was also validated by qRT-PCR. Briefly, the 1-µg RNA was converted to cDNA using high-capacity cDNA reverse transcription kit according to manufacturer’s protocol (LifeTechnology, USA). Next, the RT-PCR reaction to quantify differential expression of DNA-damage-inducible transcript 3 (DDIT3), hemeoxygenase (decycling)1 (HMOX1), growth arrest and DNA-damage-inducible beta (GADD45B), catalase (CAT), and glutathione peroxidase 3 (GPx3) between untreated control and FKB-treated HeLa cells was performed using Sybr green RT-PCR master mixes (LifeTechnologies, USA) on the iQ5 (Bio-Rad, USA). Forward and reverse sequence of the target genes (DDIT3, HMOX1, GADD45B, CAT, and GPx3) and housekeeping genes hypoxanthine phosphoribosyltransferase (HPRT), β-actin (ACTB), and glyceraldehyde 3-phosphate dehydrogenase (GAPDH) are listed in Table 1. The PCR condition was as follows: 1 cycle of 50°C for 2 minutes for UDG (Uracil-DNA Glycosylase) activation, 1 cycle of 95°C for 2 minutes for DNA polymerase activation, 40 cycles of 95°C for 2 s for denature, and 52°C for 30 s for anneal and extend. All samples were assayed in triplicate, and the none-template controls were prepared. The quantity of target and housekeeping genes ACTB, HPRT, and GAPDH were calculated according to a standard curve, and the expressions of DDIT3, HMOX1, GADD45B, and GPx3 were measured by Bio-Rad CFX Manager (Bio-Rad, USA). The expression levels of FKB-treated cells were compared with those of untreated controls. Table 1 illustrates the name of the gene, accession number, and sequence of primers used in this assay (http://pga.mgh.harvard.edu/primerbank/).
Table 1.
Gene Name, Accession Number, and Sequence of Primers Used in Real-Time PCR to Validate the Microarray Results.
| Gene Name | Accession Number | Sequence |
|---|---|---|
| HMOX1 | NM_002133.2 | F: 5-AAGACTGCGTTCCTGCTCAAC-3 R: 5-AAAGCCCTACAGCAACTGTCG-3 |
| DDIT3 | NM_001195057.1 | F: 5-GAACGGCTCAAGCAGGAAATC-3 R: 5-TTCACCATTCGGTCAATCAGAG-3 |
| GPX3 | NM_002084.3 | F: 5-AGAGCCGGGGACAAGAGAA-3 R: 5-ATTTGCCAGCATACTGCTTGA-3 |
| GADD45A | NM_001924.3 | F: 5-GAGAGCAGAAGACCGAAAGGA-3 R: 5-CAGTGATCGTGCGCTGACT-3 |
| CAT | NM_001752.3 | F:5-TGGGATCTCGTTGGAAATAACAC-3 R:5-TCAGGACGTAGGCTCCAGAAG-3 |
| ACTB | NM_001101.3 | F: 5-AGAGCTACGAGCTGCCTGAC-3 R: 5-AGCACTGTGTTGGCGTACAG-3 |
| GAPDH | NM_002046.4 | F: 5- GGATTTGGTCGTATTGGGC-3 R: 5- TGGAAGATGGTGATGGGATT-3 |
| 18S RRNA | HQ387008.1 | F: 5- GTAACCCGTTGAACCCCATT-3 R: 5- CCATCCAATCGGTAGTAGCG -3 |
Proteome Profiler Antibody Human Cell Stress Array
Differential expression of cell stress–related protein between untreated controls and HeLa cells treated with FKB for 48 hours were evaluated using proteome profiler antibody human cell stress array (R&D Systems, USA) according to the manufacturer’s protocol. Briefly, protein was extracted from harvested cells by lysis buffer, and concentration was standardized with Bradford assay and blocked on membranes with spotted antibodies at 4°C overnight. Then, the membranes were washed and incubated with biotinylated detection antibodies for 2 hours at room temperature followed by streptavidin–horseradish peroxidase/chemiluminescence substrate. The membranes were then scanned and imaged by ChemiDocx XRS+ (BioRad, USA) and Image Lab software (BioRad, USA).
Superoxide Dismutase (SOD) and Glutathione (GSH) Quantification
The extracted protein for control and FKB-treated HeLa cells that were standardized with Bradford assay was quantified for SOD and GSH contents. For SOD, 100 µL of extracted protein was mixed with 200 µL of working solution (0.1 mol/L phosphate buffer, 0.15 mg/mL sodium cyanide in 0.1 mol/L ethylenediaminetetraacetic acid, 1.5 mmol/L nitrobluetetrazolium and 0.12 mmol/L riboflavin). GSH was quantified using a GSH assay kit (Sigma, USA), where 10 µL of protein was added with 150 µL of working solution (1.5 mg/mL DTNB, 6 U/mL GSH reductase, and 1× assay buffer). After 5 minutes of incubation, 50 µL of NADPH solution (0.16 mg/mL) was added to the mixture. The absorbance for SOD and GSH were measured using ELISA plate reader (Bio-Tek Instruments, USA) at respective wavelengths of 560 and 420 nm.
Reactive H2O2 Cotreatment
Control and FKB (17.5 µM)-treated HeLa cells (48 hours of incubation) were further cultured in the presence of 125 µM H2O2 for 3 hours.11 After that, cell viability of these H2O2-challenged control and FKB-treated HeLa cells was quantified using the MTT assay. In addition, expression of CAT and HMOX mRNA was quantified using qRT-PCR. Levels of SOD, GSH, and ROS were quantified according to the above methods.
ROS Quantification
ROS levels of FKB-treated HeLa cells, untreated HeLa cells, H2O2-treated HeLa cells, and FKB + H2O2–treated HeLa cells were quantified using DCFDA-cellular reactive oxygen species (ROS) detection assay kit (Abcam, USA). In brief, after 48 hours of incubation, the control and FKB-treated cells in a 96-well plate were stained with 25 µM DCFDA for 45 minutes at 37°C. After that, all wells were washed, and the fluorescent signal was measured at excitation (Ex)/emission (Em) = 485/535 nm using Arzoskan Flash microplate fluorometer (Thermo Fisher Scientific, USA).
Statistical Analysis
All assays were tested with 3 biological replicates and expressed as mean ± SD. Results with statistical significance (P< .05) were assayed by Student’s t-test compared with untreated controls.
Results
FKB-Induced Cytotoxicity Against HeLa Cells
Cytotoxicity of FKB on HeLa cells was tested using the MTT assay. After 72 hours of incubation, the IC50 value of FKB on HeLa cells was 17.5 µM. This concentration has been used for the subsequent analysis to understand the response of HeLa cells post–FKB treatment.
FKB-Induced G2/M Phase Arrest and Apoptosis Through Loss of Membrane Potential
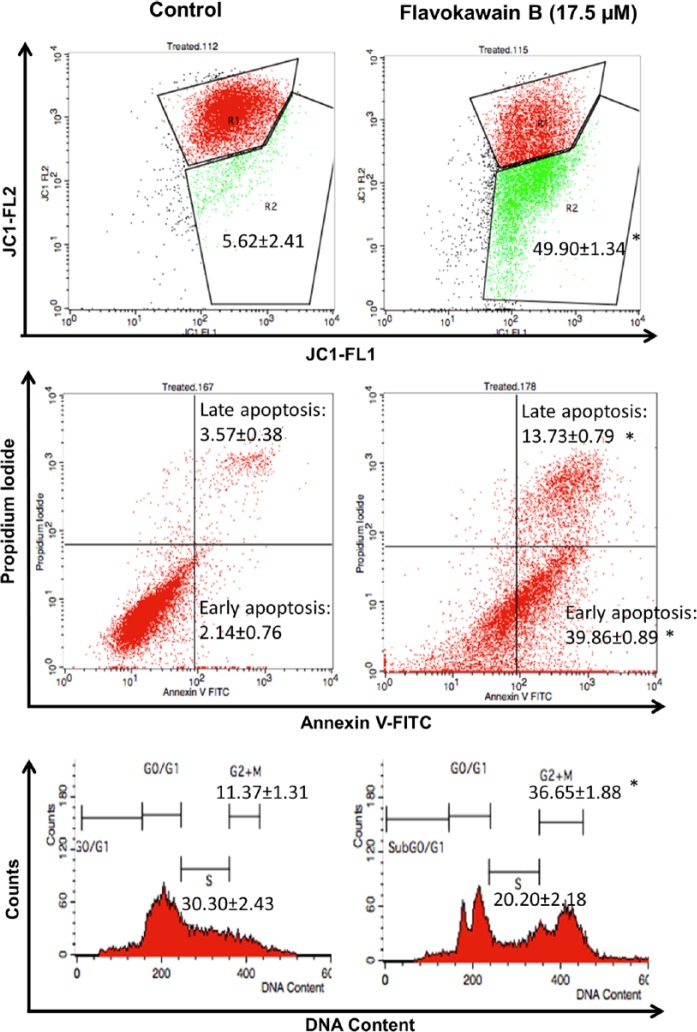
To elucidate the suppression of cell growth and mode of cell death induced by FKB on HeLa cells, flow cytometry cell cycle analysis, Annexin V-FITC/PI apoptosis assay, and JC-1 membrane potential quantification were carried out. HeLa cells were arrested by FKB at the G2/M phase, indicated by a 3-fold higher population of cells accumulated in the G2/M phase compared with untreated controls after 48 hours of treatment (Figure 1).
Figure 1.
A. Flow cytometry analysis of the JC-1 assay (mitochondrial membrane potential) in FKB-treated HeLa cells and untreated HeLa cells. R1:R2 represents the monomers to aggregates ratio. B. Flow cytometry analysis of Annexin V assay in FKB-treated HeLa cells and untreated HeLa cells. Upper left quadrant represents the percentage of late apoptosis cell population, and the lower left quadrant represents the early apoptosis cell population. C. Flow cytometry analysis of the cell cycle assay in FKB-treated HeLa cells and untreated HeLa cells. Data represent mean ± SEM for 3 sets of replicates. *P< .05.
Abbreviation: FKB, flavokawain-B.
On the other hand, FKB was found to induce cell death via apoptosis indicated by both Annexin V/PI and JC-1 flow cytometry assays. In terms of Annexin V/PI apoptosis assay, FKB-treated HeLa cells were recorded with ~39.86% and ~13.73% of cells undergoing early apoptosis and late apoptosis stages, respectively. In terms of the JC-1 assay, which measured the membrane potential of mitochondria, FKB treatment was found to induce loss of mitochondrial membrane potential in approximately 50% of treated HeLa cells.
FKB Differentially Regulated mRNA Expression of Cell Cycle, Apoptosis, Cell Stress, and MAPK Pathways
A microarray was used to evaluate the differentially regulated mRNA expression between control and FKB-treated HeLa cells. A total of 72 differential expression (>2.5-fold change in FKB-treated compared with untreated HeLa cells) genes related to apoptotic, cell cycle, Nrf2, and MAPK pathways were identified in this study. Tables 2 and 3 summarize the regulated genes promoting cell death and cell survival, respectively. Among the regulated genes promoting cell death, 32 were downregulated and 15 were upregulated. The majority of the upregulated genes were from cell cycle–related pathways (Table 2). On the other hand, 7 were downregulated, whereas 15 were upregulated in the genes that promote survival of the FKB-treated HeLa cells. Among the regulated genes promoting cell survival, the majority were related to antioxidant response.
Table 2.
Genes That Are Differentially Expressed (>2.5-fold, P< .05) and Involved in Promoting Cell Death in FKB-Treated HeLa Cells Compared With Untreated Controls.
| Gene Bank | Gene Symbol | Gene Name | Fold Change >2.5 |
|---|---|---|---|
| Proapoptosis | |||
| NM_002485 | NBN | nibrin | −3.44 |
| NM_002546 | TNFRSF11B | tumor necrosis factor receptor superfamily, member 11b | −3.01 |
| NM_001289072 | HELLS | helicase, lymphoid-specific | −2.58 |
| NM_182972 | IRF2 | interferon regulatory factor 2 | −2.52 |
| NM_004031 | IRF7 | interferon regulatory factor 7 | 2.54 |
| NM_005427 | TP73 | tumor protein p73 | 2.74 |
| NM_021127 | PMAIP1 | phorbol-12-myristate-13-acetate-induced protein 1 | 2.76 |
| NM_005658 | TRAF1 | TNF receptor-associated factor 1 | 3.09 |
| NM_148965 | TNFRSF25 | tumor necrosis factor receptor superfamily, member 25 | 3.20 |
| NM_003806 | HRK | harakiri, BCL2 interacting protein | 3.22 |
| NM_020396 | BCL2L10 | BCL2-like 10 (apoptosis facilitator) | 3.38 |
| NM_015675 | GADD45B | growth arrest and DNA-damage-inducible, beta | 4.06 |
| NM_006705 | GADD45G | growth arrest and DNA-damage-inducible, gamma | 30.80 |
| Cell cycle arrest | |||
| NM_153255 | MCM9 | minichromosome maintenance complex component 9 | −5.06 |
| NM_057749 | CCNE2 | cyclin E2 | −4.78 |
| NM_004091 | E2F2 | E2F transcription factor 2 | −4.33 |
| NM_001527 | HDAC2 | histone deacetylase 2 | −4.31 |
| NM_001166419 | HDAC8 | histone deacetylase 8 | −3.09 |
| NM_006044 | HDAC6 | histone deacetylase 6 | −2.75 |
| NM_182751 | MCM10 | minichromosome maintenance complex component 10 | −2.74 |
| NM_002800 | PSMB9 | proteasome (prosome, macropain) subunit, beta type, 9 | −2.68 |
| NM_006739 | MCM5 | minichromosome maintenance complex component 5 | −2.55 |
| NM_002915 | RFC3 | replication factor C (activator 1) 3, 38kDa | −2.55 |
| NM_022111 | CLSPN | claspin | −2.51 |
| NM_078467 | CDKN1A | cyclin-dependent kinase inhibitor 1A (p21, Cip1) | 4.43 |
| Pro-oxidation | |||
| NM_003039 | SLC2A5 | solute carrier family 2 (facilitated glucose/fructose transporter), member 5 | −17.32 |
| NM_018057 | SLC6A15 | solute carrier family 6 (neutral amino acid transporter), member 15 | −8.53 |
| NM_005233 | EPHA3 | EPH receptor A3 | −6.42 |
| NM_020342 | SLC39A10 | solute carrier family 39 (zinc transporter), member 10 | −3.81 |
| NM_173815 | CES4A | carboxylesterase 4A | −3.60 |
| NM_005573 | LMNB1 | lamin B1 | −3.56 |
| NM_004495 | NRG1 | neuregulin 1 | −3.47 |
| NM_001135147 | SLC39A8 | solute carrier family 39 (zinc transporter), member 8 | −3.03 |
| NM_001025195 | CES1 | carboxylesterase 1 | 2.91 |
| MAPK | |||
| NM_002758 | MAP2K6 | mitogen-activated protein kinase kinase 6 | −4.99 |
| NM_005739 | RASGRP1 | RAS guanyl releasing protein 1 (calcium and DAG-regulated) | −3.78 |
| NM_006609 | MAP3K2 | mitogen-activated protein kinase kinase kinase 2 | −3.09 |
| NM_002007 | FGF4 | fibroblast growth factor 4 | −2.96 |
| NM_003239 | TGFB3 | transforming growth factor, beta 3 | −2.72 |
| NM_002738 | PRKCB | protein kinase C, beta | −2.71 |
| NM_002397 | MEF2C | myocyte enhancer factor 2C | −2.67 |
| NM_005228 | EGFR | epidermal growth factor receptor | −2.57 |
| NM_005207 | CRKL | v-crk avian sarcoma virus CT10 oncogene homolog-like | −2.55 |
| NM_004417 | DUSP1 | dual specificity phosphatase 1 | 3.24 |
| NR_002834 | DUSP5 | dual specificity phosphatase 5 | 3.79 |
| NM_001963 | EGF | epidermal growth factor | 5.20 |
| NM_004083 | DDIT3 | DNA-damage-inducible transcript 3 | 10.81 |
Table 3.
Genes That Are Differentially Expressed (>2.5-fold, P< .05) and Involved in the Defence Mechanism for Cell Survival in FKB-Treated HeLa Cells Compared With Untreated Controls.
| Gene Bank | Gene Symbol | Gene Name | Fold Change >2.5 |
|---|---|---|---|
| Antiapoptosis | |||
| NM_001003940 | BMF | Bcl2 modifying factor | −6.31 |
| NM_003879 | CFLAR | CASP8 and FADD-like apoptosis regulator | −2.88 |
| NM_001164410 | CDK5 | cyclin-dependent kinase 5 | −2.52 |
| NM_022161 | BIRC7 | baculoviral IAP repeat containing 7 | 3.74 |
| Cell cycle progress | |||
| NM_145663 | DBF4 | DBF4 zinc finger | −4.03 |
| NM_033331 | CDC14B | cell division cycle 14B | −2.78 |
| Antioxidant | |||
| NM_001286789 | CBR1 | carbonyl reductase 1 | −3.62 |
| NM_001175 | ARHGDIB | Rho GDP dissociation inhibitor (GDI) beta | −2.89 |
| NM_001945 | HBEGF | heparin-binding EGF-like growth factor | 2.65 |
| NM_001074 | UGT2B7 | UDP glucuronosyltransferase 2 family, polypeptide B7 | 2.79 |
| NM_001144070 | ABCC3 | ATP-binding cassette, sub-family C (CFTR/MRP), member 3 | 2.86 |
| NM_001135195 | SLC39A5 | solute carrier family 39 (zinc transporter), member 5 | 2.95 |
| NM_001045 | SLC6A4 | solute carrier family 6 (neurotransmitter transporter), member 4 | 3.08 |
| NM_012212 | PTGR1 | prostaglandin reductase 1 | 3.26 |
| NR_046439 | MAFF | v-maf avian musculoaponeurotic fibrosarcoma oncogene homolog F | 3.80 |
| NM_000713 | BLVRB | Biliverdin reductase B (flavin reductase (NADPH)) | 4.22 |
| NM_001964 | EGR1 | early growth response 1 | 4.22 |
| NM_002084 | GPX3 | glutathione peroxidase 3 (plasma) | 4.44 |
| NM_002133 | HMOX1 | hemeoxygenase (decycling) 1 | 25.97 |
| MAPK | |||
| NM_002506 | NGF | nerve growth factor (beta polypeptide) | 2.67 |
| NM_005347 | HSPA5 | heat shock 70kDa protein 5 (glucose-regulated protein, 78kDa) | 2.71 |
| NM_002754 | MAPK13 | mitogen-activated protein kinase 13 | 3.78 |
Changes in gene expression detected in the microarrays (DDIT3 from the MAPK pathway, GPx3, HMOX1, CAT from the oxidative pathway, and DDIT3 from the apoptosis pathway) were validated using qRT-PCR. All these genes showed upregulation with similar fold change between microarray and qRT-PCR (Figure 2).
Figure 2.
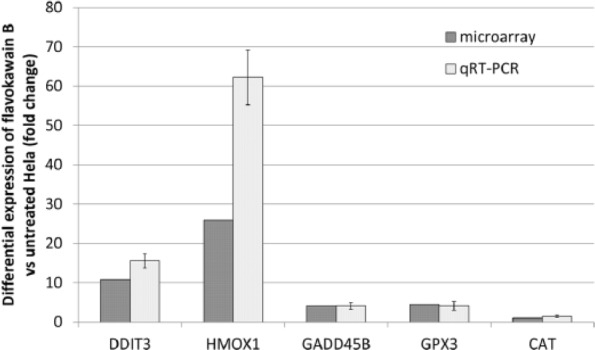
Validation of microarray results by RT-PCR for selected genes, HMOX-1, DDIT-3, GpX, Gadd45A, and CAT. The results represent the fold change of the genes in both microarray and RT-PCR. *P< .05.
Abbreviations: qRT-PCR, quantitative reverse transcriptase real-time polymerase chain reaction; HMOX1, hemeoxygenase (decycling)1; DDIT3, DNA-damage-inducible transcript 3; GPx3, glutathione peroxidase 3; GADD45B, growth arrest and DNA-damage-inducible beta; CAT, catalase.
FKB Differentially Regulated Protein Expression of the Cell Stress–Related Pathway
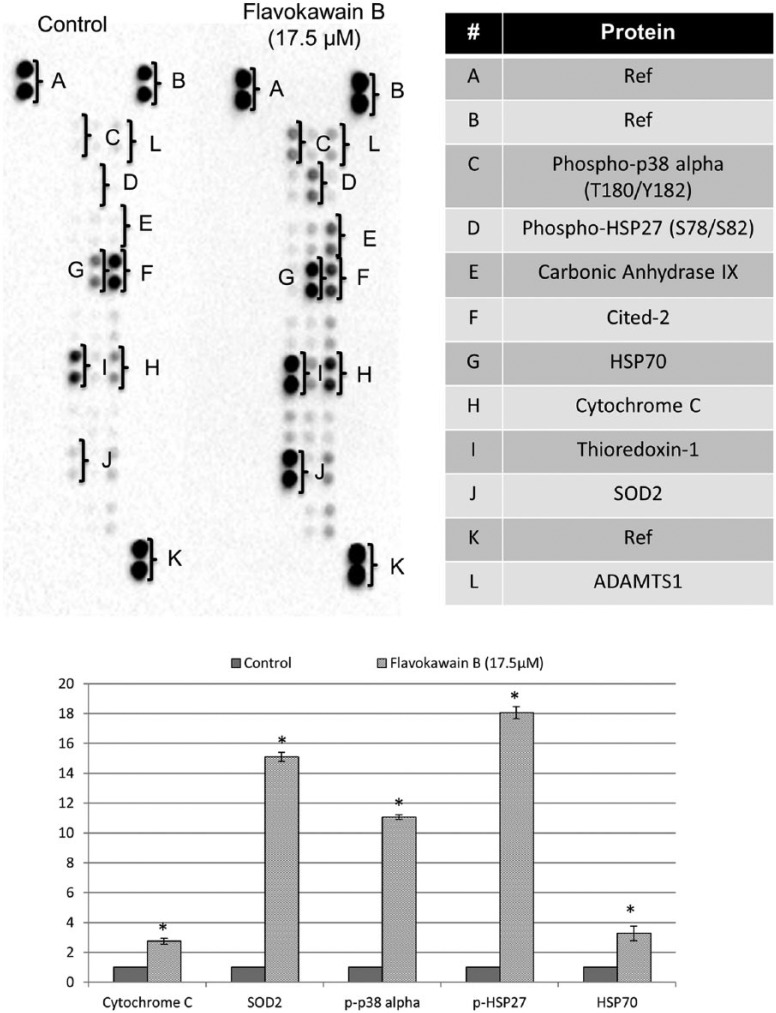
Because proapoptotic and antioxidant-related genes were observed in FKB-treated HeLa cells, differential protein expression of the cell stress–related pathway was validated using Human Cell Stress Proteome Profiler Antibody Array. Among the targets, cytochrome C, phospho-p38 alpha (T180/Y182), SOD2, phospho-HSP27 (S78/S82), and HSP70 were found to be significantly regulated (>2.5-fold change in FKB-treated compared with untreated HeLa cells; Figure 3).
Figure 3.
Comparison between the untreated and FKB-treated HeLa cells in proteome profiler analysis of cell stress proteins.
Abbreviations: FKB, flavokawain-B; SOD, superoxide dismutase.
FKB Enhanced the GSH and SOD Levels in Treated HeLa Cells
Cellular levels of GSH and SOD were compared between control and FKB-treated HeLa cells. The result showed that FKB-treated HeLa cells contained 1.24- and 3.20-fold higher expression of SOD and GSH, respectively, compared with untreated control cells (Figure 4).
Figure 4.
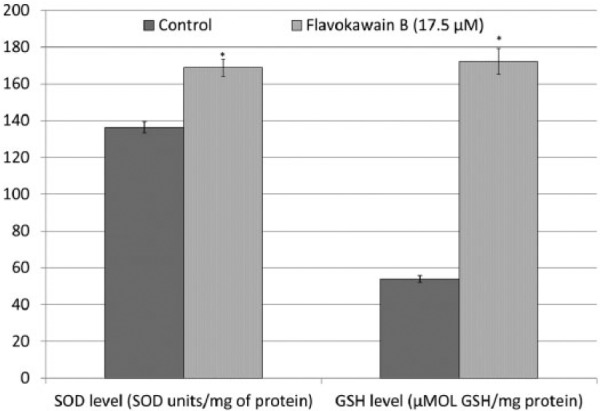
SOD and GSH levels in FKB-treated HeLa cells and untreated HeLa cells. Data represent mean ± SEM for 3 sets of replicates. *P< .05.
Abbreviations: SOD, superoxide dismutase; GSH, glutathione; FKB, flavokawain-B.
FKB Protects HeLa Cells From H2O2-Induced Cell Death
H2O2 reduced viability of HeLa cells after 3 hours of incubation. In contrast, FKB-pretreated HeLa cells were also observed with similar percentage of cell viability after incubating with H2O2 for 3 hours, which is higher than the viability of FKB-treated HeLa cells (~50% of viability; Figure 5).
Figure 5.
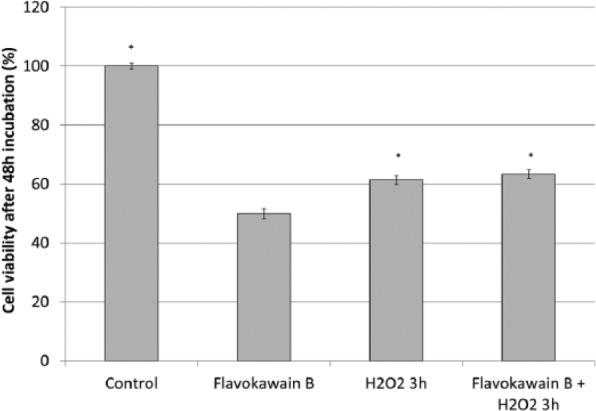
Viability of FKB-treated HeLa cells, untreated HeLa cells, H2O2-treated HeLa cells, and FKB + H2O2-treated HeLa cells. Data represent mean ± SEM for 3 sets of replicates. *P< .05.
Abbreviation: FKB, flavokawain-B.
To understand the contribution of antioxidant mechanisms in protecting FKB-treated HeLa cells from H2O2-induced cell death, mRNA expression of HMOX and CAT were quantified by qRT-PCR. HeLa cells treated with H2O2 were observed with downregulation of CAT gene and were unchanged for the expression of HMOX gene (Figure 6). On the other hand, FKB + H2O2–treated HeLa cells were observed with overexpression of HMOX and CAT genes. Both H2O2 only and FKB + H2O2–treated HeLa cells were recorded with lower SOD and GSH activities compared with FKB-treated HeLa cells. More interestingly, H2O2-treated HeLa cells had even lower SOD activity when compared with the FKB + H2O2–treated HeLa cells (Figure 7).
Figure 6.
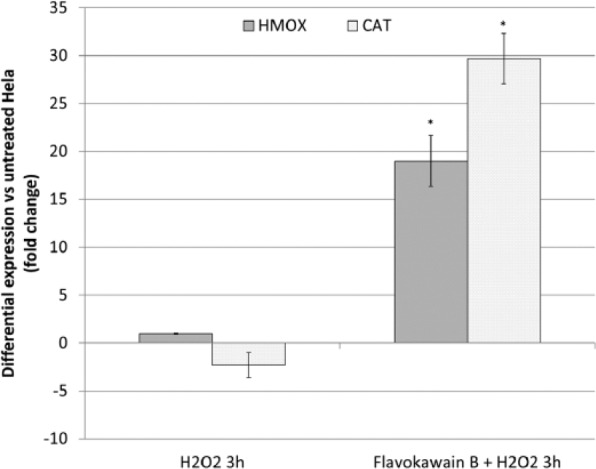
RT-PCR for selected genes, HMOX-1 and CAT of H2O2-treated HeLa cells (3 hours) and FKB + H2O2-treated HeLa cells. The results represent the fold change of the genes in both microarray and RT-PCR. *P< .05.
Abbreviations: RT-PCR, reverse transcriptase real-time polymerase chain reaction; HMOX1, hemeoxygenase (decycling)1; CAT, catalase; FKB, flavokawain-B.
Figure 7.
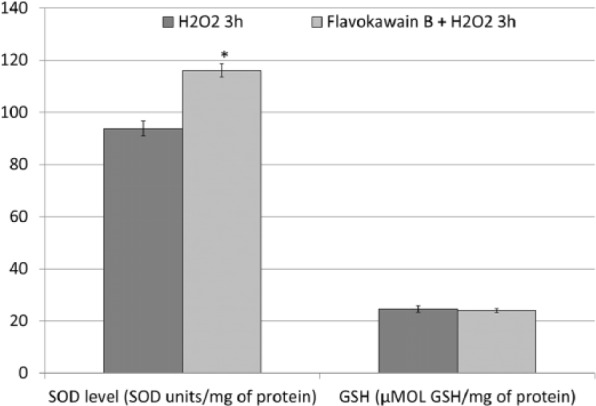
SOD and GSH levels in H2O2-treated HeLa cells (3 hours) and FKB + H2O2–treated HeLa cells. Data represent mean ± SEM for 3 sets of replicates. *P< .05.
Abbreviations: SOD, superoxide dismutase; GSH, glutathione; FKB, flavokawain-B.
Activation of Antioxidant by FKB Neutralizes H2O2-Induced ROS in HeLa Cells
Untreated HeLa cells were recorded with lower levels of ROS in comparison to FKB-treated HeLa cells. However, 3 hours of H2O2 treatment drastically raised ROS levels in the HeLa cells. On the other hand, FKB + H2O2 treatment was found to lead to a greater reduction in ROS levels (Figure 8).
Figure 8.
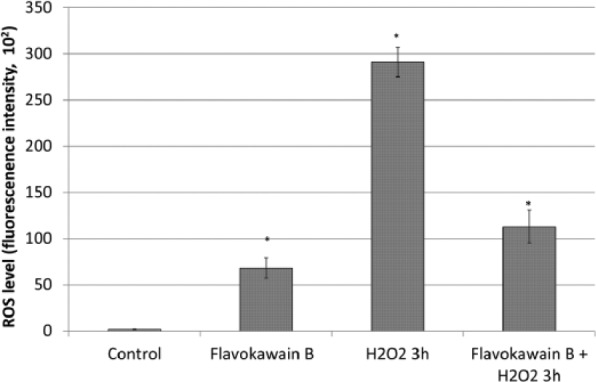
ROS levels in FKB-treated HeLa cells, untreated HeLa cells, H2O2-treated HeLa cells, and FKB + H2O2–treated HeLa cells. Data represent mean ± SEM for 3 sets of replicates. *P< .05.
Abbreviations: ROS, reactive oxygen species; FKB, flavokawain-B.
Discussion
Flavokawains, especially FKB, have been well documented to have great potential as anticancer agents. Among flavokawains A, B, and C, FKB was the most popular chalcone tested for its cytotoxicity on various cancer cell lines. Generally, FKB possessed greater cytotoxicity, with lower IC50 value against most of the tested cancerous cell lines compared with flavokawain A.5Similar to the effect on most of the other cancer cells, including osteosarcoma12 and oral carcinoma,13FKBwas found to induce apoptosis and G2/M cell cycle arrest in HeLa cells by flow cytometry analyses (Figure 1). Furthermore, FKB-treated HeLa cells were also recorded with loss of mitochondrial membrane potential. These results have suggested that FKBcan induce cell cycle arrest and apoptosis as well as possess the potential anticervical cancer effect similar to the effect on other types of cancer cells. However, Zhou et al8 reported that HepG2 liver cancer cells were more sensitive than HeLa cervical cancer cells in inducing oxidative stress–mediated cell death via regulation of the MAPK signaling pathway. A previous report has shown that unlike flavokawain A, FKBinduced cell cycle arrest and apoptosis in cancer cells regardless of p53 status. On the other hand, our study on breast cancer cell lines has further shown that FKBwas more sensitive to p53-mutated MDA-MB-231 than p53 wild-type MCF-7 cell lines via p38 MAPK and p53 pathways, respectively. However, because both HepG2 and HeLa cell lines are p53 wild-type cancerous cells,13 differential regulation resulting from the presence or absence of p53 protein may not be the major concern contributing to the selectivity of FKBto HepG2 and HeLa cell lines. In this study, the IC50 value of FKBin HeLa cells was ~17.5 µM, which is slightly higher than the IC50 value in HepG2 (15.3 µM) as reported by Zhou et al.8 To understand the detailed mechanism that contributed to the proapoptosis and defensive mechanisms of HeLa cells responding to the FKBtreatment, gene expression study using a microarray was carried out to identify the differentially regulated genes between control and FKB-treated HeLa cells.
In the microarray study, differentially expressed genes (>2.5-fold compared with the control HeLa cells) that are related to apoptosis, cell cycle regulation, Nrf2 oxidative stress, and MAPK are listed in Tables 2 and 3 based on proapoptotic and prosurvival regulation, indicating their roles in promoting or defending against cell death. As shown in the cell cycle analysis, FKB promoted G2/M arrest in HeLa cells, which was contributed by upregulation of p21 and downregulation of MCM9 and cyclin E2 (Table 2) without significant regulation of p53, which was similar to the effect on the osteosarcoma cell lines.12 Upregulation of p21 may be contributed by the induction of EGF and downregulation of EGFR in the FKB-treated HeLa cells. EGF was previously reported to induce p21-mediated cell cycle arrest and apoptosis in squamous carcinoma via reduction of cell adhesion.14 Besides G2/M cell cycle arrest, FKB was also found to positively regulate proapoptotic-related and p38-activated genes. For example, Gadd45a and Gadd45b were the 2 most highly upregulated genes that related to apoptosis. Upregulation of p21 was believed to activate the proapoptotic proteins Gadd45a and Gadd45b that subsequently activate p38 and induce apoptosis.15,16 This was observed in our protein array and flow cytometry JC-1 membrane potential analysis, where drastic upregulation of phosphor-p38 alpha (T180/Y182) and cytochrome c associated with loss of membrane potential were observed in FKB-treated HeLa cells. All these results clearly indicate that FKB induced p21-mediated G2/M arrest and induced apoptosis via activation of the p38 MAPK pathway.
Besides proapoptotic regulation, prosurvival defensive response, especially upregulation of the antioxidant response, was also observed in the FKB-treated HeLa cells. Zhou et al8 and Hseu et al13 have previously reported that induction of oxidative stress in cancer cells, especially liver and oral cancer cell lines, via upregulation of ROS to deplete the Nrf2 pathway after FKB treatment has been proposed as one of the important mechanisms to induce apoptosis in cancer. However, Zhou et al8 also reported that FKB was less effective in inducing apoptosis via depletion of reduced GSH in HeLa cells. Based on the microarray analysis, the overexpression of genes that regulate cellular antioxidants was much greater than that of the gene that promotes oxidative stress (11 vs 1). Among the antioxidant genes, HMOX1 and GPx3 were the 2 most highly upregulated genes. HMOX1 is the downstream gene under Nrf2 that works in iron sequestration, which degrades pro-oxidant heme into ferrous iron, carbon monoxide, and biliverdin. Overexpression of HMOX1 in cancer, especially under the stress condition induced by chemotherapeutic drug treatment, was thought to balance and neutralize the redox cellular environment and subsequently contributed to the cellular resistance against chemotherapy and radiotherapy.17 GPx3 is an antioxidant enzyme that scavenges H2O2 in the presence of GSH,18which was also found to be 3.2-fold higher in the FKB-treated HeLa cells. Besides, another antioxidant enzyme, SOD, especially SOD2 was also found to be significantly upregulated in the protein level. SOD2 plays an important role in reducing superoxide (O−•) to H2O2, which is further reduced to H2O by GPx in the presence of GSH as a cofactor.19 These results have given us the idea that GSH/GPx3, SOD, and HMOX1 collectively worked together as an antioxidant defensive mechanism to attenuate the oxidative stress induced by FKB treatment in the case of the cervical cancer cell line (Figure 9).
Figure 9.
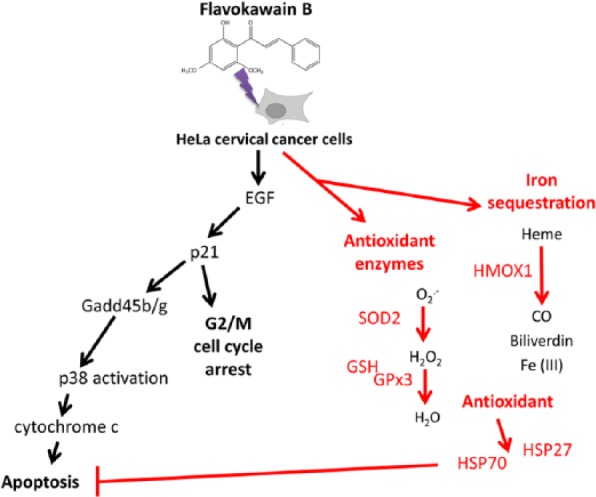
Overall mechanism of flavokawain B in HeLa cells derived from the performed assays.
Abbreviations: HMOX1, hemeoxygenase (decycling)1; SOD, superoxide dismutase; GSH, glutathione;GPx3, glutathione peroxidase 3.
Activation of the antioxidant mechanism in HeLa cells in FKB treatment was also recorded with activation of heat shock proteins (HSP)70 and phosphorylated HSP27. HSPs are molecular chaperones that are induced by environmental stress to maintain the cellular balance, including survival. HSPs can be separated into high- and low-molecular-weight types, such as HSP70 and HSP27, respectively. Overexpression of HSP70 and HSP27 were observed in various types of cancer, and this phenomenon was always associated with promotion of chemoresistance.20,21 Promotion of these HSPs by FKB in HeLa cells was not the same as the effect on oral cancer cells, which was associated with downregulation of HSP70.13
To confirm the activation of the antioxidant pathway by FKB in HeLa cells, untreated and FKB-treated HeLa cells were further incubated for 3 hours with H2O2. H2O2 has been previously reported to induce HeLa cell death via activation of mitochondria-dependent apoptosis by depleting cellular antioxidants and generation of ROS.11 Similar to the previous report, H2O2 reduced the viability, depleted the cellular antioxidant (suppression of CAT and HMOX mRNA expression and reduction of SOD and GSH activities), and drastically raised the ROS accumulation in HeLa cells. Conversely, FKB + H2O2–treated HeLa cells were observed with higher viability and lower ROS accumulation. This effect may be a result of the engagement of antioxidants, including HO-1, CAT, SOD, and GSH by FKB, which have been reported for cytoprotective roles against damage induced by oxidants such as H2O2.22
The structure of flavokawains—that is, electrophilic α,β-unsaturated carbonyl—has been proposed to contribute to both the promotion of the cancer cell antioxidant pathway via activating antioxidant transcription factor Nrf-2 gene and the upregulation of the HSP pathway, resulting in cancer cell survival.22 Thus, upregulation of these antioxidants and HSPs raises a concern of creating a resistant condition against all the other chemotherapeutic drugs that kill cervical cancer via generation of oxidative stress.
Conclusion
Chalcones, especially FKB, have been proposed as potential universal, natural anticancer agents. However, this study has raised the question of the suitability of using FKB in treating cervical cancer cells with HeLa cell lines as a model. Although FKB induced p21-mediated cell cycle arrest and activated p38, which promote apoptosis in HeLa cells, concurrent activation of antioxidant mechanisms followed by overexpression of ER-resident stress protein HSP70 and phosphorylation of HSP27 (Figure 5) may account for possible resistance toward this treatment.
Footnotes
Declaration of Conflicting Interests: The author(s) declared no potential conflicts of interest with respect to the research, authorship, and/or publication of this article.
Funding: The author(s) disclosed receipt of the following financial support for the research, authorship, and/or publication of this article: This research is supported by HIR-MoE Grant (reference number: UM.C/625/1/HIR/MOHE/CHAN/03; account number: A000003-50001) and University Malaysia Pahang grant no 150109 and 150349.
References
- 1. Bray F, Jemal A, Grey N, Ferlay J, Forman D. Global cancer transitions according to the Human Development Index (2008–2030): a population-based study. Lancet Oncol. 2012;13:790-801. [DOI] [PubMed] [Google Scholar]
- 2. Scatchard K, Forrest JL, Flubacher M, Cornes P, Williams C. Chemotherapy for metastatic and recurrent cervical cancer. Cochrane Database Syst Rev. 2012;(10):CD006469. [DOI] [PMC free article] [PubMed] [Google Scholar]
- 3. Rose PG, Bundy BN, Watkins EB, et al. Concurrent cisplatin-based radiotherapy and chemotherapy for locally advanced cervical cancer. N Engl J Med. 1999;340:1144-1153. [DOI] [PubMed] [Google Scholar]
- 4. Di Domenico F, Foppoli C, Coccia R, Perluigi M. Antioxidants in cervical cancer: chemopreventive and chemotherapeutic effects of polyphenols. Biochim Biophys Acta. 2012;1822:737-747. [DOI] [PubMed] [Google Scholar]
- 5. Abu N, Ho WY, Yeap SK, et al. The flavokawains: uprising medicinal chalcones. Cancer Cell Int. 2013;13:102. [DOI] [PMC free article] [PubMed] [Google Scholar]
- 6. Bazzaro M, Anchoori RK, Mudiam MKR, et al. α,β-Unsaturated carbonyl system of chalcone-based derivatives is responsible for broad inhibition of proteasomal activity and preferential killing of human papilloma virus (HPV)-positive cervical cancer cells. J Med Chem. 2011;54:449-456. [DOI] [PMC free article] [PubMed] [Google Scholar]
- 7. Issaenko OA, Amerik AY. Chalcone-based small-molecule inhibitors attenuate malignant phenotype via targeting deubiquitinating enzymes. Cell Cycle. 2012;11:1804-1817. [DOI] [PMC free article] [PubMed] [Google Scholar]
- 8. Zhou P, Gross S, Liu J-H, et al. Flavokawain B, the hepatotoxic constituent from kava root, induces GSH-sensitive oxidative stress through modulation of IKK/NF-κB and MAPK signaling pathways. FASEB J. 2010;24:4722-4732. [DOI] [PMC free article] [PubMed] [Google Scholar]
- 9. Mohamad AS, Akhtar MN, Khalivulla SI, et al. Possible participation of nitric oxide/cyclic guanosine monophosphate/protein kinase C/ATP-sensitive K+ channels pathway in the systemic antinociception of flavokawin B. Basic Clin Pharmacol Toxicol. 2011;108:400-405. [DOI] [PubMed] [Google Scholar]
- 10. Mosmann T. Rapid colorimetric assay for cellular growth and survival: application to proliferation and cytotoxicity assays. J Immunol Methods. 1983;65(1-2):55-63. [DOI] [PubMed] [Google Scholar]
- 11. Singh M, Sharma H, Singh N. Hydrogen peroxide induces apoptosis in HeLa cells through mitochondrial pathway. Mitochondrion. 2007;7:367-373. [DOI] [PubMed] [Google Scholar]
- 12. Ji T, Lin C, Krill LS, et al. Flavokawain B, a kava chalcone, inhibits growth of human osteosarcoma cells through G2/M cell cycle arrest and apoptosis. Mol Cancer. 2013;12:55. [DOI] [PMC free article] [PubMed] [Google Scholar]
- 13. Hseu Y-C, Lee M-S, Wu C-R, et al. The chalcone flavokawain B induces G2/M cell-cycle arrest and apoptosis in human oral carcinoma HSC-3 cells through the intracellular ROS generation and downregulation of the Akt/p38 MAPK signaling pathway. J Agric Food Chem. 2012;60:2385-2397. [DOI] [PubMed] [Google Scholar]
- 14. Cao L, Yao Y, Lee V, et al. Epidermal growth factor induces cell cycle arrest and apoptosis of squamous carcinoma cells through reduction of cell adhesion. J Cell Biochem. 2000;77:569-583. [PubMed] [Google Scholar]
- 15. Ijiri K, Zerbini LF, Peng H, et al. A novel role for GADD45β as a mediator of MMP-13 gene expression during chondrocyte terminal differentiation. J Biol Chem. 2005;280:38544-38555. [DOI] [PMC free article] [PubMed] [Google Scholar]
- 16. Cho HJ, Park S-M, Hwang EM, et al. Gadd45b mediates Fas-induced apoptosis by enhancing the interaction between p38 and retinoblastoma tumor suppressor. J Biol Chem. 2010;285:25500-25505. [DOI] [PMC free article] [PubMed] [Google Scholar]
- 17. Lau A, Villeneuve NF, Sun Z, Wong PK, Zhang DD. Dual roles of Nrf2 in cancer. Pharmacol Res. 2008;58:262-270. [DOI] [PMC free article] [PubMed] [Google Scholar]
- 18. Chung SS, Kim M, Youn B-S, et al. Glutathione peroxidase 3 mediates the antioxidant effect of peroxisome proliferator-activated receptor γ in human skeletal muscle cells. Mol Cell Biol. 2009;29:20-30. [DOI] [PMC free article] [PubMed] [Google Scholar]
- 19. Li X, Fang P, Mai J, Choi ET, Wang H, Yang X-f. Targeting mitochondrial reactive oxygen species as novel therapy for inflammatory diseases and cancers. J Hematol Oncol. 2013;6:19-19. [DOI] [PMC free article] [PubMed] [Google Scholar]
- 20. Yang X, Wang J, Zhou Y, Wang Y, Wang S, Zhang W. Hsp70 promotes chemoresistance by blocking Bax mitochondrial translocation in ovarian cancer cells. Cancer Lett.321:137-143. [DOI] [PubMed] [Google Scholar]
- 21. Chen S-F, Nieh S, Jao S-W, et al. Quercetin suppresses drug-resistant spheres via the p38 MAPK–Hsp27 apoptotic pathway in oral cancer cells. PLoS One. 2012;7:e49275. [DOI] [PMC free article] [PubMed] [Google Scholar]
- 22. Pinner KD, Wales CTK, Gristock RA, Vo HT, So N, Jacobs AT. Flavokawains A and B from kava (Piper methysticum) activate heat sock and antioxidant responses and protect against hydrogen peroxide-induced cell death in HepG2 hepatocytes. Pharm Biol. 2016; 54:1503-1512. [DOI] [PMC free article] [PubMed] [Google Scholar]


