

Abstract
Physical characterization of an ultrasound contrast agent (UCA) aids in its safe and effective use in diagnostic and therapeutic applications. The goal of this study was to investigate the impact of temperature on the size distribution, shell properties, and stability of Definity®, an FDA-approved UCA used for left ventricular opacification. A Coulter counter was modified to enable particle size measurements at physiological temperatures. The broadband acoustic attenuation spectrum and size distribution of Definity® were measured at room temperature (25 °C) and physiological temperature (37 °C), and were used to estimate the viscoelastic shell properties of the agent at both temperatures. Attenuation and size distribution was measured over time to assess the effect of temperature on the temporal stability of Definity®. The attenuation coefficient of Definity® at 37 °C was as much as 5 dB higher than the attenuation coefficient measured at 25 °C. However, the size distribution of Definity® at 25 °C and 37 °C were similar. The estimated shell stiffness and viscosity decreased from 1.76 ± 0.18 N/m and 0.21 × 10⁻⁶ ± 0.07 × 10⁻⁶ kg/s at 25 °C to 1.01 ± 0.07 N/m and 0.04 × 10⁻⁶ ± 0.04 × 10⁻⁶ kg/s at 37 °C, respectively. Size-dependent differences in dissolution rates were observed within the UCA population both at 25 °C and 37 °C. Additionally, cooling the diluted UCA suspension from 37 °C to 25 °C accelerated the dissolution rate. These results indicate that although temperature affects the shell properties of Definity® and can influence the stability of Definity®, the size distribution of this agent is not affected by a temperature increase from 25 to 37 °C.
Keywords: ultrasound contrast agents, acoustic attenuation spectroscopy, microbubbles, temperature, stability, phospholipids, Definity®
Introduction
Ultrasound contrast agents (UCAs) consist of microbubbles with a gas core encapsulated by a stabilizing shell (Cosgrove 2006). Phospholipid shelled UCAs such as Definity® (Lantheus Medical Imaging, North Bellerica, MA, USA) and SonoVue® (Bracco, Monroe Township, NJ, USA) are used clinically in the United States and Europe, respectively (Claudon et al. 2013). SonoVue has become recently available in the USA with the trade name Lumason® (Bracco, Monroe Township, NJ, USA) Ultrasound contrast agents are approved for left ventricular opacification (LVO) and contrast-enhanced imaging of focal liver lesions in the United States, and for imaging of LVO, liver, kidney, pancreas, brain, and abdomen in Europe and Asia (Claudon et al. 2013). Recent research on the diagnostic use of UCAs has been focused on functional imaging (Errico et al. 2015; Shelton et al. 2015), molecular imaging (Deshpande et al. 2010; Unnikrishnan and Klibanov 2012), and quantitative sensing (Dave et al. 2012; Nakatsuka et al. 2012). Furthermore, microbubble-mediated therapeutic applications such as sonothrombolysis (Bader et al. 2015; Lu et al. 2016; Shekhar et al. 2016a), blood-brain barrier opening (Hynynen et al. 2006; McDannold et al. 2008), and drug and gene-delivery (Bekeredjian et al. 2005; Kooiman et al. 2014) are under development.
The safe and effective application of UCAs in ultrasound imaging and therapy requires accurate characterization of the physical and acoustic behavior of UCAs (Mulvana et al. 2016). Previous studies have demonstrated that the acoustic response and stability of UCAs are influenced by the acoustic pressure (Shi et al. 1999; Yeh and Su 2008), fluid-viscosity (Helfield et al. 2016), ambient pressure (Forsberg et al. 2005; Kumar and Sarkar 2015), gas exchange (Kabalnov et al. 1998; Kanbar et al. 2017; Shekhar et al. 2014), size distribution (Gorce et al. 2000; Shekhar et al. 2013), temperature (Guiot et al. 2006; Mulvana et al. 2010), and shell properties (Borden et al. 2005; van Rooij et al. 2015).
A number of studies have evaluated the effect of temperature on the physical and acoustic response of UCAs. For example, UCA lipid shell structure (Borden et al. 2004), and size distribution (Helfield et al. 2012) can be affected by temperature during the bubble formation process. The ambient fluid temperature could also affect the stability of UCAs. Using optical microscopy and image analysis techniques, Mulvana and colleagues reported that SonoVue® was more stable at 20 °C than at 40 °C (Mulvana et al. 2010).
Vos et al. (2008) investigated ensembles of Definity® and SonoVue® UCAs using high-speed imaging at 21 °C and 37 °C. These investigators reported a decrease in threshold for microbubble activity, and stronger microbubble oscillations at 37 °C relative to 21 °C. Mulvana et al. (2011) performed high-speed imaging of SonoVue® exposed to ultrasound, and observed stronger radial excursion, shell fragmentation, and jet formation at body temperature than at room temperature. Meral et al. (2014) investigated the impact of temperature on the stable cavitation activity of a lipid-shelled UCA. Increasing the temperature from 25 °C to 40 °C was reported to increase subharmonic scattering relative to harmonic scattering by 10 dB.
Several studies have documented an increase in the acoustic attenuation of UCAs at physiological versus room temperature, both at conventional diagnostic and intravascular ultrasound frequencies (Meral 2014; Mulvana et al. 2010; Raymond et al. 2014; Sun et al. 2016). Our group has previously reported broadband (2 MHz – 25 MHz) attenuation measurements of phospholipid shelled UCAs such as Definity®, Micromarker® (Bracco, Geneva, Switzerland and VisualSonics, Toronto, Canada), and echogenic liposomes (Raymond et al. 2014). It was demonstrated that attenuation was higher at 37 °C than at 25 °C for each UCA, underscoring the importance of performing characterization studies at physiological temperature. However, this study did not focus on the impact of temperature on the size distribution of UCAs and the shell properties were computed using size distributions measured at 25 °C.
Despite the improved understanding of the effect of temperature on UCAs, the mechanism by which temperature affects the physical and acoustic behavior of ultrasound contrast agents has not been elucidated. The goal of the present study was to assess the impact of temperature on the size, shell properties, and stability of Definity®, which contains micron- and submicron-sized octafluoropropane bubbles (Goertz et al. 2007) within a phospholipid shell. The lack of suitable methods for population-scale size distribution measurements at physiological temperature make it challenging to assess the contribution of size distribution to the temperature-dependent change in acoustic behavior of UCAs. Electro-impedance sensing, which relies on the Coulter principle, is the most extensively used method for measuring the concentration and size distribution of UCAs (Sennoga et al. 2012). However, commercially available Coulter instruments are designed to measure size only at room temperature. Recently, a technique was reported to modify a Coulter for cell volume measurements over time at physiological temperatures (Bryan et al. 2012). In the present study, a Coulter counter was modified to enable particle and UCA size distribution measurements at elevated temperatures in the physiological range. Subsequently, the attenuation coefficient of Definity® was assessed at physiological and room temperatures, and the shell properties of the agent were computed at both temperatures. The impact of temperature on the temporal changes in the size distribution and attenuation spectrum of Definity® was also evaluated.
Materials and Methods
Agent handling and preparation
Definity® vials were stored at 3 °C prior to activation. Each vial was allowed to warm to room temperature before activation by agitating for 45 seconds using a Vial-Mix (Lantheus Medical Imaging) as per manufacturer’s instructions. Definity® particles were re-suspended by inverting the vial repeatedly for 10 seconds before withdrawing the agent. A 100-μL glass syringe (Model # 100F-LL-GT, SGE Analytical science, Austin, TX, USA) equipped with a 22-gauge needle was used to withdraw the agent from the middle of the vial. Another 22-gauge venting needle was connected to a tedlar gas-sampling bag (0.5 liter volume, EcnoGrab, Zefon International Inc. Ocala, FL USA) filled with octafluoropropane to replenish the withdrawn volume with octafluoropropane gas. This protocol ensured the stability of Definity® in the vial for several hours without measurable changes in size distribution and concentration (Raymond et al. 2014). Unless otherwise stated, all measurements were conducted within 6 hours of vial activation, which is within the 12-hour timeframe recommended by the manufacturer (Definity® [package insert]. N. Billerica, MA, USA: Lantheus Medical Imaging, Inc. 2013).
Modifying the Coulter Counter for temperature-controlled size distribution measurements
A Coulter counter (Multisizer 4, Beckman Coulter, Brea, CA, USA) was modified to enable measurements at 37 °C using a custom-made circulation system and a temperature feedback-enabled heating system (Figure 1). A 200-mL glass beaker was used as a sample holder for suspending diluted samples of Definity®. The 200-mL beaker was placed in a 3-D printed chamber designed using Autodesk TinkerCAD (Autodesk Inc., San Rafael, CA, USA) (stereolithography files attached as supplement). The 3-D printed chamber consisted of a 155 mm × 85 mm × 75 mm (length × width × height) container made with high-temperature polylactide with a wall thickness of 3 – 5 mm and was designed to fit seamlessly on the measuring stage of the Coulter counter. The chamber had water inlet and outlet ports that were connected to latex tubing (0.5″ diameter). A closed-loop water-jacketed flow system was employed to warm the 200-mL beaker in the 3-D printed chamber. The recirculating bath was filled with nonconductive reverse-osmosis water (NANOPure D4751, Barnstead International, Dubuque, IA, USA) to shield the instrument from catastrophic electrical noise as described previously (Bryan et al. 2012). Water circulation was maintained via an air-driven diaphragm pump (Model #166-200-46 BX, SHURflo, Costa Mesa, CA, USA) set at approximately one stroke per second. The outlet of the air pump was connected to a coiled copper tube (3 m) submerged in a temperature-controlled water bath (Isotemp 2100, Fisher Scientific, Hampton, NH, USA). A digital thermometer (Model #HH506, Omega, Stamford, CT, USA) equipped with a Type-T thermocouple was used to monitor temperature in the sample chamber during the size distribution measurement. To avoid thermal and electrical conductivity gradients throughout the aperture-sensing zone, both the electrolyte chamber and the sample beaker were filled with phosphate buffered saline (PBS, 0.01 M; Sigma Chemical, St. Louis, MO, USA) and maintained at the same temperature. The electrolyte chamber of the Coulter counter was heated using temperature-controlled laboratory heating tape (24″ length, Model #BIH051020L, BriskHeat, Columbus, OH, USA) operated at 8.3 watts per square inch. The electrolyte chamber was placed on a magnetic stir plate (Model #215, Arthur Thomas Co. Philadelphia, PA, USA) and stirred continuously to maintain uniform temperature in the electrolyte chamber. A benchtop proportional-integral-derivative (PID) controller (BriskHeat #X2-120KT, Columbus, OH, USA) equipped with a Type-K thermocouple was employed to maintain the temperature of PBS in the electrolyte chamber within ± 0.2 °C of the temperature in the sample chamber. The accessory stirrer provided with the Coulter counter was used to maintain a homogeneous sample suspension in the 200-mL beaker. In order to verify the accuracy of the technique at 37 °C, the Coulter counter was also used to measure the size distribution and concentration of a mixture of standard latex sizing beads of 2-μm and 5-μm diameter (Coulter CC Size standard L2 and L5, Beckman Coulter, Brea, CA, USA) at 25 °C and 37 °C (Figure 2(a)). Preliminary calibration experiments showed that these latex beads do not change size by more than 0.6% for a change in temperature from 25 °C to 37 °C (data not shown).
Figure 1.
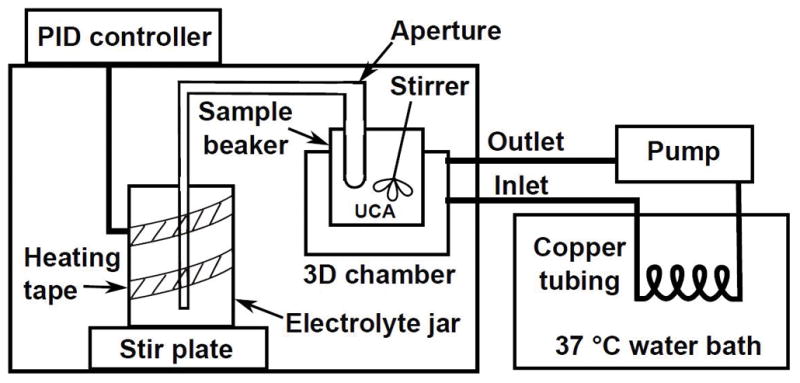
Schematic of the apparatus used for performing size distribution measurements of Definity® at room (25 °C) and physiological (37 °C) temperatures. PID = proportional integral derivative, UCA = ultrasound contrast agent.
Figure 2.

(a) The volume-weighted size distribution of a mixture of 2-μm and 5-μm standard latex beads measured at 25 °C and 37 °C. (b) The attenuation spectrum of Definity® at 25 °C measured as the peak negative pressure was increased from 30 kPa to 250 kPa. (c) The narrowband (circles) and broadband (solid line) attenuation spectrum of Definity® measured at 37 °C.
Size distribution measurements of Definity® at 25 °C and 37 °C
The size distribution of Definity® was measured using the Coulter counter equipped with a 30-μm aperture. For each measurement, Definity® was diluted serially (1:10000) in 200-ml air-saturated PBS (0.01 M) in the sample beaker. First, a 1:10 stock solution of Definity® was prepared by adding 50 μL of Definity® into 450 μL of PBS at room temperature. Subsequently, 150 μL of this stock solution was added to 150 ml of PBS maintained at either 25 °C or 37 °C. During each trial, 100 μL of the diluted sample was measured over 30 s. Number density histograms with 200 linearly spaced bins between 0.6 μm – 18 μm were multiplied by a factor of 5 to provide a consistent comparison with the dilution used for attenuation measurements described in the next section. The number-weighted histograms were transformed into volume-weighted distributions for further analysis and interpretation. The results from at least three measurements, each from a fresh withdrawal of microbubbles from the activated Definity® vial, were averaged. The mean and standard deviation of both the number-weighted and volume-weighted size distributions were reported.
Broadband acoustic attenuation measurements at 25 °C and 37 °C
The frequency-dependent attenuation coefficient was measured using through-transmission attenuation spectroscopy at 25 ± 0.5 °C and 37 ± 0.5°C, as described previously (Raymond et al. 2014). For measurements at both temperatures, a 1:10 diluted stock solution of Definity® was diluted further to 1:2000 (v/v) in air-saturated (100 ± 1% oxygen saturation) PBS containing 0.5% (w/v) bovine serum albumin (BSA) maintained at either 25 °C or 37 °C. A dissolved oxygen meter (Model DO6+, Oakton Instruments, Vernon Hills, IL, USA) was used to measure the oxygen saturation of BSA solutions. The attenuation spectrum of Definity® in PBS with 0.5% BSA solution closely mimics the attenuation spectrum of Definity® in whole blood (Raymond et al. 2014). The sample was suspended in a rectangular chamber that had acoustically transparent polycarbonate film windows (CLINIcell 25, Mabio, Tourcoing, France). The reservoir, sample chamber, and transducers were mounted in an acrylic tank filled with deionized water maintained at constant temperature using a circulating water bath (Neslab EX, Newington, NH, USA). Two broadband transducers (PI-20, Olympus NDT, Waltham, MA, USA) were used to measure the attenuation spectrum. The center frequency of the pulse used for attenuation measurements was 15.7 MHz and its full-width half maximum bandwidth was 21 MHz (3.3 MHz – 24.3 MHz). Attenuation measurements were performed over the frequency range of 2 – 25 MHz, which encompasses the frequency range used in diagnostic ultrasound and the lower frequencies used in intravascular ultrasound. Preliminary experiments were performed with Definity® to compare the attenuation spectra over a range of output pressures (30 – 250 kPa), and to compare narrowband and broadband attenuation measurements over a range of frequencies (2 – 25 MHz) (Figure 2(b) and (c)). Shown in figure 2(b) are attenuation spectra measured with a broadband pulse from 30 to 250 kPa using Definity® at a dilution of 1:2000. In figure 2(c), a narrowband excitation (30-cycle cosine-windowed tone burst with a peak negative pressure of 30 kPa (± 12% uncertainty) was swept over 2 – 25 MHz for narrowband attenuation measurements. Definity® was diluted to 1:2000 for these measurements. Note that figure 2(c) was obtained using a vial of Definity® that was past the recommended 12 hours use period subsequent to reconstitution. A new vial of Definity® was not expended as our goal was only to compare broadband and narrowband attenuation measurements. Based on the outcome of these experiments, all subsequent experiments were performed using broadband attenuation spectroscopy, and a peak negative pressure of 30 kPa was employed to avoid pressure-dependent attenuation effects (Chatterjee et al. 2005; Xia et al. 2015).
Estimation of viscoelastic shell properties of Definity® at 25 °C and 37 °C
The viscoelastic shell properties of Definity® were estimated using a linearized acoustic model reported by de Jong and colleagues (de Jong et al. 1992). In this model, the UCA shell is characterized by ad hoc parameters for shell elasticity (SP) and friction (SF). In the linear regime, the parameters are equivalent (Sp = 2X and SF = 16πXS) to those used in the Marmottant model (Marmottant et al. 2005). Assuming linear scattering, and ignoring multiple scattering for dilute suspensions, the viscoelastic shell parameters were computed by minimizing the sum-squared difference in errors between the measured and estimated attenuation coefficients (Raymond et al. 2014). The measured values of sound speed, density, and the dynamic viscosity of the fluid reported by previously (Raymond et al. 2014) were used in these calculations. The coefficient of determination (R2) was calculated to indicate the goodness of fit between the measured and estimated attenuation coefficients. The values of the shell parameters that produced a doubling of the error functional were selected as the limits for the 95% confidence interval (Hoff 2001).
Stability of Definity® at 25 °C and 37 °C
To test the stability of Definity®, the attenuation coefficient was measured at both temperatures for over 60 minutes at 10-min intervals. A magnetic stir bar (~5 mm length) was placed inside the sample chamber to keep the UCA in suspension throughout the measurement. The stir bar was magnetically coupled using a neodymium rare earth disc magnet (0.38″ OD, 0.25″ ID, 0.06″ thick, K&J Magnetics, Pipersville, PA, USA) connected to the end of a 3/8″ poly vinyl chloride rod and rotated using a DC motor (9 – 18V model #273-256; Radio Shack, Fort Worth, TX, USA). The disc magnet kept the stir bar suspended and rotating smoothly (~200 – 600 rpm) in the sample chamber. The location of the disc magnet was adjusted relative to the acoustic field such that its presence did not influence the attenuation measurements. Stirring was turned on before the first acquisition and remained on for the duration of the measurements. Although measurements were performed at 10-minute intervals, results are displayed at 20-minute intervals in some cases for visual clarity.
Effect of temperature transition on stability
The stability of Definity® in response to a rapid change in temperature was assessed for two conditions by measuring attenuation over a 60-minute period. For the first test, Definity® was diluted in PBS with 0.5% BSA (1:2000) held at 25 °C and subsequently introduced into the attenuation measurement system maintained at 37 °C. For the second test, Definity® was diluted in PBS (1:2000) with 0.5% BSA held at 37 °C and then introduced into the attenuation measurement system maintained at 25 °C. Both protocols caused a 12 °C change in temperature of the diluent within 100 seconds. The attenuation spectrum was measured at 10-minute intervals over 60 minutes for both protocols.
Phase transition of lipids in the shell of Definity®
A sharp change in acoustic response is indicative of the phase transition of phospholipids in the shell of UCA from gel to liquid crystalline state (Guiot 2006). To test the phase transition temperature of the lipids in Definity®, attenuation measurements were performed as a function of temperature. For these tests, Definity® was diluted in PBS with 0.5% BSA (1:2000) held at either 39 °C, 41 °C, and 43 °C and the attenuation measurement was performed.
Results
Temperature-dependent differences in attenuation and size distribution
The attenuation coefficients of Definity® measured with different acoustic pressures are shown in Figure 2(b). The attenuation spectra differed by less than 5% when the pressure was less than 250 kPa. A comparison between the narrowband and broadband attenuation spectrum of Definity® measured at 37 °C is shown is Figure 2(c). It can be observed that the narrowband and broadband attenuation spectra are similar.
The attenuation coefficients of Definity® measured at 25 °C and 37 °C are shown in Figure 3. The attenuation coefficient of Definity® at 37 °C was as much as 5 dB higher than at 25 °C. The highest difference in attenuation was observed at 10 MHz, the resonance frequency of Definity® (Faez et al. 2011; Goertz et al. 2007; Raymond et al. 2014). The attenuation coefficients measured at 25 °C and 37 °C had non-overlapping error bars for frequencies between 5.5 MHz – 13.5 MHz. An unpaired t-test revealed that the differences in the mean attenuation of Definity® at 37 °C (13.1 ±1.1 dB/cm) and 25 °C (11.1 ± 0.8 dB/cm) were statistically significant (p = 0.023).
Figure 3.

The frequency-dependent attenuation coefficient of Definity® measured at 25 °C, and 37 °C. The error bars represent the mean ± 1 S.D. (n = 4).
Figure 4 shows the (a) number-weighted, and (b) volume-weighted size distributions of Definity® at 25 °C and 37 °C. The size distribution and concentration of the agent at room temperature and physiological temperature were within one standard deviation of each other. The size distributions were also plotted as a number percentage, normalized to the total number of particles measured (Figure 4(c)) and volume percentage, normalized to the total volume of particles measured (Figure 4(d)). No evidence of temperature-mediated increase in size was observed.
Figure 4.

The number-weighted (a) and volume-weighted (b) size-distributions of Definity® measured at 25 °C and 37 °C. The number-weighted (c) and volume-weighted (c) size-distributions of Definity® reported as percentages. The error bars represent the mean ± 1 S.D. (n = 4).
Impact of temperature on shell properties
Figure 5 illustrates the model fit to measured attenuation coefficients at room temperature and physiological temperature. Excellent agreement was observed between the model and the measured attenuation coefficient (R2 ≥ 0.9). The “best fit” shell parameters obtained from the model are reported in Table 1 along with estimates from previous studies (Faez et al. 2011; Goertz et al. 2007; Raymond et al. 2014). The shell stiffness, SP, and shell friction, SF, decreased as the temperature was increased from 25 °C to 37 °C.
Figure 5.

The measured (solid line) attenuation coefficient as a function of frequency, and the theoretical fit (dashed line) to the de Jong model (de Jong et al. 1992) based on the estimated shell parameters of Definity® at (a) 25 °C, and (b) 37 °C. The error bars represent the mean ± 1 S.D. (n = 4), and the dotted lines represent the 95% confidence interval of the fit.
Table 1.
The mean ± 95% confidence interval of the viscoelastic shell properties of Definity® at room temperature and physiological temperature obtained using the de Jong model (de Jong et al. 1992). The shell properties reported for Definity® at room temperature by other investigators (Faez et al. 2011; Goertz et al. 2007; Raymond et al. 2014) are listed for comparison along with the temperature and frequency-range used in the measurement.
| Temperature | Frequency range (MHz) | Sp (N/m) | Sf × 106 (kg/s) |
|---|---|---|---|
|
| |||
| Room temperature | |||
| Present study | 2 – 25 | 1.76 ± 0.18 | 0.21 ± 0.07 |
|
| |||
| Goertz et al. (2007) | 2 – 50 | 1.71 ± 0.24 | 0.015 ± 0.015 |
| Faez et al. (2011) | 5 – 15 | 1.64 ± 0.33 | 0.15 ± 0.02 |
| Raymond et al. (2014) | 2 – 25 | 1.76 ± 0.16 | 0.47 ± 0.05 |
|
| |||
| Physiological temperature | |||
|
| |||
| Present study | 2 – 25 | 1.01 ± .07 | 0.04 ± 0.04 |
Effect of temperature on stability
Figure 6 shows the attenuation spectrum of Definity® measured over 60 minutes at (a) 25 °C and (b) 37 °C. The attenuation coefficient gradually decreased over the duration of the measurements. The decrease in the attenuation in the 2 MHz - 4 MHz range was similar at both temperatures. However, a more rapid decrease in attenuation at high frequencies (20 MHz – 25 MHz) was apparent at 37 °C. The average rate of decrease in the attenuation coefficient was higher at 37 °C than at 25 °C, as evidenced by the greater magnitude of the slope of the regression line in Figure 6(c).
Figure 6.

The attenuation spectrum of Definity® measured versus time to assess its stability at (a) 25 °C and (b) 37 °C. (c) The normalized mean attenuation coefficient of Definity® measured versus time at 25 °C and 37 °C. The error bars represent the mean ± 1 S.D. (n = 3).
The number-weighted size distributions of Definity® measured over 60 minutes at room temperature and physiological temperature are shown in Figure 7(a) and (b), respectively. The number-weighted size distribution of Definity® gradually decreased over the measurement period. At 37 °C the number-weighted size distribution decreased substantially for submicrometer bubbles. For example, the concentration of microbubbles in the 0.65 μm bin decreased by 76% at 37 °C, yet only by 49% at 25 °C over 60 minutes. This outcome is consistent with data presented in Figure 6, where the highest decrease in attenuation at 37 °C occurred in the 15 MHz – 25 MHz range. The volume-weighted size distributions of Definity® measured over time at 25 °C and 37 °C shown in Figure 7(c) and (d) gradually decreased over the measurement period.
Figure 7.
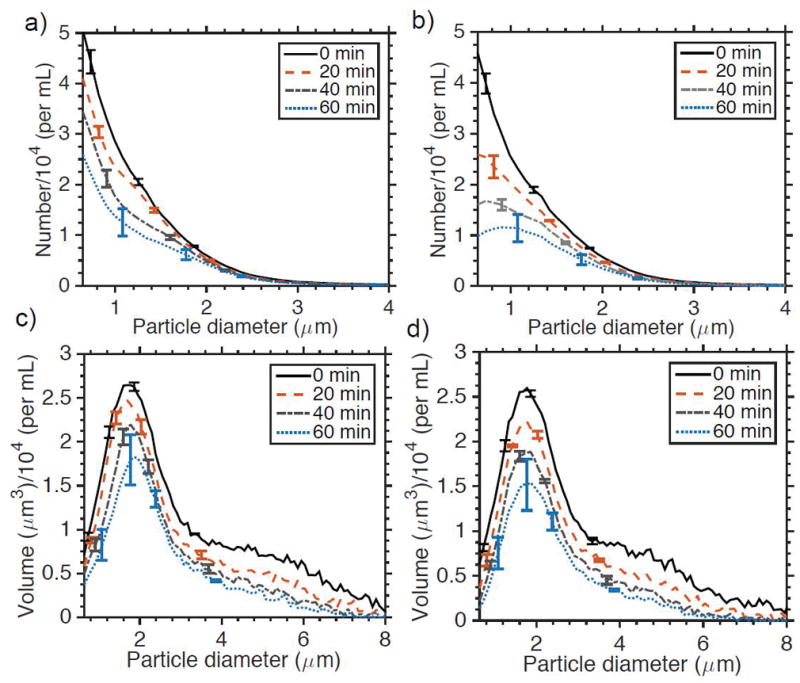
The number-weighted size distribution of Definity® measured versus time at (a) 25 °C and (b) 37 °C. The volume-weighted size distribution of Definity® measured versus time at (c) 25 °C and (d) 37 °C. The error bars represent the mean ± 1 S.D. (n = 3).
Figure 8(a) shows the temporal variation in the attenuation spectrum of Definity® that was diluted at 25 °C and rapidly exposed to a 37 °C environment within the measurement tank. The rate of dissolution of Definity® under this condition did not differ appreciably from the measurements reported in Figure 6, suggesting that the microbubble shell is robust for increases in temperature from room temperature to body temperature. On the other hand, when Definity® was diluted at 37 °C and exposed to an ambient temperature of 25 °C, the rate of dissolution of microbubbles increased sharply (Figure 8(b)). The normalized mean attenuation of Definity® versus time shown in Figure 8c decreased at a 2.5-fold rate for diluted samples of Definity® cooled from 37 °C to 25 °C rather than heated from 25 °C to 37 °C.
Figure 8.

The effect of change in temperature from (a) 25 °C to 37 °C, and from (b) 37 °C to 25 °C on the attenuation spectrum of Definity® measured over 60 minutes, (c) The mean attenuation coefficient of Definity® warmed from 25 °C to 37 °C, and cooled from 37 °C to 25°C versus time (n = 3).
Figure 9 shows the attenuation spectrum of Definity® as the temperature was increased progressively from 39 °C to 43 °C. The attenuation dropped sharply as the temperature was increased from 41 °C to 43 °C. This outcome suggests that the phase transition temperature of lipids in Definity® lies between 41 °C to 43 °C.
Figure 9.
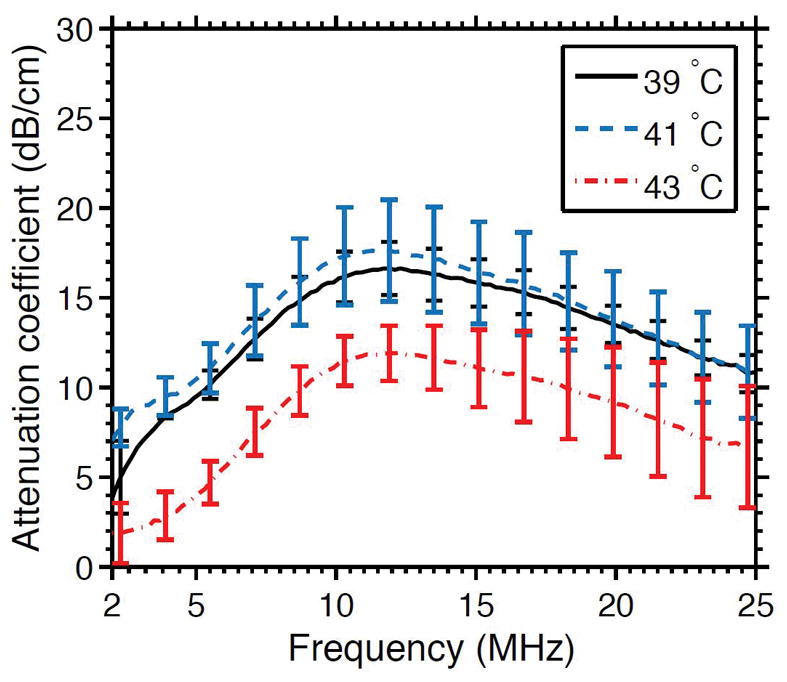
The attenuation spectrum of Definity® as a function of temperature from 39 °C to 43 °C (n = 3).
Discussion
Size distribution of Definity® at elevated temperatures
Size distribution is a primary determinant of the physical and acoustic properties of UCAs (Gorce et al. 2000). However, only a limited number of studies have reported the size distribution and concentration of a UCA at physiological temperatures, partly due to the lack of reliable and rapid assessment methods. The size distribution of SonoVue® was reported previously using dynamic light scattering (DLS) at 37 °C (Yang et al.) and for a range (37°C – 43 °C) of elevated temperatures (Guiot et al. 2004). Mulvana et al. (2010) employed optical microscopy combined with image analysis, to assess the size distribution and concentration of SonoVue® at 40 °C (Mulvana et al. 2010). However, DLS and optical microscopy techniques have several notable limitations for quantitative characterization of UCAs. Measurements with DLS are performed under the assumption that the particles being analyzed have identical optical properties, which may lead to large errors when measuring polydisperse UCAs (Satinover et al. 2014; Sennoga et al. 2012) Additionally, measurements with DLS cannot assess UCA concentration. Optical microscopy and image analysis for quantifying the concentration and size distribution of UCAs is tedious, and it is difficult to achieve population scale measurements without analyzing several thousand microbubbles (Mulvana et al. 2016). Furthermore, measurements could be confounded by microbubbles that are either not stationary or out of focus (Harfield et al. 2016). Coulter counters, which are based on electro-impedance sensing, are the most widely used instruments for characterizing UCAs (Sennoga et al. 2012). In the present study, size distribution and concentration measurements of UCAs were performed at elevated temperatures using a modified Coulter counter.
The results reported in this paper showed that the size distribution and concentration of Definity® at 25 °C and 37 °C are similar (Figure 4). This result is consistent with predictions from the ideal gas law using the Laplace pressure relation (Leighton 1994; Mulvana et al. 2010) for micrometer sized free bubbles, which predicts a negligible increase in size for a 12 °C increase in temperature. Mulvana et al. (2010) reported a significant temperature-mediated increase in the size distribution of SonoVue® at 40 °C relative to 20 °C, which is different from the trend reported in this paper. This apparent discrepancy may be explained by noting that the UCAs used in these studies are different, and the sizes were compared over different ranges (20 °C – 40 °C vs. 25 °C – 37 °C in the present study). Moreover, evidence from previous studies (Guiot et al. 2006) suggests that the size of SonoVue® microbubbles at 40 °C could be greater than their size at 37 °C. Specifically, Guiot et al. (2010) observed a dramatic increase in the mean diameter of SonoVue® when the temperature was increased from 39 °C to 40 °C. Further, when the temperature was increased to 41 °C, a sharp decrease in the backscattered intensity of ultrasound was observed, suggesting that the threshold temperature for the phase transition of lipids in the shell of SonoVue® had been exceeded.
Attenuation spectrum of Definity®
The resonance frequency of Definity® was nearly 10 MHz in our study, which is consistent with previous literature (Goertz et al. 2007). A limitation of broadband attenuation measurements is that different frequencies that comprise the pulse have different acoustic pressures. However, we did not observe appreciable differences in the measured spectra for pressures up to 250 kPa (Fig. 2.b). The data reported here were acquired with a pressure of 30 kPa, which is significantly below 250kPa. This outcome was consistent with a previous study (Chatterjee et al. 2005) with Definity®, which reported that attenuation measurements performed with pressures lower than 260 kPa yielded similar results. Nonetheless, it is important to note that the effect of pressure on attenuation curves may not be the same for all UCA. For example, Xia et al. (2015) performed attenuation measurements with monodisperse UCA and found differences in attenuation curves obtained with pressures ranging from 4 kPa to 110 kPa. They concluded that these differences were caused by a constitutive nonlinearity due to the effect of stain-softening, and not nonlinear propagation. When the effect of pressure was incorporated into the rheological model, the attenuation measurements yielded identical shell properties despite the differences in the attenuation curves.
Impact of temperature on viscoelastic shell properties
The attenuation curves and shell stiffness reported in this study are in general agreement with previous studies performed at room temperature (Table 1). The shell friction reported in previous studies (Faez et al. 2011; Goertz et al. 2007; Raymond et al. 2014) varies by an order of magnitude, likely due to differences in the size distribution and frequency range of the measurement (van der meer et al. 2007; Helfield and Goertz 2013). Along with differences in handling of the Definity®, the particular instrumentation and aperture used could influence the measured size distribution. Some differences were observed in the size distribution reported in the present paper and our previous work (Raymond et al. 2014), even though the same instrumentation was used. Specifically, no secondary peak was observed in the volume-weighted size distribution, which may have contributed to the two-fold difference in shell viscosity between the present study and the previous work at room temperature. This difference in size distribution was likely caused by batch-to-batch variability of Definity® vials.
It has been suggested previously that the viscoelastic shell properties and diffusivity of the UCA lipid shell can change below, at, or above the transition temperature (Zook and Vreeland 2010). It has also been proposed that the thinning of lipid due to temperature-mediated expansion of UCAs might reduce the shell elastic modulus, no growth in the size distribution of UCAs was observed in this study, but a significant change in viscoelastic shell properties was observed (Table 1). Therefore structural alteration of the lipid, rather than thinning due to expansion, appears to be the primary mechanism that explains the reduction in shell stiffness and shell friction of Definity® at 37 °C relative to 25 °C. A reduction in shell stiffness and shell friction could explain the lower thresholds observed for stable cavitation and the onset of microbubble vibration reported by Vos et al. (2008), as well as the higher amplitude microbubble oscillations at 37 °C than 25 °C observed by Mulvana et al. (2011). The temperature-dependent increase in the attenuation of Definity® was most pronounced at resonance (Figure 3). When the damping of the resonant system is reduced, the quality factor of the system increases, which sharpens the resonant peak (Leighton 2012). In this study, we observed a nearly five-fold reduction in the shell viscosity of Definity® at 37 °C relative to 25 °C. Therefore it is not surprising that the most pronounced differences in attenuation spectra measured at 25 °C and 37 °C was observed at the resonant frequency. As these experiments were conducted using a bulk suspension of Definity®, the peak in the attenuation spectra represents the weighted-average of the entire microbubble population. It is likely that temperature affects the resonance of individual microbubbles of all sizes. However, the effect was pronounced at 10 MHz, the weighted-average resonance frequency of the population. In studies conducted using single microbubbles, Vos et al. (2008) and Mulvana et al. (2011) also reported that the temperature-mediated differences in radial excursion and onset of microbubble oscillations were most prominent at the resonant frequency.
Impact of temperature on the stability of Definity®
In this study, Definity® was found to be moderately less stable at 37 °C than at 25 °C. Previous studies suggest that changes in the liquid properties and surface tension will be negligible over the temperature range of 25 °C to 37 °C (Adam 1941; Mulvana et al. 2010). However, the gas saturation of the testing environment may have a significant effect on the stability of agents (Mulvana et al. 2012). At 37 °C, the amount of dissolved gas in the ambient fluid is lower, which could accelerate diffusion. It was observed that submicron bubbles were most susceptible to accelerated dissolution at 37 °C, which could be due to higher Laplace pressure for these bubbles (Leighton 2012). Additionally, reduction in shell stiffness (Katiyar et al. 2009) and shell viscosity (Mahalingam et al. 2014) could contribute to the reduction in stability of Definity® at 37 °C. Mulvana et al. (2010) reported a dramatic reduction in the diameter of SonoVue® over 10 minutes at 40 °C. However, their study was performed using water that was degassed by heating to boiling point and then cooling to room temperature (gas saturation not provided), which could accelerate the diffusion of gas from SonoVue® into the water. In addition, the temperature difference used by these investigators (20 °C vs. 40 °C) was larger than the temperature difference investigated in the present study (25 °C vs. 37 °C). The gases encapsulated by SonoVue® and Definity® (sulfur hexafluoride and octafluoropropane, respectively) are different, which could also contribute to the differences in their stability at 25 °C and 37 °C. Furthermore, evidence from previous studies suggest that SonoVue® may be more susceptible to dissolution at 40 °C than 37 °C, because of potential phase transition of lipids in its shell (Guiot et al. 2006).
In certain clinical applications, fluids such as saline may either be warmed to 37 °C (Faries et al. 1991) or cooled (Herold et al. 2015) before systemic administration. Radharkrishnan and colleagues showed that air-filled echogenic liposomes lose their echogenicity within 15 s when cooled from physiological temperature to room temperature (Radhakrishnan et al. 2012). In the present study, cooling diluted Definity® from 37 °C to 25 °C resulted in a marked increase in the dissolution rate (Figure 8). The dissolution happened over tens of minutes, likely in part due to the perfluorocarbon gas core of Definity®, which can enhance stability (Kabalnov et al. 1998; Sarkar et al. 2009) relative to the air core of echogenic liposomes. Nonetheless, researchers and clinicians should be mindful of the increased propensity of Definity® to dissolve rapidly after cooling from 37 °C to 25 °C. Changes in the gas saturation levels of aqueous solutions, combined with the change in shell properties (Katiyar et al. 2009) caused by rearrangement of lipids, could be the mechanism for the accelerated dissolution of Definity® when cooled from 37 °C to 25 °C. Mulvana et al. (2011) suggested that at physiological temperature, gas expansion may increase the size of the UCA and decrease the surface lipid concentration, leading to increased diffusivity and reduced dissolution times. However, the findings of this study suggest that changes in lipid structure and diffusivity can occur even in the absence of significant increase in UCA size.
In this study, the phase transition of the lipids in Definity® was found to occur between 41 °C and 43 °C. 1,2-Dipalmitoyl-sn-glycero-3-phosphocholine (DPPC) is the primary component of the shell of Definity®. In addition, the shell of Definity® also contains 1,2-Dipalmitoyl-sn-glycero-3-phosphate (DPPA) and MPEG5000 DPPE. These results are consistent with previous bulk phase study in which the phase transition of DPPC, the primary lipid component of the lipid shell was measured as 41 °C (Tamm and McConnell 1985). Previous studies have shown that the stability of Definity® may reduce once the phase transition has been reached. These results should be considered if Definity® is used for hyperthermia or UCA-enhanced heating studies (Guiot 2004; Guiot 2006; Meral 2014).
Clinical significance
The findings of this study show that the shell properties and stability of UCAs are dependent on temperature. These findings have implications for both diagnostic and therapeutic ultrasound. Shell properties influence the threshold for producing nonlinear bubble activity. Imaging techniques based on the nonlinear response of UCAs are under development to visualize vasculature (Maresca et al. 2013; Shekhar et al. 2016b) and for pressure sensing (Gupta et al. 2017). These experiments are often reported at room temperature, which may influence the interpretation of this data for clinical translation. Furthermore, stable cavitation has been identified as a dominant mechanism for drug delivery (Haworth et al. 2016) and sonothrombolysis (Bader et al. 2015). The goal of ultrasound exposure schemes designed for such applications is to promote sustained stable cavitation which relies on the stability of an UCA (Bader and Holland 2013). Cavitation thresholds and UCA destruction thresholds are closely related to shell properties (Bader and Holland 2013). Therefore, the temperature dependence of UCA shell properties and stability should be considered when choosing suitable therapeutic ultrasound exposure schemes for applications such as drug delivery and sonothrombolysis.
Study Limitations
The temperature-dependent changes in the physical and acoustic behavior of UCAs may vary based on the filling gas, and the properties of the shell formulation. Therefore, the results obtained with Definity® may not be representative of other UCAs. The shell properties of UCAs estimated using model-based techniques represent the weighted-average of the entire population. However, the shell properties may vary considerably throughout the population of UCAs, even for individual microbubbles with the same diameter (Sijl et al. 2010). Vial-to-vial and batch-to-batch variability in the physical and acoustic properties of Definity® was not investigated in this study. For example, attenuation coefficients reported in Figure 3 and Figure 6 (a) and (b) (at t = 0 min) differ by nearly 4 dB, which is likely because vials from two different batches were used for these measurements. Contrary to the assumptions of the model used in this study, the phospholipid shell surface can be inhomogeneous (Borden et al. 2004). Additionally, this study employed a static model devoid of hemodynamic pressure changes, and in vivo effects such as filtration (Jong et al. 1993), gas exchange in the lungs and phagocytosis (Yanagisawa et al. 2007), which could influence the stability of UCAs.
Conclusions
The results of this study demonstrate that the shell properties and acoustic behavior of Definity® are influenced by temperature. The size distribution of Definity® was not altered by an increase in temperature from 25 to 37 °C. It was demonstrated that the change in acoustic behavior of this UCA is predominantly due to changes in viscoelastic shell properties. The dissolution rate of Definity® was found to be dependent on temperature. Submicron bubbles appeared to shrink faster at physiological temperatures than at room temperature. Furthermore, cooling Definity® rapidly from physiological temperature to room temperature was shown to result in accelerated dissolution. These findings could help guide the choice of ultrasound exposure schemes and UCA handling protocols in the laboratory and clinical setting for diagnostic and therapeutic ultrasound.
Supplementary Material
Acknowledgments
This research was funded by National Institute of Neurological Diseases and Disorders grant R01 NS047603. We acknowledge support from the F. V. Hunt Postdoctoral Research Fellowship awarded to Dr. Himanshu Shekhar by the Acoustical Society of America. The authors thank Zhaoyu (Joe) Lou for providing technical assistance in the initial stages of this project, and Drs. Kevin Haworth and Arunkumar Palaniappan for useful discussions.
Footnotes
Publisher's Disclaimer: This is a PDF file of an unedited manuscript that has been accepted for publication. As a service to our customers we are providing this early version of the manuscript. The manuscript will undergo copyediting, typesetting, and review of the resulting proof before it is published in its final citable form. Please note that during the production process errors may be discovered which could affect the content, and all legal disclaimers that apply to the journal pertain.
References
- Adam NK. The physics and chemistry of surfaces. 3. Oxford University Press; 1941. [Google Scholar]
- Bader KB, Gruber MJ, Holland CK. Shaken and Stirred: Mechanisms of Ultrasound-Enhanced Thrombolysis. Ultrasound Med Biol. 2015;41:187–196. doi: 10.1016/j.ultrasmedbio.2014.08.018. [DOI] [PMC free article] [PubMed] [Google Scholar]
- Bader KB, Holland CK. Gauging the likelihood of stable cavitation from ultrasound contrast agents. Phys Med Biol. 2013;58:127–44. doi: 10.1088/0031-9155/58/1/127. [DOI] [PMC free article] [PubMed] [Google Scholar]
- Bekeredjian R, Grayburn PA, Shohet RV. Use of ultrasound contrast agents for gene or drug delivery in cardiovascular medicine. J Am Coll Cardiol. 2005;45:329–335. doi: 10.1016/j.jacc.2004.08.067. [DOI] [PubMed] [Google Scholar]
- Borden MA, Kruse DE, Caskey CF, Zhao S, Dayton PA, Ferrara KW. Influence of lipid shell physicochemical properties on ultrasound-induced microbubble destruction. IEEE Trans Ultrason Ferroelectr Freq Control. 2005;52:1992–2005. doi: 10.1109/tuffc.2005.1561668. [DOI] [PMC free article] [PubMed] [Google Scholar]
- Borden MA, Pu G, Runner GJ, Longo ML. Surface phase behavior and microstructure of lipid/PEG-emulsifier monolayer-coated microbubbles. Colloids Surfaces B Biointerfaces. 2004;35:209–223. doi: 10.1016/j.colsurfb.2004.03.007. [DOI] [PubMed] [Google Scholar]
- Bryan AK, Engler A, Gulati A, Manalis SR. Continuous and long-term volume measurements with a commercial coulter counter. PLoS One. 2012;7:1–8. doi: 10.1371/journal.pone.0029866. [DOI] [PMC free article] [PubMed] [Google Scholar]
- Chatterjee D, Sarkar K, Jain P. On the suitability of broadband attenuation measurement for characterizing contrast microbubbles. Ultrasound Med Biol. 2005;31:781–786. doi: 10.1016/j.ultrasmedbio.2005.02.014. [DOI] [PubMed] [Google Scholar]
- Claudon M, Dietrich CF, Choi BI, Cosgrove DO, Kudo M, Nolsoe CP, Piscaglia F, Wilson SR, Barr RG, Chammas MC, Chaubal NG, Chen MH, Clevert DA, Correas JM, Ding H, Forsberg F, Fowlkes JB, Gibson RN, Goldberg BB, Lassau N, Leen ELS, Mattrey RF, Moriyasu F, Solbiati L, Weskott HP, Xu HX. Guidelines and good clinical practice recommendations for contrast enhanced ultrasound (CEUS) in the liver - Update 2012. Ultraschall der Medizin. 2013;34:11–29. doi: 10.1055/s-0032-1325499. [DOI] [PubMed] [Google Scholar]
- Cosgrove D. Ultrasound contrast agents: An overview. Eur J Radiol. 2006;60:324–330. doi: 10.1016/j.ejrad.2006.06.022. [DOI] [PubMed] [Google Scholar]
- Dave JK, Halldorsdottir VG, Eisenbrey JR, Raichlen JS, Bin Liu J, McDonald ME, Dickie K, Wang S, Leung C, Forsberg F. Noninvasive LV pressure estimation using subharmonic emissions from microbubbles. JACC Cardiovasc Imaging. 2012:87–92. doi: 10.1016/j.jcmg.2011.08.017. [DOI] [PMC free article] [PubMed] [Google Scholar]
- Definity (perflutren lipid microspheres) for injectable suspension full prescribing information. North Birillica MA: Lantheus Medical Imaging; 2013. [Google Scholar]
- de Jong N, Hoff L, Skotland T, Bom N. Absorption and scatter of encapsulated gas filled microspheres: Theoretical considerations and some measurements. Ultrasonics. 1992;30:95–103. doi: 10.1016/0041-624x(92)90041-j. [DOI] [PubMed] [Google Scholar]
- Deshpande N, Needles A, Willmann JK. Molecular ultrasound imaging: current status and future directions. Clin Radiol. 2010;65:567–581. doi: 10.1016/j.crad.2010.02.013. [DOI] [PMC free article] [PubMed] [Google Scholar]
- Errico C, Pierre J, Pezet S, Desailly Y, Lenkei Z, Couture O, Tanter M. Ultrafast ultrasound localization microscopy for deep super-resolution vascular imaging. Nature Nature Publishing Group. 2015;527:499–502. doi: 10.1038/nature16066. [DOI] [PubMed] [Google Scholar]
- Faez T, Goertz D, De Jong N. Characterization of DefinityTM Ultrasound Contrast Agent at Frequency Range of 5–15 MHz. Ultrasound Med Biol. 2011;37:338–342. doi: 10.1016/j.ultrasmedbio.2010.11.014. [DOI] [PubMed] [Google Scholar]
- Faries G, Johnston C, Pruitt KM, Plouff RT. Temperature relationship to distance and flow rate of warmed IV fluids. Ann Emerg Med. 1991;20:1198–1200. doi: 10.1016/s0196-0644(05)81470-2. [DOI] [PubMed] [Google Scholar]
- Forsberg F, Liu J-B, Shi WT, Furuse J, Shimizu M, Goldberg BB. In vivo pressure estimation using subharmonic contrast microbubble signals: proof of concept. IEEE Trans Ultrason Ferroelectr Freq Control. 2005;52:581–3. doi: 10.1109/tuffc.2005.1428040. [DOI] [PubMed] [Google Scholar]
- Goertz DE, de Jong N, van der Steen AFW. Attenuation and Size Distribution Measurements of Definity™ and Manipulated Definity™ Populations. Ultrasound Med Biol. 2007;33:1376–1388. doi: 10.1016/j.ultrasmedbio.2007.03.009. [DOI] [PubMed] [Google Scholar]
- Gorce JM, Arditi M, Schneider M. Influence of bubble size distribution on the echogenicity of ultrasound contrast agents: a study of SonoVue. Invest Radiol. 2000;35:661–671. doi: 10.1097/00004424-200011000-00003. [DOI] [PubMed] [Google Scholar]
- Guiot C, Cavalli R, Gaglioti P, Danelon D, Musacchio C, Trotta M, Todros T. Temperature monitoring using ultrasound contrast agents: In vitro investigation on thermal stability. Ultrasonics. 2004;42:927–930. doi: 10.1016/j.ultras.2003.11.003. [DOI] [PubMed] [Google Scholar]
- Guiot C, Pastore G, Napoleone M, Gabriele P, Trotta M, Cavalli R. Thermal response of contrast agent microbubbles: preliminary results from physico-chemical and US-imaging characterization. Ultrasonics. 2006;44(Suppl 1):e127–30. doi: 10.1016/j.ultras.2006.06.031. [DOI] [PubMed] [Google Scholar]
- Gupta I, Eisenbrey J, Stanczak M, Sridharan A, Dave JK, Liu J-B, Hazard C, Wang X, Wang P, Li H, Wallace K, Forsberg F. Effect of Pulse Shaping on Subharmonic Aided Pressure Estimation In Vitro and In Vivo. J Ultrasound Med. 2017;36:3–11. doi: 10.7863/ultra.15.11106. [DOI] [PMC free article] [PubMed] [Google Scholar]
- Harfield C, Fury CR, Memoli G, Jones P, Ovenden N, Stride E. Analysis of the Uncertainty in Microbubble Characterization. Ultrasound Med Biol. 2016;42:1412–1418. doi: 10.1016/j.ultrasmedbio.2016.01.005. [DOI] [PubMed] [Google Scholar]
- Haworth KJ, Raymond JL, Radhakrishnan K, Moody MR, Huang S-L, Peng T, Shekhar H, Klegerman ME, Kim H, McPherson DD, Holland CK. Trans-Stent B-Mode Ultrasound and Passive Cavitation Imaging. Ultrasound Med Biol. 2016;42:518–27. doi: 10.1016/j.ultrasmedbio.2015.08.014. [DOI] [PMC free article] [PubMed] [Google Scholar]
- Helfield B, Huo X, Williams R, Goertz DE. The effect of preactivation vial temperature on the acoustic properties of Definity™. Ultrasound Med Biol. 2012;38:1298–1305. doi: 10.1016/j.ultrasmedbio.2012.03.005. [DOI] [PubMed] [Google Scholar]
- Helfield B, Goertz DE. Nonlinear resonance behavior and linear shell estimates for DefinityTM and MicroMarkerTM assessed with acoustic microbubble spectroscopy. J Acoust Soc Am. 2013;133:1158–1168. doi: 10.1121/1.4774379. [DOI] [PubMed] [Google Scholar]
- Herold IHF, Soliman Hamad MA, Van Assen HC, Bouwman RA, Korsten HHM, Mischi M. Pulmonary blood volume measured by contrast enhanced ultrasound: A comparison with transpulmonary thermodilution. Br J Anaesth. 2015;115:53–60. doi: 10.1093/bja/aeu554. [DOI] [PubMed] [Google Scholar]
- Hoff L. Acoustic characterization of contrast agents for medical ultrasound imaging. Berlin/Heidelberg: Springer; 2001. [Google Scholar]
- Hynynen K, McDannold N, Vykhodtseva N, Raymond S, Weissleder R, Jolesz Fa, Sheikov N. Focal disruption of the blood brain barrier due to 260-kHz ultrasound bursts: a method for molecular imaging and targeted drug delivery. J Neurosurg. 2006;105:445–454. doi: 10.3171/jns.2006.105.3.445. [DOI] [PubMed] [Google Scholar]
- de Jong N, Ten Cate FJ, Vletter WB, Roelandt JRTC. Quantification of transpulmonary echocontrast effects. Ultrasound Med Biol. 1993;19:279–288. doi: 10.1016/0301-5629(93)90100-3. [DOI] [PubMed] [Google Scholar]
- Kabalnov A, Bradley J, Flaim S, Klein D, Pelura T, Peters B, Otto S, Reynolds J, Schutt E, Weers J. Dissolution of multicomponent microbubbles in the bloodstream: 2. Experiment Ultrasound Med Biol. 1998;24:751–760. doi: 10.1016/s0301-5629(98)00033-7. [DOI] [PubMed] [Google Scholar]
- Kanbar E, Fouan D, Sennoga CA, Doinikov AA, Bouakaz A. Impact of Filling Gas on Subharmonic Emissions of Phospholipid Ultrasound Contrast Agents. Ultrasound Med Biol. 2017:1–12. doi: 10.1016/j.ultrasmedbio.2016.12.013. [DOI] [PubMed] [Google Scholar]
- Katiyar A, Sarkar K, Jain P. Effects of encapsulation elasticity on the stability of an encapsulated microbubble. J Colloid Interface Sci. 2009;336:519–525. doi: 10.1016/j.jcis.2009.05.019. [DOI] [PubMed] [Google Scholar]
- Kooiman K, Vos HJ, Versluis M, De Jong N. Acoustic behavior of microbubbles and implications for drug delivery. Adv Drug Deliv Rev. 2014;72:28–48. doi: 10.1016/j.addr.2014.03.003. [DOI] [PubMed] [Google Scholar]
- Kumar KN, Sarkar K. Effects of ambient hydrostatic pressure on the material properties of the encapsulation of an ultrasound contrast microbubble. J Acoust Soc Am. 2015;138:624–634. doi: 10.1121/1.4923364. [DOI] [PubMed] [Google Scholar]
- Leighton T. The Acoustic Bubble. Academic Press; 2012. [Google Scholar]
- Leighton TG. The Acoustic Bubble. J Acoust Soc Am. 1994;96:2616. [Google Scholar]
- Lu Y, Wang J, Huang R, Chen G, Zhong L, Shen S, Zhang C, Li X, Cao S, Liao W, Liao Y, Bin J. Microbubble-Mediated Sonothrombolysis Improves Outcome After Thrombotic Microembolism-Induced Acute Ischemic Stroke. Stroke. 2016;47:1344–1353. doi: 10.1161/STROKEAHA.115.012056. [DOI] [PubMed] [Google Scholar]
- Lumason (sulfur hexafluoridelipid-type A microspheres) for injectable suspension full prescribing information. Monroe township, NJ: Bracco Diagnostics; 2016. [Google Scholar]
- Mahalingam S, Meinders MBJ, Edirisinghe M. Formation, stability and mechanical properties of BSA stabilized air bubbles produced using electrohydrodynamic atomization. Langmuir. 2014;30:6694–6703. doi: 10.1021/la5011715. [DOI] [PubMed] [Google Scholar]
- Maresca D, Renaud G, van Soest G, Li X, Zhou Q, Shung KK, De Jong N, Van der Steen AFW. Contrast-Enhanced Intravascular Ultrasound Pulse Sequences for Bandwidth-Limited Transducers. Ultrasound Med Biol. 2013;39:706–713. doi: 10.1016/j.ultrasmedbio.2012.10.020. [DOI] [PMC free article] [PubMed] [Google Scholar]
- Marmottant P, van der Meer S, Emmer M, Versluis M, de Jong N, Hilgenfeldt S, Lohse D. A model for large amplitude oscillations of coated bubbles accounting for buckling and rupture. J Acoust Soc Am. 2005;118:3499. [Google Scholar]
- McDannold N, Vykhodtseva N, Hynynen K. Effects of Acoustic Parameters and Ultrasound Contrast Agent Dose on Focused-Ultrasound Induced Blood-Brain Barrier Disruption. Ultrasound Med Biol. 2008;34:930–937. doi: 10.1016/j.ultrasmedbio.2007.11.009. [DOI] [PMC free article] [PubMed] [Google Scholar]
- Meral FC. The effects of temperature on the nonlinear oscillations of contrast enhancing microbubbles. Proc Meet Acoust. 2014;21:020001. [Google Scholar]
- Mulvana H, Browning RJ, Luan Y, de Jong N, Tang M-X, Eckersley RJ, Stride E. Characterisation of Contrast Agent Microbubbles for Ultrasound Imaging and Therapy Research. IEEE Trans Ultrason Ferroelectr Freq Control. 2016;64:232–251. doi: 10.1109/TUFFC.2016.2613991. [DOI] [PubMed] [Google Scholar]
- Mulvana H, Stride E, Hajnal JV, Eckersley RJ. Temperature dependent behavior of ultrasound contrast agents. Ultrasound Med Biol. 2010;36:925–34. doi: 10.1016/j.ultrasmedbio.2010.03.003. [DOI] [PubMed] [Google Scholar]
- Mulvana H, Stride E, Tang M, Hajnal JV, Eckersley R. Temperature-Dependent Differences in the Nonlinear Acoustic Behavior of Ultrasound Contrast Agents Revealed by High-Speed Imaging and Bulk Acoustics. Ultrasound Med Biol. 2011;37:1509–1517. doi: 10.1016/j.ultrasmedbio.2011.05.020. [DOI] [PubMed] [Google Scholar]
- Mulvana H, Stride E, Tang MX, Hajnal JV, Eckersley RJ. The Influence of Gas Saturation on Microbubble Stability. Ultrasound Med Biol. 2012;38:1097–1100. doi: 10.1016/j.ultrasmedbio.2012.02.008. [DOI] [PubMed] [Google Scholar]
- Nakatsuka MA, Mattrey RF, Esener SC, Cha JN, Goodwin AP. Aptamer-crosslinked microbubbles: Smart contrast agents for thrombin-activated ultrasound imaging. Adv Mater. 2012;24:6010–6016. doi: 10.1002/adma.201201484. [DOI] [PMC free article] [PubMed] [Google Scholar]
- Radhakrishnan K, Haworth KJ, Huang SL, Klegerman ME, McPherson DD, Holland CK. Stability of Echogenic Liposomes as a Blood Pool Ultrasound Contrast Agent in a Physiologic Flow Phantom. Ultrasound Med Biol. 2012;38:1970–1981. doi: 10.1016/j.ultrasmedbio.2012.06.012. [DOI] [PMC free article] [PubMed] [Google Scholar]
- Raymond JL, Haworth KJ, Bader KB, Radhakrishnan K, Griffin JK, Huang SL, McPherson DD, Holland CK. Broadband attenuation measurements of phospholipid-shelled ultrasound contrast agents. Ultrasound Med Biol. 2014;40:410–421. doi: 10.1016/j.ultrasmedbio.2013.09.018. [DOI] [PMC free article] [PubMed] [Google Scholar]
- Sarkar K, Katiyar A, Jain P. Growth and dissolution of an encapsulated contrast microbubble: effects of encapsulation permeability. Ultrasound Med Biol. 2009;35:1385–96. doi: 10.1016/j.ultrasmedbio.2009.04.010. [DOI] [PMC free article] [PubMed] [Google Scholar]
- Satinover SJ, Dove JD, Borden MA. Single-particle optical sizing of microbubbles. Ultrasound Med Biol. 2014;40:138–147. doi: 10.1016/j.ultrasmedbio.2013.08.018. [DOI] [PubMed] [Google Scholar]
- Sennoga CA, Yeh JSM, Alter J, Stride E, Nihoyannopoulos P, Seddon JM, Haskard DO, Hajnal JV, Tang MX, Eckersley RJ. Evaluation of Methods for Sizing and Counting of Ultrasound Contrast Agents. Ultrasound Med Biol. 2012;38:834–845. doi: 10.1016/j.ultrasmedbio.2012.01.012. [DOI] [PMC free article] [PubMed] [Google Scholar]
- Shekhar H, Awuor I, Thomas K, Rychak JJ, Doyley MM. The delayed onset of subharmonic and ultraharmonic emissions from a phospholipid-shelled microbubble contrast agent. Ultrasound Med Biol. 2014;40:727–738. doi: 10.1016/j.ultrasmedbio.2014.01.002. [DOI] [PMC free article] [PubMed] [Google Scholar]
- Shekhar H, Bader KB, Huang S, Peng T, Huang S, McPherson DD, Holland CK. In vitro thrombolytic efficacy of echogenic liposomes loaded with tissue plasminogen activator and octafluoropropane gas. Phys Med Biol. 2016a;62:517–538. doi: 10.1088/1361-6560/62/2/517. [DOI] [PMC free article] [PubMed] [Google Scholar]
- Shekhar H, Huntzicker S, Awuor I, Doyley MM. Chirp-Coded Ultraharmonic Imaging with a Modified Clinical Intravascular Ultrasound System. Ultrason Imaging. 2016b;38:403–419. doi: 10.1177/0161734615618639. [DOI] [PubMed] [Google Scholar]
- Shekhar H, Rychak JJ, Doyley MM. Modifying the size distribution of microbubble contrast agents for high-frequency subharmonic imaging. Med Phys. 2013;40:082903-1–082903-10. doi: 10.1118/1.4813017. [DOI] [PMC free article] [PubMed] [Google Scholar]
- Shelton SE, Lee YZ, Lee M, Cherin E, Foster FS, Aylward SR, Dayton PA. Quantification of microvascular tortuosity during tumor evolution using acoustic angiography. Ultrasound Med Biol. 2015;41:1896–1904. doi: 10.1016/j.ultrasmedbio.2015.02.012. [DOI] [PMC free article] [PubMed] [Google Scholar]
- Shi WT, Forsberg F, Raichlen JS, Needleman L, Goldberg BB. Pressure dependence of subharmonic signals from contrast microbubbles. Ultrasound Med Biol. 1999;25:275–283. doi: 10.1016/s0301-5629(98)00163-x. [DOI] [PubMed] [Google Scholar]
- Sijl J, Dollet B, Overvelde M, Garbin V, Rozendal T, de Jong N, Lohse D, Versluis M. Subharmonic behavior of phospholipid-coated ultrasound contrast agent microbubbles. J Acoust Soc Am. 2010;128:3239–52. doi: 10.1121/1.3493443. [DOI] [PubMed] [Google Scholar]
- Sun C, Panagakou I, Sboros V, Butler MB, Kenwright D, Thomson AJW, Moran CM. Influence of temperature, needle gauge and injection rate on the size distribution, concentration and acoustic responses of ultrasound contrast agents at high frequency. Ultrasonics. 2016;70:84–91. doi: 10.1016/j.ultras.2016.04.013. [DOI] [PubMed] [Google Scholar]
- Tamm LK, McConnell HM. Supported phospholipid bilayers. Biophys J. 1985;47:105–113. doi: 10.1016/S0006-3495(85)83882-0. [DOI] [PMC free article] [PubMed] [Google Scholar]
- Unnikrishnan S, Klibanov AL. Microbubbles as ultrasound contrast agents for molecular imaging: preparation and application. AJR Am J Roentgenol. 2012;199:292–9. doi: 10.2214/AJR.12.8826. [DOI] [PubMed] [Google Scholar]
- van der Meer SM, Dollet B, Voormolen MM, Chin CT, Bouakaz A, de Jong N, Versluis M, Lohse D. Microbubble spectroscopy of ultrasound contrast agents. J Acoust Soc Am. 2007;121:648–656. doi: 10.1121/1.2390673. [DOI] [PubMed] [Google Scholar]
- van Rooij T, Luan Y, Renaud G, van der Steen AFW, Versluis M, de Jong N, Kooiman K. Nonlinear Response and Viscoelastic Properties of Lipid-Coated Microbubbles: DSPC versus DPPC. Ultrasound Med Biol. 2015;41:1432–1445. doi: 10.1016/j.ultrasmedbio.2015.01.004. [DOI] [PubMed] [Google Scholar]
- Vos HJ, Emmer M, De Jong N. Oscillation of single microbubbles at room versus body temperature. IEEE Ultrason Symp. 2008:982–984. [Google Scholar]
- Xia L, Porter TM, Sarkar K. Interpreting attenuation at different excitation amplitudes to estimate strain-dependent interfacial rheological properties of lipid-coated monodisperse microbubbles. J Acoust Soc Am. 2015;138:3994–4003. doi: 10.1121/1.4938234. [DOI] [PubMed] [Google Scholar]
- Yanagisawa K, Moriyasu F, Miyahara T, Yuki M, Iijima H. Phagocytosis of ultrasound contrast agent microbubbles by Kupffer cells. Ultrasound Med Biol. 2007;33:318–325. doi: 10.1016/j.ultrasmedbio.2006.08.008. [DOI] [PubMed] [Google Scholar]
- Yang X, Li J, He X, Wu K, Yuan Y, Ding M. Relationship of Ultrasound Signal Intensity with SonoVue Concentration at Body Temperature in Vitro. Proc of SPIE. 9038:1–8. [Google Scholar]
- Yeh CK, Su SY. Effects of Acoustic Insonation Parameters on Ultrasound Contrast Agent Destruction. Ultrasound Med Biol. 2008;34:1281–1291. doi: 10.1016/j.ultrasmedbio.2007.12.020. [DOI] [PubMed] [Google Scholar]
- Zook JM, Vreeland WN. Effects of temperature, acyl chain length, and flow-rate ratio on liposome formation and size in a microfluidic hydrodynamic focusing device. Soft Matter. 2010;6:1352–1360. [Google Scholar]
Associated Data
This section collects any data citations, data availability statements, or supplementary materials included in this article.