Abstract
Medical imaging plays an important role in the diagnosis and management of hepatocellular carcinoma (HCC). The Liver Imaging Reporting and Data System (LI-RADS) was initially created to standardize the reporting and data collection of CT and MR imaging for patients at risk for HCC. As contrast-enhanced ultrasound (CEUS) has been widely used in clinical practice, it has recently been added to the LI-RADS. While CEUS LI-RADS shares fundamental concepts with CT/MRI LI-RADS, there are key differences between the modalities reflecting dissimilarities in the underlying methods of image acquisition and types of contrast material. This review introduces a recent update of CEUS LI-RADS and explains the key differences from CT/MRI LI-RADS.
Keywords: Carcinoma, Hepatocellular; Liver; Ultrasonography; Contrast Media; Diagnosis, Ultrasonic
INTRODUCTION
Hepatocellular carcinoma (HCC) is the second most common cause of cancer death worldwide and occurs most often in patients with risk factors for developing HCC including cirrhosis and chronic hepatitis B [1]. Surveillance programs for HCC in high-risk patients have long been implemented in countries where the incidence of HCC is high. Once a focal hepatic nodule is detected during HCC surveillance with ultrasound (US) or other imaging modalities, a diagnostic imaging test including contrast-enhanced CT, MRI, or contrast-enhanced ultrasound (CEUS) is performed. CEUS has been established as a useful tool in the multimodality approach to characterize hepatic nodules [2].
The Liver Imaging Reporting and Data System (LI-RADS) was initially created to standardize the reporting and data collection of CT and MR imaging for patients at risk for HCC [3,4]. As CEUS has been widely used in clinical practice, the American College of Radiology (ACR) in 2014 convened a group of international experts to develop CEUS LI-RADS. After extensive discussions by the working group and based on feedback received at international conferences where preliminary versions of CEUS LI-RADS were presented, an official CEUS-LI-RADS version 2016 was published in August 2016 [5]. The working group has recently finalized a revision for CEUS LI-RADS version 2017 which will be available soon.
While CEUS LI-RADS shares fundamental concepts with CT/MRI LI-RADS, there are key differences between the modalities reflecting dissimilarities in the underlying methods of image acquisition and types of contrast material.
In this article, we review the diagnostic algorithms in the CEUS LI-RADS version 2017, discuss the key differences from CT/MRI LI-RADS, and provide illustrative examples.
CONTRAST AGENTS IN CEUS
CEUS uses microbubble contrast agents. Microbubbles are gasfilled microspheres that are strictly intravascular because their size of several micrometers does not permit them to pass through the vascular endothelium into the interstitial space [2]. There is no renal excretion of microbubbles as the gas within the microbubbles diffuses through the thin shell and the agents have a half-life of only a few minutes in blood. Microbubbles are not shown to have nephrotoxicity; their gas is eliminated with respiration even in patients with chronic obstructive pulmonary disease [6] and the microbubble shell, which is often composed of phospholipids, is metabolized rapidly within the lipid pool of the human body. Therefore microbubbles can be safely used in patients with renal failure for whom the use of CT/MRI contrast agents is contraindicated [7]. Among the CEUS contrast agents currently available for liver imaging, Definity/Luminity (perflutren lipid microspheres, Lantheus Medical Imaging, Billerica, MA, USA) and Sonovue/Lumason (sulfur hexafluoride microbubbles, Bracco Imaging, Milan, Italy) are the most commonly used in western nations. Sonazoid (perfluorobutane, Daiichi-Sankyo, GE Tokyo, Japan), which is actively used in Japan, South Korea, and Norway, enables additional liver evaluation in the Kupffer phase, as Sonazoid microbubbles are internalized by Kupffer cells. Although Sonazoid is not included in CEUS LI-RADS v2017, it is expected to be included in future versions of CEUS LI-RADS.
CEUS LI-RADS
CEUS LI-RADS provides a diagnostic algorithm which categorizes observations in the liver from LR-1 (definitely benign) through LR-5 (definitely HCC) according to observation size and enhancement patterns, as shown in the diagnostic table (Fig. 1, 2) [8]. The term “observation” was introduced instead of “lesion” in LI-RADS for CT or MR scan. Observation is defined as a distinctive area with imaging features that differ from those of adjacent liver parenchyma. It may be a lesion/nodule or pseudolesion. A nodule refers to a discrete mass of rounded or irregular shape. For CEUS LI-RADS, observation is also used at the beginning of the algorithm although it is recognized that, for CEUS, virtually all examinations are performed for evaluation of a discrete nodule. This is a recognized and important distinction of CEUS LI-RADS from LI-RADS for CT/MR scan.
Figure 1.
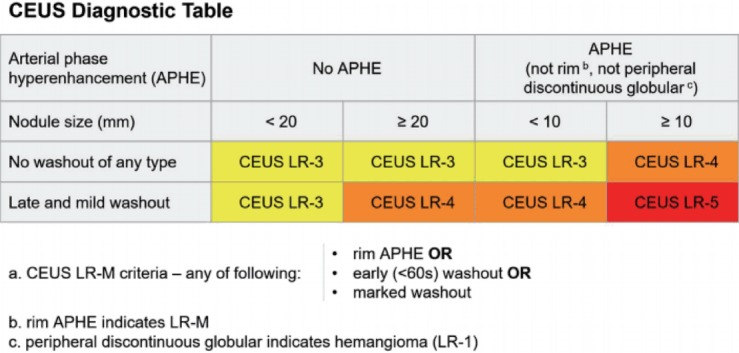
CEUS diagnostic table in LI-RADS v2017.
Figure 2.
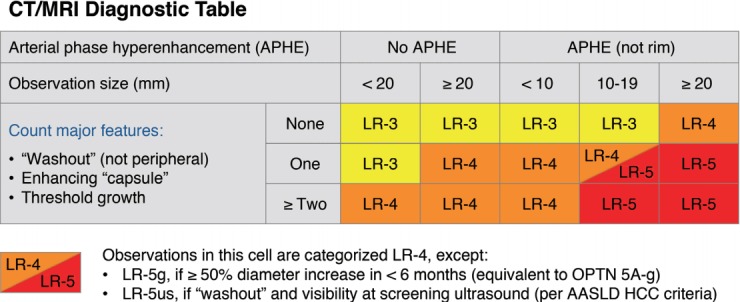
CT/MRI diagnostic table in LI-RADS v2017.
LI-RADS also advocates the term “arterial phase hyperenhancement (APHE)” which is descriptive and non-ambiguous replacing other frequently used descriptors such as “hypervascularity”, “intense arterial phase uptake”, or “wash-in” [9]. LR-5 is an important category because LR-5 nodules can be treated as HCC without biopsy or further imaging. LR-4 (probable HCC) nodules usually require biopsy, but alternative imaging or short-term (<3 months) imaging follow-up can be applied if neither biopsy nor treatment is implemented immediately based on multidisciplinary discussion. LR-3 (intermediated probability of malignancy) generally requires alternative imaging or follow-up, but may require biopsy in selected cases based on multidisciplinary discussion.
Other categories include: LR-M, LR-NC (not categorizable), and LR-TIV (tumor in vein). LR-M is assigned to nodules with imaging features that are probably or definitely malignant but not specific for HCC. The differential diagnosis of LR-M observations includes atypical HCCs and non-HCC malignancies such as intrahepatic cholangiocarcinoma (ICC) and metastases. The imaging features for LR-M include rim APHE, early (<60 seconds) washout, or marked washout. Biopsy is usually required for LR-M to exclude non-HCC malignancy [3]. If the observation is not evaluable with CEUS because of image degradation or omission, it is categorized as LR-NC [8]. LR-TIV refers to definite enhancing soft tissue in the portal or hepatic vein regardless of visualization of a parenchymal mass/nodule. The intravenous soft tissue lesion must have definite enhancement to some degree in the arterial phase followed by washout, regardless of onset or degree [3,10].
KEY DIFFERENCES FROM CT/MRI LI-RADS
Real-time assessment of arterial phase (AP) enhancement in CEUS
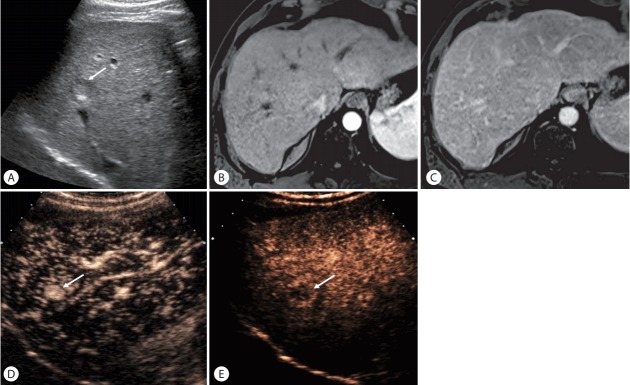
CEUS allows real-time evaluation of the enhancement of a nodule that is well visible at gray-scale US, providing more sensitive detection of APHE than CT or MRI, which may fail to demonstrate APHE due to AP mistiming (Fig. 3) [11-13]. APHE is one of the most important imaging features for diagnosing HCC and is a necessary imaging feature for LR-5 categorization: LR-5 cannot be assigned to liver observations lacking APHE. Therefore, CEUS is a reasonable alternative imaging option for nodules categorized at CT or MRI as LR-3 or LR-4 due to the absence of APHE; some of these nodules potentially could be upgraded to LR-5 if APHE and washout are shown on CEUS.
Figure 3.
HCC in a 64-year-old man with hepatis C cirrhosis. (A) US scan shows a hypoechoic nodule (arrow) in the liver. (B, C) The nodule is not clearly seen on contrast-enhanced MRI in the arterial phase (B) and delayed phase (C). (D) CEUS obtained at 15 seconds after contrast injection shows arterial-phase hyperenhancement of the nodule (arrow). (E) The nodule (arrow) shows mild washout at 4 minutes.
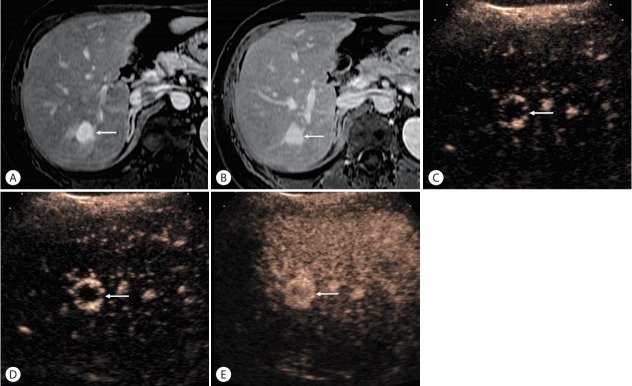
Rapidly enhancing hemangiomas (often referred to as flash-filling hemangiomas) are often seen as nodules with homogeneous APHE on CT or MRI [14]. As the classic peripheral discontinuous puddling may be absent on these modalities, such hemangiomas may cause diagnostic confusion, leading their categorization as LR-3, LR-4, or even LR-M by CT or MRI. CEUS may be especially useful in such cases because real-time imaging in the arterial phase depicts the characteristic filling and enhancement pattern of hemangiomas (ie, peripheral nodular enhancement with centripetal fillin) regardless of the rapidity of its occurrence (Fig. 4) [15-17]. This allows even rapidly enhancing hemangiomas to be reliably categorized on CEUS as LR-1.
Figure 4.
Rapidly enhancing hemangioma in a 51-year-old woman with chronic hepatis B. (A, B) There is a nodule (arrows) with homogeneous hyperenhance-ment on contrast-enhanced MRI in the arterial phase (A) and delayed phase (B). (C-E) CEUS images obtained at 11 (C), 12 (D), and 15 seconds (E) after contrast injection shows peripheral discontinuous globular arterial-phase hyperenhancement with progressive centripetal f lling in the nodule (arrows), diagnostic for hemangioma. Real time CEUS shows the rapidly changing enhancement of benign liver tumors.
Absence of vascular pseudolesions on CEUS
Arterioportal shunts are the most common pseudolesions in cirrhotic livers shown on CT and MRI and are typically seen as wedge-shaped areas of APHE without washout [18-21]. Identification of these small foci of APHE without washout on CT or MRI is more commonly associated with benign lesions than HCC because of the very high incidence of arterioportal shunts [22-25].
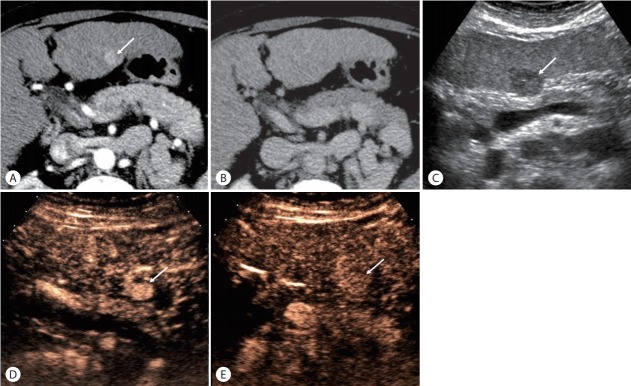
While most arterioportal shunts are wedge shaped, permitting their diagnosis on CT and MRI, some may appear nodular, depending on their geometry and orientation relative to the imaging plane. Such shunts may be mistaken for true lesions on CT or MRI and may be categorized as LR-3 or LR-4 in CT/MRI LI-RADS. Additionally, when arterioportal shunts are numerous, they may obscure true HCCs, lowering the sensitivity of CT or MRI for HCC detection. On the other hand, CEUS rarely depicts any arterioportal shunts. After excluding hemangiomas and rim-enhancing nodules, therefore, observations with APHE on CEUS are more likely to be HCC in high-risk patients, even in the absence of washout (Fig. 5) [2,26,27]. Thus, any nodule with APHE on CEUS measuring 10 mm or larger is either LR-5 or LR-4 depending on the presence or absence of washout (Fig. 1). HCC with APHE and no washout are often well-differentiated HCC [26,28].
Figure 5.
HCC in a 53-year-old woman with hepatis C cirrhosis. (A) There is an observation (arrow) with arterial-phase hyperenhancement on contrast-enhanced CT in the arterial phase. (B) The observation is not seen in the delayed phase due to iso-enhancement relative to the liver. This is an indeterminate CT scan. (C) gray-scale US image shows a discrete hypoechoic nodule (arrow). (D) CEUS images obtained at 16 seconds after contrast injection shows a nodule (arrow) with arterial-phase hyperenhancement. (E) CEUS images obtained at 270 seconds after contrast injection shows persistent hyperenhancement of the nodule (arrow). This is CEUS LR-4 (probably HCC), conf rmed as HCC.
By comparison, an observation with APHE on CT/MRI can range from LR-3 to LR-5 depending on its size and other major imaging features including washout, an enhancing capsule, and threshold growth (Fig. 2) because CT/MRI APHE has less specificity for HCC. In CT/MRI LI-RADS, there is a category of LR-5us which can be assigned to 10-19 mm observation with APHE and washout and visibility at screening US. A 10-19 mm nodule with APHE and washout on CEUS is assigned to LR-5 on CEUS because CEUS is already performed for visible nodules on gray-scale US.
Following this concept, it is not surprising that the CEUS LR-3 category will include a higher rate of HCC than the CT/MRI LR-3 category. In fact, CEUS is performed on real nodules, usually same or greater than 10 mm in size and this condition already implies a significant risk of presenting a HCC. In contrast to CEUS, CT/MRI also detects LR-3 observations that are not real nodules or that may be less than 10 mm in size, as detected during the characterization of another larger lesion. Hence the rate of HCC is expected to be lower in CT/MRI LR-3 category.
Characterization of washout: purely intravascular microbubble contrast agent in CEUS
Mass-forming ICCs are occasionally found during HCC surveillance although the incidence is lower than that of HCC [29,30]. As there are considerable differences of treatment strategy and prognosis between HCC and ICC, it is important to differentiate the two.
Almost all malignant tumors except uncommon cases of well-differentiated HCC show washout on CEUS due to their lower blood volume than liver. However, some malignancies with high vascular permeability and large extracellular interstitial space, including ICC, may fail to show washout on CT or MRI. Instead they show progressive enhancement rather than washout in the delayed phase of CT or MRI [31-35] as the contrast agents for CT/MRI tend to diffuse through the vascular endothelium and accumulate in the tissue interstitium especially in the tumors with desmoplastic reaction (Fig. 6) [2,36-39]. Hence there are considerable differences of enhancement features between HCC and ICC on CT/MRI as most HCC show washout and ICC often show progressive enhancement in the late phase.
Figure 6.
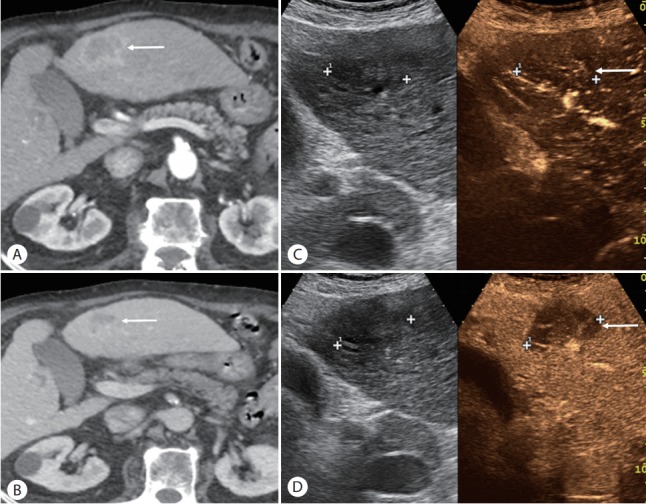
Intrahepatic cholangiocarcinoma in a patient with alcoholic liver cirrhosis. (A) There is a mass (arrow) with rim arterialphase hyperenhancement on contrast-enhanced CT in the arterial phase. (B) There is a progressive enhancement of the mass (arrow) in the delayed phase. (C) On dual-imaging display of the CEUS image (grayscale on the left and CEUS on the right) in the arterial phase, the mass (arrow) shows isoenhancement relative to the liver. (D) CEUS image in the late phase shows marked washout (arrow), CEUS LR-M appearance. Biopsy confi rmed cholangiocarcinoma.
By comparison, ICCs and HCCs may overlap superficially in appearance on CEUS as both tumor types may show APHE and washout [11], raising concern a decade ago of misdiagnosis of ICC as HCC [40-43]. However, more recent studies have shown that detailed assessment of APHE characteristics and of the timing and degree of washout can reliably differentiate ICC from HCC [40,44-47].
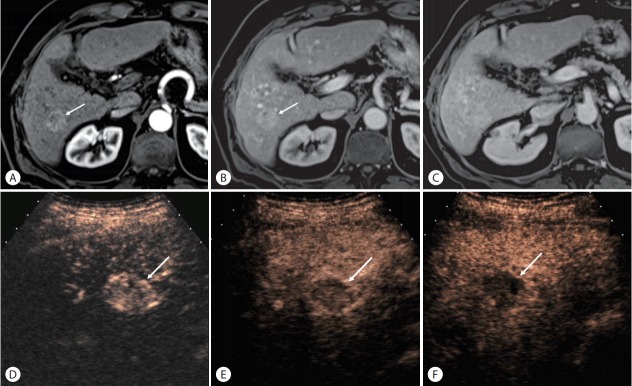
On CEUS, ICC often shows rim APHE which is uncommon in HCC. ICC consistently show marked washout of early onset, usually detectable within 1 minute after contrast injection (Fig. 7), similar to other nonhepatocellular malignant tumors [2,44,48-50]. On the other hand, HCC usually show mild and late-onset (≥60 seconds after contrast injection) washout [8,45,51-53]. Therefore, LR-M at CEUS LI-RADS is assigned when there is rim-APHE, early (<60 seconds) washout, marked washout visible within the first 2 minutes after contrast injection (Fig. 1), or any combination of the three. Histologic diagnosis by biopsy is recommended for all LR-M lesions to rule out ICC or other nonhepatocellular malignancy. Identification of even one of these three criteria is sufficient to consider LR-M classification. It should be noted that a significant proportion of LR-M lesions on CEUS are atypical HCCs rather than non-HCC malignancy.
Figure 7.
Hepatocholangiocarcinoma in a 79-year-old man with hepatis C cirrhosis. (A) There is an observation (arrow) with arterial-phase hyperenhancement on contrast-enhanced MRI in the arterial phase. (B) The observation (arrow) shows slight hyperenhancement in the portal venous phase. (C) The observation is not seen in the delayed phase due to iso-enhancement relative to the liver. (D) CEUS images obtained at 17 seconds after contrast injection shows a nodule (arrow) with arterial-phase hyperenhancement. (E) CEUS images obtained at 34 seconds after contrast injection shows washout of the nodule (arrow). (F) CEUS images obtained at 120 seconds shows marked washout (arrow). This is CEUS LR-M. Pathology at biopsy showed hepatocholangiocarcinoma with predominant cholangiocarcinoma component.
The definition of LR-M on CT/MRI LI-RADS differs from CEUS because of different properties of contrast agents as mentioned earlier. While targetoid morphology is the main CT and MR imaging feature of LR-M, other features include infiltrative appearance, marked diffusion restriction, and necrosis or severe ischemia. The enhancing capsule in CT/MRI LI-RADS should not be confused with rim APHE on CEUS LI-RADS. The enhancing capsule in CT/MRI is seen in the portal venous or delayed phase and represents a tumor capsule or fibrous pseudocapsule [54,55]. Since the capsule/ pseudocapsule is a fibrous structure with large interstitial spaces but low blood volume, it is does not enhance after administration of CEUS microbubbles.
Threshold growth is not a major feature in CEUS LI-RADS
While threshold growth (ie, >50% diameter increase in 6 months) is one of the major imaging features in CT/MRI LI-RADS, size change is considered to be of only ancillary importance in CEUS LI-RADS. This is because it is difficult to capture the same imaging plane on serial US exams especially when performed in different institutions or by different operators, and thus the evaluation of size change of liver nodules is not as reliable as CT or MRI. However, unequivocal growth at serial CEUS examinations can be used as an ancillary feature favoring malignancy, allowing the observation category to be upgraded up to LR-4. It is important to remember that ancillary features cannot be used to upgrade to LR-5 as the size growth cannot be considered specific for HCC, but rather of any suspected malignancy. Size stability for >2 years or unequivocal size reduction is an ancillary imaging feature favoring benignity, permitting the observation category to be downgraded by one category down to LR-1.
CONCLUSION
CEUS LI-RADS is a comprehensive system for standardizing the acquisition, interpretation, reporting, and data collection of CEUS examination for evaluating focal liver lesions detected in patients at high risk for HCC. The diagnostic algorithm is presented in a comprehensive table, which assigns a diagnostic category to each liver nodule based on its size and enhancement features. Users of LI-RADS should be familiar with important differences in the diagnostic table between CEUS and CT/MRI LI-RADS, reflecting dissimilarities in the image acquisition methods and contrast agent properties. Also crucial is understanding the criteria for LR-M to prevent a misdiagnosis of ICC as HCC. Large prospective studies are needed to validate the performance of CEUS LI-RADS and to inform its continued refinement, with a major multi-center study planned.
Abbreviations
- ACR
American College of Radiology
- APHE
arterial phase hyperenhancement
- CEUS
contrast-enhanced ultrasound
- HCC
Hepatocellular carcinoma
- ICC
intrahepatic cholangiocarcinoma
- LI-RADS
Liver Imaging Reporting and Data System
- US
ultrasound
Footnotes
Authors’ contribution
- Study design: All authors
- Drafting of the manuscript: Tae Kyoung Kim
- Critical revision of the manuscript for important intellectual content: All authors
Conflicts of Interest:The authors have no relevant conflicts of interest to disclose.
REFERENCES
- 1.Ferlay J, Soerjomataram I, Dikshit R, Eser S, Mathers C, Rebelo M, et al. Cancer incidence and mortality worldwide: sources, methods and major patterns in GLOBOCAN 2012. Int J Cancer. 2015;136:E359–386. doi: 10.1002/ijc.29210. [DOI] [PubMed] [Google Scholar]
- 2.Jo PC, Jang HJ, Burns PN, Burak KW, Kim TK, Wilson SR. Integration of contrast-enhanced US into a multimodality approach to imaging of nodules in a cirrhotic liver: how i do it. Radiology. 2017;282:317–331. doi: 10.1148/radiol.2016151732. [DOI] [PubMed] [Google Scholar]
- 3.Chernyak V, Santillan CS, Papadatos D, Sirlin CB. LI-RADS(R) algorithm: CT and MRI. Abdom Radiol (NY) 2017 Jul 10; doi: 10.1007/s00261-017-1228-y. [Epub ahead of print] [DOI] [PubMed] [Google Scholar]
- 4.Mitchell DG, Bruix J, Sherman M, Sirlin CB. LI-RADS (Liver Imaging Reporting and Data System): summary, discussion, and consensus of the LI-RADS management working group and future directions. Hepatology. 2015;61:1056–1065. doi: 10.1002/hep.27304. [DOI] [PubMed] [Google Scholar]
- 5.Kono Y, Lyshchik A, Cosgrove D, Dietrich CF, Jang HJ, Kim TK, et al. Contrast enhanced ultrasound (CEUS) liver imaging reporting and data system (LI-RADS(R)): the official version by the american college of radiology (ACR) Ultraschall Med. 2017;38:85–86. doi: 10.1055/s-0042-124369. [DOI] [PubMed] [Google Scholar]
- 6.Bokor D, Chambers JB, Rees PJ, Mant TG, Luzzani F, Spinazzi A. Clinical safety of SonoVue, a new contrast agent for ultrasound imaging, in healthy volunteers and in patients with chronic obstructive pulmonary disease. Invest Radiol. 2001;36:104–109. doi: 10.1097/00004424-200102000-00006. [DOI] [PubMed] [Google Scholar]
- 7.Kim TK, Jang HJ, Wilson SR. Ultrasound of hepatocellular carcinoma: the important contribution of contrast enhancement. In: Carr BI, editor. Hepatocellular carcinoma: diagnosis and treatment. Totowa, NJ: Humana Press; 2010. pp. 387–406. [Google Scholar]
- 8.Piscaglia F, Wilson SR, Lyshchik A, Cosgrove D, Dietrich CF, Jang HJ, et al. American college of radiology contrast enhanced ultrasound liver imaging reporting and data system (CEUS LI-RADS) for the diagnosis of hepatocellular carcinoma: a pictorial essay. Ultraschall Med. 2017;38:320–324. doi: 10.1055/s-0042-124661. [DOI] [PubMed] [Google Scholar]
- 9.Piscaglia F, Kudo M, Han KH, Sirlin C. Diagnosis of hepatocellular carcinoma with non-invasive imaging: a plea for worldwide adoption of standard and precise terminology for describing enhancement criteria. Ultraschall Med. 2017;38:9–11. doi: 10.1055/s-0042-124204. [DOI] [PubMed] [Google Scholar]
- 10.Raza SA, Jang HJ, Kim TK. Differentiating malignant from benign thrombosis in hepatocellular carcinoma: contrast-enhanced ultrasound. Abdom Imaging. 2014;39:153–161. doi: 10.1007/s00261-013-0034-4. [DOI] [PubMed] [Google Scholar]
- 11.Wilson SR, Kim TK, Jang HJ, Burns PN. Enhancement patterns of focal liver masses: discordance between contrast-enhanced sonography and contrast-enhanced CT and MRI. AJR Am J Roentgenol. 2007;189:W7–W12. doi: 10.2214/AJR.06.1060. [DOI] [PubMed] [Google Scholar]
- 12.Maruyama H, Takahashi M, Ishibashi H, Yoshikawa M, Yokosuka O. Contrast-enhanced ultrasound for characterisation of hepatic lesions appearing non-hypervascular on CT in chronic liver diseases. Br J Radiol. 2012;85:351–357. doi: 10.1259/bjr/20440141. [DOI] [PMC free article] [PubMed] [Google Scholar]
- 13.Takahashi M, Maruyama H, Shimada T, Kamezaki H, Sekimoto T, Kanai F, et al. Characterization of hepatic lesions (</= 30 mm) with liver-specific contrast agents: a comparison between ultrasound and magnetic resonance imaging. Eur J Radiol. 2013;82:75–84. doi: 10.1016/j.ejrad.2012.05.035. [DOI] [PubMed] [Google Scholar]
- 14.Vilgrain V, Boulos L, Vullierme MP, Denys A, Terris B, Menu Y. Imaging of atypical hemangiomas of the liver with pathologic correlation. Radiographics. 2000;20:379–397. doi: 10.1148/radiographics.20.2.g00mc01379. [DOI] [PubMed] [Google Scholar]
- 15.Kim TK, Jang HJ. Contrast-enhanced ultrasound in the diagnosis of nodules in liver cirrhosis. World J Gastroenterol. 2014;20:3590–3596. doi: 10.3748/wjg.v20.i13.3590. [DOI] [PMC free article] [PubMed] [Google Scholar]
- 16.Dietrich CF, Mertens JC, Braden B, Schuessler G, Ott M, Ignee A. Contrast-enhanced ultrasound of histologically proven liver hemangiomas. Hepatology. 2007;45:1139–1145. doi: 10.1002/hep.21615. [DOI] [PubMed] [Google Scholar]
- 17.Kim TK, Jang HJ, Wilson SR. Benign liver masses: imaging with microbubble contrast agents. Ultrasound Q. 2006;22:31–39. [PubMed] [Google Scholar]
- 18.Itai Y, Furui S, Ohtomo K, Kokubo T, Yamauchi T, Minami M, et al. Dynamic CT features of arterioportal shunts in hepatocellular carcinoma. AJR Am J Roentgenol. 1986;146:723–727. doi: 10.2214/ajr.146.4.723. [DOI] [PubMed] [Google Scholar]
- 19.Ito K, Honjo K, Fujita T, Awaya H, Matsumoto T, Matsunaga N. Hepatic parenchymal hyperperfusion abnormalities detected with multisection dynamic MR imaging: appearance and interpretation. J Magn Reson Imaging. 1996;6:861–867. doi: 10.1002/jmri.1880060604. [DOI] [PubMed] [Google Scholar]
- 20.Yu JS, Kim KW, Jeong MG, Lee JT, Yoo HS. Nontumorous hepatic arterial-portal venous shunts: MR imaging findings. Radiology. 2000;217:750–756. doi: 10.1148/radiology.217.3.r00dc13750. [DOI] [PubMed] [Google Scholar]
- 21.Kim TK, Choi BI, Han JK, Chung JW, Park JH, Han MC. Nontumorous arterioportal shunt mimicking hypervascular tumor in cirrhotic liver: two-phase spiral CT findings. Radiology. 1998;208:597–603. doi: 10.1148/radiology.208.3.9722834. [DOI] [PubMed] [Google Scholar]
- 22.O’Malley ME, Takayama Y, Sherman M. Outcome of small (10-20 mm) arterial phase-enhancing nodules seen on triphasic liver CT in patients with cirrhosis or chronic liver disease. Am J Gastroenterol. 2005;100:1523–1528. doi: 10.1111/j.1572-0241.2005.41814.x. [DOI] [PubMed] [Google Scholar]
- 23.Holland AE, Hecht EM, Hahn WY, Kim DC, Babb JS, Lee VS, et al. Importance of small (< or = 20-mm) enhancing lesions seen only during the hepatic arterial phase at MR imaging of the cirrhotic liver: evaluation and comparison with whole explanted liver. Radiology. 2005;237:938–944. doi: 10.1148/radiol.2373041364. [DOI] [PubMed] [Google Scholar]
- 24.Shimizu A, Ito K, Koike S, Fujita T, Shimizu K, Matsunaga N. Cirrhosis or chronic hepatitis: evaluation of small (<or=2-cm) earlyenhancing hepatic lesions with serial contrast-enhanced dynamic MR imaging. Radiology. 2003;226:550–555. doi: 10.1148/radiol.2262011967. [DOI] [PubMed] [Google Scholar]
- 25.Jeong YY, Mitchell DG, Kamishima T. Small (<20 mm) enhancing hepatic nodules seen on arterial phase MR imaging of the cirrhotic liver: clinical implications. AJR Am J Roentgenol. 2002;178:1327–1334. doi: 10.2214/ajr.178.6.1781327. [DOI] [PubMed] [Google Scholar]
- 26.Jang HJ, Kim TK, Wilson SR. Small nodules (1-2 cm) in liver cirrhosis: characterization with contrast-enhanced ultrasound. Eur J Radiol. 2009;72:418–424. doi: 10.1016/j.ejrad.2008.08.011. [DOI] [PubMed] [Google Scholar]
- 27.Leoni S, Piscaglia F, Granito A, Borghi A, Galassi M, Marinelli S, et al. Characterization of primary and recurrent nodules in liver cirrhosis using contrast-enhanced ultrasound: which vascular criteria should be adopted? Ultraschall Med. 2013;34:280–287. doi: 10.1055/s-0033-1335024. [DOI] [PubMed] [Google Scholar]
- 28.Jang HJ, Kim TK, Burns PN, Wilson SR. Enhancement patterns of hepatocellular carcinoma at contrast-enhanced US: comparison with histologic differentiation. Radiology. 2007;244:898–906. doi: 10.1148/radiol.2443061520. [DOI] [PubMed] [Google Scholar]
- 29.El-Serag HB, Engels EA, Landgren O, Chiao E, Henderson L, Amaratunge HC, et al. Risk of hepatobiliary and pancreatic cancers after hepatitis C virus infection: A population-based study of U.S. veterans. Hepatology. 2009;49:116–123. doi: 10.1002/hep.22606. [DOI] [PMC free article] [PubMed] [Google Scholar]
- 30.Yamamoto S, Kubo S, Hai S, Uenishi T, Yamamoto T, Shuto T, et al. Hepatitis C virus infection as a likely etiology of intrahepatic cholangiocarcinoma. Cancer Sci. 2004;95:592–595. doi: 10.1111/j.1349-7006.2004.tb02492.x. [DOI] [PMC free article] [PubMed] [Google Scholar]
- 31.Rimola J, Forner A, Reig M, Vilana R, de Lope CR, Ayuso C, et al. Cholangiocarcinoma in cirrhosis: absence of contrast washout in delayed phases by magnetic resonance imaging avoids misdiagnosis of hepatocellular carcinoma. Hepatology. 2009;50:791–798. doi: 10.1002/hep.23071. [DOI] [PubMed] [Google Scholar]
- 32.Vilana R, Forner A, Bianchi L, García-Criado A, Rimola J, de Lope CR, et al. Intrahepatic peripheral cholangiocarcinoma in cirrhosis patients may display a vascular pattern similar to hepatocellular carcinoma on contrast-enhanced ultrasound. Hepatology. 2010;51:2020–2029. doi: 10.1002/hep.23600. [DOI] [PubMed] [Google Scholar]
- 33.Loyer EM, Chin H, DuBrow RA, David CL, Eftekhari F, Charnsangavej C. Hepatocellular carcinoma and intrahepatic peripheral cholangiocarcinoma: enhancement patterns with quadruple phase helical CT--a comparative study. Radiology. 1999;212:866–875. doi: 10.1148/radiology.212.3.r99se32866. [DOI] [PubMed] [Google Scholar]
- 34.Kim SJ, Lee JM, Han JK, Kim KH, Lee JY, Choi BI. Peripheral massforming cholangiocarcinoma in cirrhotic liver. AJR Am J Roentgenol. 2007;189:1428–1434. doi: 10.2214/AJR.07.2484. [DOI] [PubMed] [Google Scholar]
- 35.Iavarone M, Piscaglia F, Vavassori S, Galassi M, Sangiovanni A, Venerandi L, et al. Contrast enhanced CT-scan to diagnose intrahepatic cholangiocarcinoma in patients with cirrhosis. J Hepatol. 2013;58:1188–1193. doi: 10.1016/j.jhep.2013.02.013. [DOI] [PubMed] [Google Scholar]
- 36.Gardeur D, Lautrou J, Millard JC, Berger N, Metzger J. Pharmacokinetics of contrast media: experimental results in dog and man with CT implications. J Comput Assist Tomogr. 1980;4:178–185. [PubMed] [Google Scholar]
- 37.Donahue KM, Burstein D, Manning WJ, Gray ML. Studies of Gd-DTPA relaxivity and proton exchange rates in tissue. Magn Reson Med. 1994;32:66–76. doi: 10.1002/mrm.1910320110. [DOI] [PubMed] [Google Scholar]
- 38.Miles KA, Charnsangavej C, Lee FT, Fishman EK, Horton K, Lee TY. Application of CT in the investigation of angiogenesis in oncology. Acad Radiol. 2000;7:840–850. doi: 10.1016/s1076-6332(00)80632-7. [DOI] [PubMed] [Google Scholar]
- 39.Jain R. Vascular and interstitial physiology of tumours: role in cancer detection and treatment. In: Bicknell R LC, Ferrara N, editors. Tumour angiogenesis. UK: Oxford University Press; 1997. pp. 45–59. [Google Scholar]
- 40.Han J, Liu Y, Han F, Li Q, Yan C, Zheng W, et al. The degree of xontrast washout on contrast-enhanced ultrasound in distinguishing intrahepatic cholangiocarcinoma from hepatocellular carcinoma. Ultrasound Med Biol. 2015;41:3088–3095. doi: 10.1016/j.ultrasmedbio.2015.08.001. [DOI] [PubMed] [Google Scholar]
- 41.Claudon M, Cosgrove D, Albrecht T, Bolondi L, Bosio M, Calliada F, et al. Guidelines and good clinical practice recommendations for contrast enhanced ultrasound (CEUS) - update 2008. Ultraschall Med. 2008;29:28–44. doi: 10.1055/s-2007-963785. [DOI] [PubMed] [Google Scholar]
- 42.Xu HX, Lu MD, Liu GJ, Xie XY, Xu ZF, Zheng YL, et al. Imaging of peripheral cholangiocarcinoma with low-mechanical index contrastenhanced sonography and SonoVue: initial experience. J Ultrasound Med. 2006;25:23–33. doi: 10.7863/jum.2006.25.1.23. [DOI] [PubMed] [Google Scholar]
- 43.Li C, Wang W, Ding H, Huang B, Cao J, Mao F, et al. Value of contrast-enhanced sonography in the diagnosis of peripheral intrahepatic cholangiocarcinoma. J Clin Ultrasound. 2011;39:447–453. doi: 10.1002/jcu.20797. [DOI] [PubMed] [Google Scholar]
- 44.Wildner D, Bernatik T, Greis C, Seitz K, Neurath MF, Strobel D. CEUS in hepatocellular carcinoma and intrahepatic cholangiocellular carcinoma in 320 patients - early or late washout matters: a subanalysis of the DEGUM multicenter trial. Ultraschall Med. 2015;36:132–139. doi: 10.1055/s-0034-1399147. [DOI] [PubMed] [Google Scholar]
- 45.Wildner D, Pfeifer L, Goertz RS, Bernatik T, Sturm J, Neurath MF, et al. Dynamic contrast-enhanced ultrasound (DCE-US) for the characterization of hepatocellular carcinoma and cholangiocellular carcinoma. Ultraschall Med. 2014;35:522–527. doi: 10.1055/s-0034-1385170. [DOI] [PubMed] [Google Scholar]
- 46.Bhayana D, Kim TK, Jang HJ, Burns PN, Wilson SR. Hypervascular liver masses on contrast-enhanced ultrasound: the importance of washout. AJR Am J Roentgenol. 2010;194:977–983. doi: 10.2214/AJR.09.3375. [DOI] [PubMed] [Google Scholar]
- 47.Claudon M, Dietrich CF, Choi BI, Cosgrove DO, Kudo M, Nolsoe CP, et al. Guidelines and good clinical practice recommendations for contrast enhanced ultrasound (CEUS) in the liver--update 2012: a WFUMB-EFSUMB initiative in cooperation with representatives of AFSUMB, AIUM, ASUM, FLAUS and ICUS. Ultraschall Med. 2013;34:11–29. doi: 10.1055/s-0032-1325499. [DOI] [PubMed] [Google Scholar]
- 48.Chen LD, Xu HX, Xie XY, Xie XH, Xu ZF, Liu GJ, et al. Intrahepatic cholangiocarcinoma and hepatocellular carcinoma: differential diagnosis with contrast-enhanced ultrasound. Eur Radiol. 2010;20:743–753. doi: 10.1007/s00330-009-1599-8. [DOI] [PubMed] [Google Scholar]
- 49.Dietrich CF, Cui XW, Boozari B, Hocke M, Ignee A. Contrastenhanced ultrasound (CEUS) in the diagnostic algorithm of hepatocellular and cholangiocellular carcinoma, comments on the AASLD guidelines. Ultraschall Med. 2012;33(Suppl 1):S57–66. doi: 10.1055/s-0032-1312903. [DOI] [PubMed] [Google Scholar]
- 50.Li R, Yuan MX, Ma KS, Li XW, Tang CL, Zhang XH, et al. Detailed analysis of temporal features on contrast enhanced ultrasound may help differentiate intrahepatic cholangiocarcinoma from hepatocellular carcinoma in cirrhosis. PLoS One. 2014;9:e98612. doi: 10.1371/journal.pone.0098612. [DOI] [PMC free article] [PubMed] [Google Scholar]
- 51.de Sio I, Iadevaia MD, Vitale LM, Niosi M, Del Prete A, de Sio C, et al. Optimized contrast-enhanced ultrasonography for characterization of focal liver lesions in cirrhosis: A single-center retrospective study. United European Gastroenterol J. 2014;2:279–287. doi: 10.1177/2050640614538964. [DOI] [PMC free article] [PubMed] [Google Scholar]
- 52.Yuan MX, Li R, Zhang XH, Tang CL, Guo YL, Guo DY, et al. Factors Affecting the Enhancement Patterns of Intrahepatic Cholangiocarcinoma (ICC) on Contrast-Enhanced Ultrasound (CEUS) and their Pathological Correlations in Patients with a Single Lesion. Ultraschall Med. 2016;37:609–618. doi: 10.1055/s-0034-1399485. [DOI] [PubMed] [Google Scholar]
- 53.Boozari B, Soudah B, Rifai K, Schneidewind S, Vogel A, Hecker H, et al. Grading of hypervascular hepatocellular carcinoma using late phase of contrast enhanced sonography - a prospective study. Dig Liver Dis. 2011;43:484–490. doi: 10.1016/j.dld.2011.01.001. [DOI] [PubMed] [Google Scholar]
- 54.Ishigami K, Yoshimitsu K, Nishihara Y, Irie H, Asayama Y, Tajima T, et al. Hepatocellular carcinoma with a pseudocapsule on gadoliniumenhanced MR images: correlation with histopathologic findings. Radiology. 2009;250:435–443. doi: 10.1148/radiol.2501071702. [DOI] [PubMed] [Google Scholar]
- 55.Chung YE, Park MS, Park YN, Lee HJ, Seok JY, Yu JS, et al. Hepatocellular carcinoma variants: radiologic-pathologic correlation. AJR Am J Roentgenol. 2009;193:W7–13. doi: 10.2214/AJR.07.3947. [DOI] [PubMed] [Google Scholar]


