Abstract
Previous research on slip and fall accidents has suggested that pressurized fluid between the shoe and floor is responsible for initiating slips yet this effect has not been verified experimentally. This study aimed to 1) measure hydrodynamic pressures during slipping for treaded and untreaded conditions; 2) determine the effects of fluid pressure on slip severity; and 3) quantify how fluid pressures vary with instantaneous resultant slipping speed, position on the shoe surface, and throughout the progression of the slip. Eighteen subjects walked on known dry and unexpected slippery floors, while wearing treaded and untreaded shoes. Fluid pressure sensors, embedded in the floor, recorded hydrodynamic pressures during slipping. The maximum fluid pressures (mean+/−standard deviation) were significantly higher for the untreaded conditions (124 +/−75 kPa) than the treaded conditions (1.1 +/−0.29 kPa). Maximum fluid pressures were positively correlated with peak slipping speed (r = 0.87), suggesting that higher fluid pressures, which are associated with untreaded conditions, resulted in more severe slips. Instantaneous resultant slipping speed and position of sensor relative to the shoe sole and walking direction explained 41% of the fluid pressure variability. Fluid pressures were primarily observed for untreaded conditions. This study confirms that fluid pressures are relevant to slipping events, consistent with fluid dynamics theory (i.e. the Reynolds equation), and can be modified with shoe tread design. The results suggest that the occurrence and severity of unexpected slips can be reduced by designing shoes/floors that reduce underfoot fluid pressures.
Keywords: Slip and Fall Accidents, Fluid Pressures, Reynolds equation, Shoe tread
Introduction
Falling accidents account for 25% of non-fatal occupational accidents (U.S. Department of Labor- Bureau of Labor Statistics, 2012b), 14% of fatal occupational accidents (U.S. Department of Labor- Bureau of Labor Statistics, 2012a) and are the fastest growing source of worker’s compensations claims (Liberty Mutual Research Institute, 2012). Slipping is the most common event leading to a fall (Courtney et al., 2001). A slip is initiated when the friction between the shoe and floor surface is insufficient to support the friction required for gait (commonly termed the required coefficient of friction) (Burnfield and Powers, 2006, Hanson et al., 1999). Footwear and tread has been identified as a risk factor for slipping in occupational settings (Bentley, 1998, Bentley and Haslam, 2001, Haslam and Bentley, 1999).
The available friction between the shoe and flooring are affected by several different factors including the shoe design (material and tread pattern) (Grönqvist, 1995, Li and Chen, 2004, Li et al., 2006b, Strobel et al., 2012, Redfern and Bidanda, 1994), the flooring design (material properties, roughness, waviness) (Chang et al., 2004, Chang et al., 2001b, Strobel et al., 2012, Redfern and Bidanda, 1994) and a liquid contaminant separating the surface (Beschorner et al., 2009, Beschorner et al., 2007, Chang et al., 2001a, Moore et al., 2012, Strobel et al., 2012). Tribological theory suggests two different lubrication mechanisms contributing to slipping events: boundary lubrication (Moore et al., 2012, Strobel et al., 2012) and hydrodynamic lubrication (Beschorner et al., 2009, Beschorner et al., 2007, Chang et al., 2001a, Proctor and Coleman, 1988, Strandberg, 1985). In boundary lubrication, a fluid disrupts adhesion between a shoe and floor surface but does not affect the hysteresis between the surfaces (Strobel et al., 2012). In the presence of hydrodynamic effects (which occurs in the mixed, elastohydrodynamic and hydrodynamic lubrication regimes), fluid beneath the shoe-floor surface becomes pressurized and causes the shoe and floor surface to separate (Beschorner et al., 2009). This separation reduces interaction between the surfaces and can reduce the available friction to nearly zero (Singh and Beschorner, 2013). The Reynolds equation is the primary constitutive equation of the fluid pressures across the shoe-floor interface (Eq. 1) and describes the interactions between the variables: film thickness between the two surfaces, h, the fluid pressures, p, viscosity, η, entrainment velocities, vx and vy and squeeze of the surfaces, vz (Hamrock et al., 2004). When applying the Reynolds equation to slipping, vx is the shoe velocity towards the right side and vy is the anterior shoe velocity. The form of Reynolds equation presented in equation 1 assumes that the floor is not moving, density of the fluid is constant and that the stretching of the shoe or floor surface is insignificant. The two main contributing factors to fluid pressures are the wedge effect (Proctor and Coleman, 1988) and the squeeze film effect (Strandberg, 1985). The wedge effect describes the dependence of fluid pressures on the sliding velocity (vx and vy) and fluid viscosity (η), while the squeeze-film effect describes a reduction in fluid pressures over time. Previous modeling studies have shown that hydrodynamic pressures are typically centrally located near the trailing edge of the shoe surface (Beschorner et al., 2009). While hydrodynamic pressures, the wedge effect and the squeeze film effect have been suggested to contribute to slips with tribological theory and models, their presence has not yet been experimentally confirmed during real slip events.
| Eq. (1) |
Shoe tread is intended to prevent the build-up of hydrodynamic pressures by providing channels that allow the fluid to escape from between the shoe-floor interface (Strandberg, 1985, Tisserand, 1985). Experimentally, increased tread width (Li and Chen, 2004) and tread depth (Li et al., 2006a) have been associated with higher available friction values. Other experimental studies, however, have found inconsistent relationships between shoe tread depth and available coefficient of friction (Blanchette and Powers, 2012). Previous work by our research group has revealed that untreaded shoes are associated with high hydrodynamic pressures and low coefficient of friction values (Singh and Beschorner, 2013). The effects of shoe tread on hydrodynamic pressures during human slipping and slip outcomes during real slipping events is still not well understood.
The purpose of this study was to observe hydrodynamic pressures during slipping and to determine how fluid pressures affect the severity of a slip. The impact of the presence versus absence of tread on this relationship also was investigated. Correlations between fluid pressures and the instantaneous sliding speed, medial-lateral position on the shoe and position of the sensors relative to the walking direction were compared with the expected trends based on tribological theory.
Methods
Eighteen subjects between the ages of 20 and 33 years old were recruited to participate in the study (10 female, mean ± standard deviation: age 23.5 ± 4.0 years, height 1.71 ± 0.072m, weight 70.0 ± 11.8 kg), which was approved by the University of Pittsburgh Institutional Review Board. Only healthy subjects without significant musculoskeletal or neurological disorders were included. All subjects provided informed consent prior to data collection.
Participants performed two sets of walking trials, both of which concluded with an unexpected slip. Participants wore fully treaded shoes during one slip and untreaded shoes during the other slip. The shoes were made of a rubber compound (Shore A Hardness: 58) and were advertised as being slip-resistant (Figure 1). The treaded shoes had a tread depth of 2.4 mm, a tread width of 5 mm and a tread channel width of 2.4 mm, while the untreaded shoes had the tread completely removed from the shoe sole (Figure 1). An abrasion process was used to remove the tread using 80 grit sand paper similar to standard testing methods for shoe wear (International Standards Organization, 2012). The order in which the shoes were introduced was randomized. Slips were induced with a 90%:10% glycerol:water solution (viscosity: 219 cP) that was spread evenly across a 610×610mm floor surface. Prior to each slip, participants performed 5–8 baseline dry trials. During the baseline dry trials, the participants’ starting position was adjusted so that their heel hit directly behind an array of fluid pressure sensors. Participants listened to music and faced the wall between each trial to reduce their awareness that a fluid contaminant had been placed on the floor, similar to previous studies that have achieved unexpected slips (Beschorner et al., 2013, Chambers and Cham, 2007, Moyer et al., 2009, Moyer et al., 2006). The lights were dimmed to obscure the condition of the floor. Subjects were made aware during the informed consent process that they might experience a slippery floor at some point but were not informed of the location, nature or timing of the slippery surface. Subjects’ pressure data were analyzed only if they either stepped directly on the fluid pressure sensor array or if they slipped across the array. A subject was considered to have stepped or slid on a fluid pressure sensor if a marker placed on the subject’s heel passed within the boundaries of the sensor array during the slip. The heel marker was used instead of other foot markers because previous studies have indicated that the foot is inclined at the start of an unexpected slip and that the heel portion of the shoe is in contact with the floor throughout the slip (Cham and Redfern, 2002b, Cham and Redfern, 2002a). Eleven of eighteen slips with untreaded shoes and six of eighteen slips with treaded shoes met these qualifications and were included in the analysis. Peak slipping speed was only calculated when the subject stepped cleanly on the glycerol-covered area.
Figure 1.
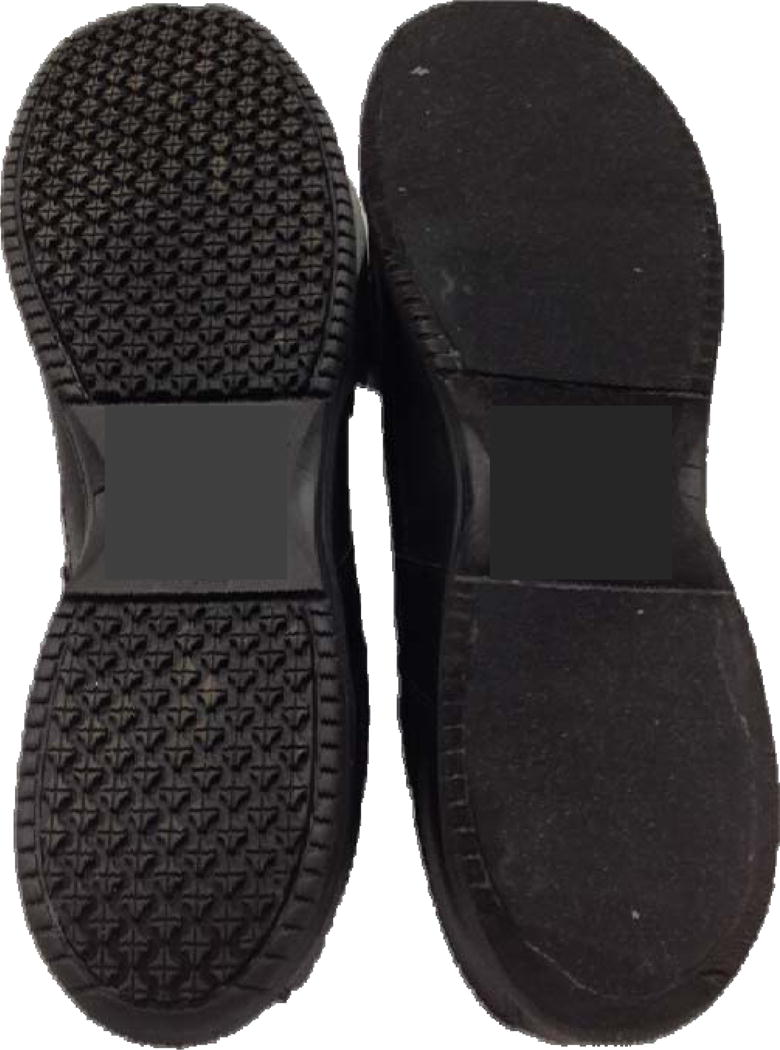
Picture of the fully treaded shoes (left) and the untreaded shoes that had the tread fully removed (right).
The instrumentation included an array of fluid pressure sensors and a reflective marker placed posteriorly and inferiorly on the heel. A 3×3 array of fluid pressure sensors were embedded beneath the floor surface to measure hydrodynamic pressures as the participants slipped across the floor surface (Figure 2). The fluid pressure sensors were spaced 30 mm apart from each other in both directions. The pressure sensors (Gems ® 3100-R-150PG-08-F-X-3) had an inlet diameter of 4 mm, accuracy of 2.5 kPa and range of 1000 kPa. When the fluid contaminant was applied to the floor, the inlet of each pressure sensor was filled completely with fluid to ensure continuous fluid from the transducer to the top of the floor surface. Similar methods have been used to evaluate shoes using a slip-tester (Singh and Beschorner, 2013) and in evaluating the tribology of chemical mechanical polishing (Shan et al., 2000). A marker was place on the inferior portion of the heel in order to track the slipping kinematics. Marker position was tracked with a 14 camera motion capture system (Vicon MX). The system was calibrated to achieve an accuracy of within 1mm.
Figure 2.
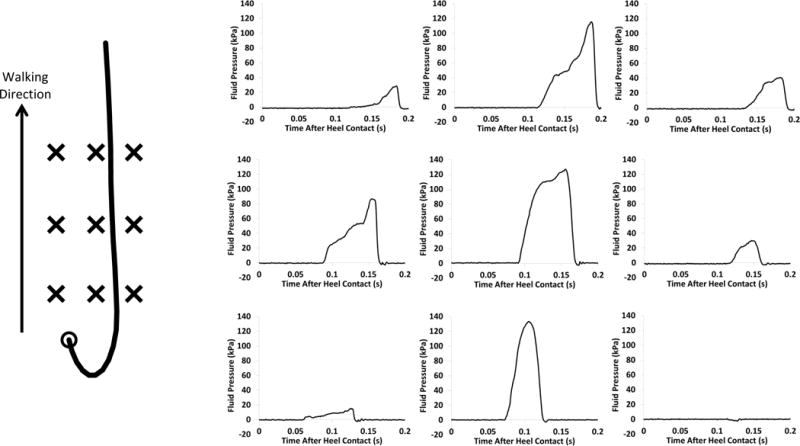
Representative heel trajectory (left) and time-series fluid pressures (right) during a single subject’s unexpected slip with untreaded shoes. The thick solid line represents the heel trajectory, the circle is the location of the heel at heel contact and each of the fluid pressure sensors is marked with an X. The fluid pressure graphs are positioned according to their location in the pressure sensor array (i.e., the top left graph corresponds to the top left sensor).
The fluid pressures were characterized using the magnitude of the fluid pressures and the duration in which the pressures exceeded baseline levels. Fluid pressures were typically characterized by a single peak (Figure 2) and the maximum of that peak was identified. Fluid pressure duration was defined as the time between the first and last moment that fluid pressures exceeded 5 standard deviations of baseline levels. Typical baseline standard deviation pressures were around 0.24 kPa. The severity of the slip was characterized using peak slipping speed (PSS), which was defined as the peak resultant speed during the slip (Moyer et al., 2006). In order to accomplish the secondary objective of determining the effects of the instantaneous slipping speed and the medial/lateral position relative to the shoe, the spatiotemporal variables of the foot relative to each individual fluid sensor were calculated. The instantaneous resultant slipping speed (IRSS) was calculated at the time that the heel passed each of the fluid pressure sensors. IRSS was used for this analysis instead of the peak sliding speed because IRSS relates to the state of the shoe when the heel was over the sensor and is therefore more relevant to how shoe kinematics influence the fluid pressures observed in a given sensor. The medial-lateral distance between the heel marker and the fluid pressure sensor was also calculated at the time when the heel marker passed by the pressure sensor in the anterior-posterior direction to determine if hydrodynamic pressures varied across the shoe surface. In addition to IRSS and the medial-lateral position, the sensor position relative to walking direction (SPRWD) was analyzed to determine how fluid pressures varied as the slip progressed. SPRWD was an ordinal variable with three different levels based on their location relative to the direction of walking (i.e., the foot slipped over the first row, second row and third row of sensors sequentially).
ANOVA methods were used to test the effects of shoe tread on fluid pressures and peak slipping speed (PSS) as well as to determine the effects of the instantaneous resultant slipping speed (IRSS), medial-lateral position and sensor position relative to walking direction (SPRWD) on fluid pressures. The fluid pressures were characterized using the peak pressure across the entire fluid pressure sensor array and the pressure duration time. Differences in the peak fluid pressure, fluid pressure distance and peak slipping speed (PSS) across the two tread conditions were analyzed using a t-test. A regression analysis was performed between PSS and maximum hydrodynamic pressures across all of the sensors to determine if fluid pressures were predictive of the slip severity. An ANOVA procedure was performed to determine the effects of foot position, IRSS and SPRWD on peak hydrodynamic pressures for each individual sensor. Peak hydrodynamic pressure for each fluid sensor was the dependent variable; while IRSS (continuous), medial-lateral distance from the heel to the pressure sensor (continuous) and the sensor’s anterior/posterior position in the array (ordinal) as the independent variables.
Results
The subjects’ heel landed on or slipped across the fluid pressure sensors in eleven of the untreaded conditions (61%) and six of the treaded conditions (33%). Maximum fluid pressures (p<0.01) and peak slip velocities (p<0.01) were higher in the untreaded condition compared with the treaded condition. The mean (standard deviation) maximum fluid pressures across all of the sensors were 124 kPa (75 kPa) for the untreaded shoe condition and 1.1 kPa (0.29 kPa) for the treaded shoes. In the trials where subjects cleanly hit the contaminant, peak slipping speeds were 2.03 m/s (1.09 m/s) for untreaded shoes and 0.08 m/s (0.02 m/s) for treaded shoes. In the trials where subjects slipped over the fluid pressure sensors, peak slipping speeds (PSS) were 1.57 m/s (0.80 m/s) for the untreaded shoes and 0.063 (0.017 m/s) for the treaded shoes. PSS was significantly positively correlated with the maximum fluid pressure measurements (r=.87) (Figure 3).
Figure 3.
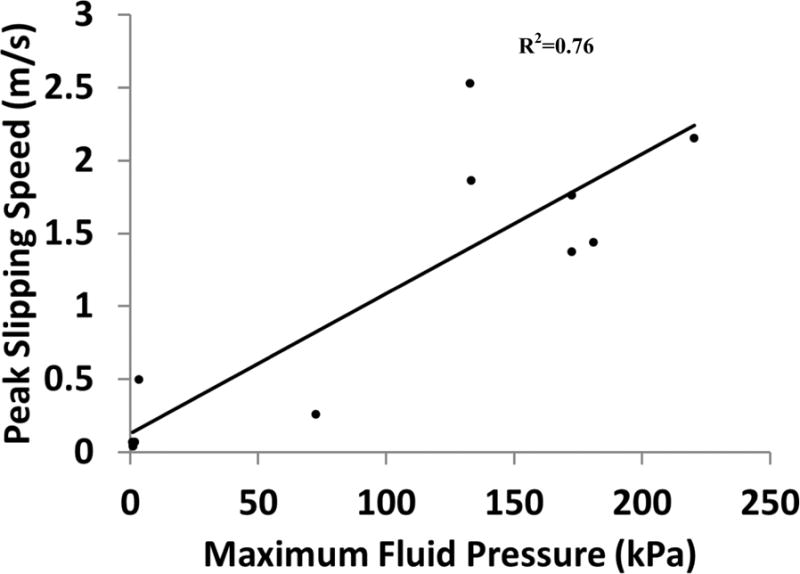
Peak slipping speed for each subject plotted against the peak hydrodynamic fluid pressures.
The effects of the sensor position relative to walking direction (SPRWD), medial-lateral position and instantaneous resultant slipping speed (IRSS) on fluid pressures were only analyzed using the untreaded conditions since fluid pressures exceeded baseline levels for just one of the treaded condition trials. The peak fluid pressures for the individual pressure sensors were dependent on the SPRWD (p<0.01), on the IRSS (p<0.001) during slipping, and the medial-lateral distance (p<0.001) of the sensor relative to the heel (Figure 4). Fluid pressures were highest at the first row of sensors and progressively decreased for the second and third row (Figure 4C). IRSS was positively correlated with fluid pressures (Figure 4A). Fluid pressures were highest at the center of the heel and decreased toward the sides of the heel (Figure 4B). The mean (standard deviation) pressure duration was 75 ms (50 ms) and was not significantly affected by any of the examined variables.
Figure 4.
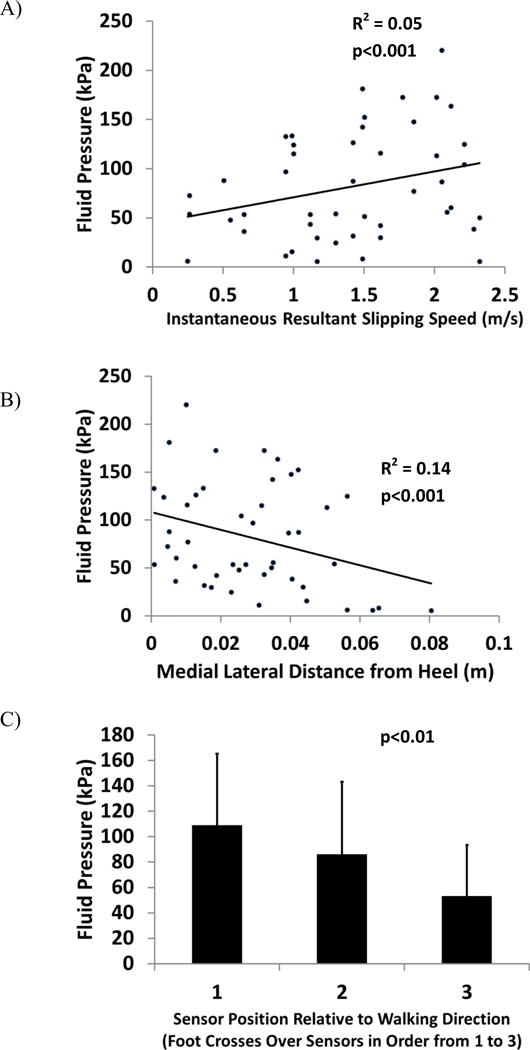
Effects of instantaneous resultant slipping speed (A), medial-lateral position of the sensor relative to the heel (B) and the sensor position relative to walking direction (C) on the peak fluid pressure for each individual sensor.
IRSS, the medial-lateral distance between the heel and the sensor, and the SPRWD seemed to all contribute independently to the overall fluid pressure values (Table 1). When regressed by themselves, each of the variables was only able to describe between 5% and 14% of the total variability. When two of the three variables were considered, between 20% and 26% of the variability was described. When all three variables were included in the regression analysis, 41% of the variability was described.
Table 1.
Adjusted R2 values to describe the amount of fluid pressure variability that was described by sensor position relative to walking distance (SPRWD), medial-lateral distance (ML Distance) and instantaneous resultant slipping speed (IRSS).
| Variables | R2 |
|---|---|
|
| |
| SPRWD | 0.11 |
| ML Distance | 0.14 |
| IRSS | 0.05 |
| SPRWD & ML Distance | 0.24 |
| SPRWD & IRSS | 0.20 |
| ML Distance & IRSS | 0.26 |
| SPRWD, ML Distance & IRSS | 0.41 |
Discussion
The primary finding in this study was the dramatic effect tread had on the reduction of hydrodynamic pressures during a slip. This effect, in turn, was shown to significantly reduce the slip severity (Figure 3). It was also found that hydrodynamic pressures were affected by the instantaneous resultant slipping speed (IRSS) (Figure 4A), the medial-lateral location relative to the heel (Figure 4B) and were reduced later in the slip (Figure 4C). Finally, the results were consistent with tribology theory, particularly the wedge and squeeze film effects of the Reynolds equation.
The findings are consistent with fundamental tribological theory, and suggest the existence of wedge and squeeze-film effects during slipping (Figure 5). The correlations found between fluid pressures and slipping speed, fluid pressure positioning relative to the walking direction and medial/lateral position are also consistent with this view. The squeeze film effect is influenced by dwell time, fluid viscosity, distance from the center of the shoe, while the wedge effect is influenced by fluid viscosity, distance from the center of the shoe and and slipping speed (Hamrock et al., 2004) (Figure 5). For example, increased slipping speed is known to increase fluid pressures (Beschorner et al., 2009) and decrease available friction due to the wedge term effect (Beschorner et al., 2009, Beschorner et al., 2007, Proctor and Coleman, 1988). The positive correlation identified between peak fluid pressure and IRSS (Figure 4A) indicates that the increased slipping speed causes an increase in hydrodynamic pressures during real slip events, again predicted by the wedge term. The wedge term effect acts as a positive feedback system where IRSS leads to higher fluid pressures (Figure 4A); those higher fluid pressures reduce the available friction; and the resulting lower friction values allow the foot to accelerate, which could lead to further increases in the instantaneous slipping speed and eventually a higher peak slipping speed (Figure 3). The reduction in hydrodynamic pressures as the heel slips across the fluid pressure sensor array indicates that squeeze-film effects are also present during human slipping events. According to squeeze film theory, the lubricating ability of the fluid decreases over time (Hamrock et al., 2004). Fluid pressures were reduced by approximately 50% when the foot reached the third row of sensors compared with the first row of sensors (Figure 4C). This reduction in fluid pressures during the progression of the slip indicates that dwell time had a decreasing effect. The finding that fluid pressures are largest near the center of the shoe and decrease towards the edges is consistent with previous studies that modeled the wedge effect (Beschorner, 2009). Up to 41% of the variability in fluid pressures was described when including all three of these effects, indicating that fluid pressure has a dependence on location, time and IRSS (Table 1). Lastly, this study confirmed that the drainage channels provided by tread are capable of reducing hydrodynamic effects, which is consistent with a previous study by our group that showed this effect using a mechanical slip-tester (Singh and Beschorner, 2013). For the conditions tested in this study, 2.5 mm of tread was sufficient for eliminating fluid pressure and reducing the severity of slips. Because only two tread depths were tested in this experiment, additional experiments would be needed to identify the minimum amount of tread that is required to prevent under-shoe fluid pressures.
Figure 5.
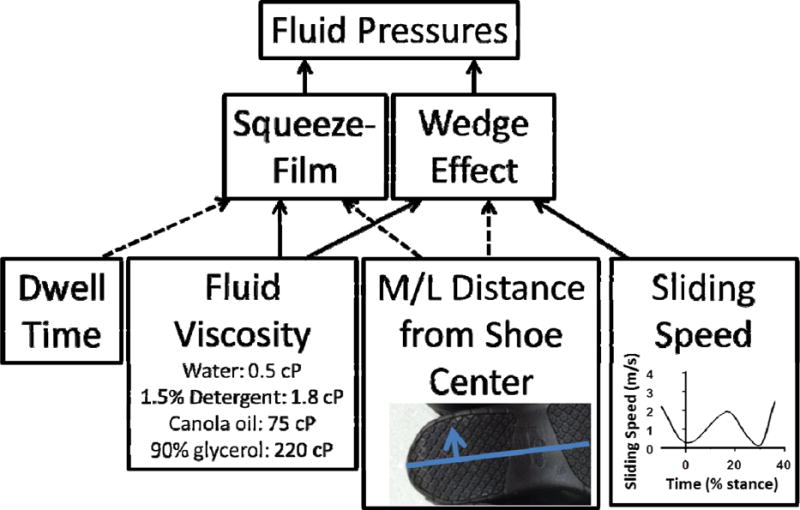
Conceptual model for the effects of dwell time, fluid viscosity, medial/lateral (M/L) distance from the center of the shoe and sliding speed on the wedge and squeeze-film effects of the Reynolds equation (Hamrock et al., 2004). Solid lines represent factors that would increase fluid pressures while dashed lines represent factors that would decrease fluid pressures. Viscosity values from water, detergent, canola oil (Moore et al., 2012) and 90% glycerol (Singh and Beschorner, 2013) viscosity values were taken by previous tribology research. The plot within the “Sliding Speed” box is a representative time-series slipping speed profile where 0% time is heel contact.
The measurement of hydrodynamic pressures may be appropriate for evaluating the ability of mechanical slip-testers to mimic the under-shoe tribology of human slips. In 2001, a panel of slip-testing experts determined that slip-testing devices should be tribologically fidelic (i.e., mimic the tribological interaction of a human slip) (Chang et al., 2003). The results from this study can be used as reference data to evaluate the ability of slip-testing devices to mimic a real slip. Our previous research using a slip-tester had identified peak fluid pressures of 240 kPa when testing the same untreaded shoes with the same fluid and similar vinyl composition flooring (Singh and Beschorner, 2013), which is similar to the maximum fluid pressure observed in this study (220 kPa) and was on the same order of magnitude for the average peak fluid pressure (124 kPa). Future research could systematically modify the slip-testing parameters of this device (vertical force, slipping speed and shoe angle) to achieve fluid pressures similar to the fluid pressures observed during actual slip events.
The technique introduced in this manuscript has potential for evaluating shoe tread design and wear. The shoe that was used in this study was advertised as slip-resistant and appeared to be effective when the tread was present. Other shoe tread designs may be less effective at eliminating hydrodynamic pressures and slip severity. Repeating these experiments across different tread patterns may provide insight into how the design of the tread affects both the hydrodynamics in the shoe-floor interface and the slip outcomes. Our testing revealed that a loss of tread can negatively affect the slip-resistance of the shoe. Testing shoes with varying levels of wear may provide additional insights into the amount of tread required to sustain slip-resistance. Knowing the tread thresholds required to sustain slip resistance will be beneficial for developing shoe-replacement guidelines.
Acknowledgments
This research was funded by the National Institute of Occupational Safety & Health (NIOSH R01 OH 008986).
Footnotes
Publisher's Disclaimer: This is a PDF file of an unedited manuscript that has been accepted for publication. As a service to our customers we are providing this early version of the manuscript. The manuscript will undergo copyediting, typesetting, and review of the resulting proof before it is published in its final citable form. Please note that during the production process errors may be discovered which could affect the content, and all legal disclaimers that apply to the journal pertain.
Conflict of Interest Statement:
There are no known conflicts of interest among the authors of this manuscript.
References
- Bentley T. Slip, trip and fall accidents occurring during the delivery of mail. Ergonomics. 1998;41:1859–1872. doi: 10.1080/001401398186027. [DOI] [PubMed] [Google Scholar]
- Bentley T, Haslam R. Identification of risk factors and countermeasures for slip, trip and fall accidents during the delivery of mail. Applied Ergonomics. 2001;32:127–134. doi: 10.1016/s0003-6870(00)00048-x. [DOI] [PubMed] [Google Scholar]
- Beschorner K, Lovell M, Higgs CF, III, Redfern MS. Modeling Mixed-Lubrication of a Shoe-Floor Interface Applied to a Pin-on-Disk Apparatus. Tribology Transactions. 2009;52:560–568. [Google Scholar]
- Beschorner K, Redfern MS, Cham R. Earliest gait deviations during slips: Implications for recovery. IIE Transactions on Occupational Ergonomics and Human Factors. 2013;1:31–37. [Google Scholar]
- Beschorner KE, Redfern MS, Porter WL, Debski RE. Effects of slip testing parameters or measured coefficient of friction. Applied Ergonomics. 2007;38:773–780. doi: 10.1016/j.apergo.2006.10.005. [DOI] [PubMed] [Google Scholar]
- Blanchette M, Powers C. The Influence of Footwear Tread Groove Parameters on Available Friction. Human Factors & Ergonomics Society; Boston, MA: 2012. [DOI] [PubMed] [Google Scholar]
- Burnfield J, Powers C. Prediction of slip events during walking: An analysis of utilized coefficient of friction and available slip resistance. Ergonomics. 2006;49:982–985. doi: 10.1080/00140130600665687. [DOI] [PubMed] [Google Scholar]
- Cham R, Redfern MS. Changes in gait when anticipating slippery floors. Gait & Posture. 2002a;15:159–71. doi: 10.1016/s0966-6362(01)00150-3. [DOI] [PubMed] [Google Scholar]
- Cham R, Redfern MS. Heel contact dynamics during slip events on level and inclined surfaces. Safety Science. 2002b;40:559–576. [Google Scholar]
- Chambers AJ, Cham R. Slip-related muscle activation patterns in the stance leg during walking. Gait & Posture. 2007;25:565–572. doi: 10.1016/j.gaitpost.2006.06.007. [DOI] [PubMed] [Google Scholar]
- Chang WR, Courtney TK, Gronqvist R, Redfern MS. Measuring slipperiness-discussions on the state of the art and future research. In: CHANG WR, COURTNEY TK, editors. Measuring Slipperiness: Human Locomotion and Surface Factors. London & New York: Taylor & Francis; 2003. [Google Scholar]
- Chang WR, Grönqvist R, Hirvonen M, Matz S. The effect of surface waviness on friction between Neolite and quarry tiles. Ergonomics. 2004;47:890–906. doi: 10.1080/00140130410001670390. [DOI] [PubMed] [Google Scholar]
- Chang WR, Gronqvist R, Leclercq S, Myung R, Makkonen L, Strandberg L, Brungraber RJ, Mattke U, Thorpe SC. The role of friction in the measurement of slipperiness, Part 1: friction mechanisms and definition of test conditions. Ergonomics. 2001a;44:1217–1232. doi: 10.1080/00140130110085574. [DOI] [PubMed] [Google Scholar]
- Chang WR, Kim IJ, Manning DP, Bunterngchit Y. The role of surface roughness in the measurement of slipperiness. Ergonomics. 2001b;44:1200–1216. doi: 10.1080/00140130110085565. [DOI] [PubMed] [Google Scholar]
- Courtney TK, Sorock GS, Manning DP, Collins JW, Holbein-Jenny MA. Occupational slip, trip, and fall-related injuries–can the contribution of slipperiness be isolated? Ergonomics. 2001;44:1118–1137. doi: 10.1080/00140130110085538. [DOI] [PubMed] [Google Scholar]
- Grönqvist R. Mechanisms of friction and assessment of slip resistance of new and used footwear soles on contaminated floors. Ergonomics. 1995;38:224–241. doi: 10.1080/00140139508925100. [DOI] [PubMed] [Google Scholar]
- Hamrock BJ, Schmid SR, Jacobson BO. Fundamentals of fluid film lubrication. CRC press; 2004. [Google Scholar]
- Hanson JP, Redfern MS, Mazumdar M. Predicting slips and falls considering required and available friction. Ergonomics. 1999;42:1619–1633. doi: 10.1080/001401399184712. [DOI] [PubMed] [Google Scholar]
- Haslam R, Bentley T. Follow-up investigations of slip, trip and fall accidents among postal delivery workers. Safety Science. 1999;32:33–47. [Google Scholar]
- International Standards Organization. ISO 20871-2001: Footwear – Test methods for outsoles – Abrasion resistance. Switzerland: ISO; 2012. [Google Scholar]
- Li KW, Chen CJ. The effect of shoe soling tread groove width on the coefficient of friction with different sole materials, floors, and contaminants. Applied Ergonomics. 2004;35:499–507. doi: 10.1016/j.apergo.2004.06.010. [DOI] [PubMed] [Google Scholar]
- Li KW, Wu HH, Lin Y-C. The effect of shoe sole tread groove depth on the friction coefficient with different tread groove widths, floors and contaminants. Applied Ergonomics. 2006a;37:743–748. doi: 10.1016/j.apergo.2005.11.007. [DOI] [PubMed] [Google Scholar]
- Li KW, Wu HH, Lin YC. The effect of shoe sole tread groove depth on the friction coefficient with different tread groove widths, floors and contaminants. Applied Ergonomics. 2006b;37:743–748. doi: 10.1016/j.apergo.2005.11.007. [DOI] [PubMed] [Google Scholar]
- Liberty Mutual Research Institute. Liberty Mutual Workplace Safety Index 2012 [Google Scholar]
- Moore CT, Menezes PL, Lovell M, Beschorner K. Analysis of Shoe Friction During Sliding Against Floor Material: Role of Fluid Contaminant. Journal of Tribology. 2012;134:041104. [Google Scholar]
- Moyer B, Redfern M, Cham R. Biomechanics of trailing leg response to slipping-Evidence of interlimb and intralimb coordination. Gait & posture. 2009;29:565–570. doi: 10.1016/j.gaitpost.2008.12.012. [DOI] [PMC free article] [PubMed] [Google Scholar]
- Moyer BE, Chambers AJ, Redfern MS, Cham R. Gait parameters as predictors of slip severity in younger and older adults. Ergonomics. 2006;49:329–343. doi: 10.1080/00140130500478553. [DOI] [PubMed] [Google Scholar]
- Proctor TD, Coleman V. Slipping, Tripping and Falling Accidents in Great Britain- Present and Future. Journal of Occupational Accidents 1988 [Google Scholar]
- Redfern MS, Bidanda B. Slip resistance of the shoe-floor interface under biomechanically-relevant conditions. Ergonomics. 1994;37:511–524. [Google Scholar]
- Shan L, Levert J, Meade L, Tichy J, Danyluk S. Interfacial Fluid Mechanics and Pressure Prediction in Chemical Mechanical Polishing. Journal of Tribology. 2000;122:539. [Google Scholar]
- Singh G, Beschorner K. A Method for Measuring Hydrodynamic Lubrication in the Shoe-Floor-Fluid Interface: Application to Shoe Tread Evaluation. Ergonomics. 2013 doi: 10.1080/21577323.2014.919367. in review. [DOI] [PMC free article] [PubMed] [Google Scholar]
- Strandberg L. The effect of conditions underfoot on falling and overexertion accidents. Ergonomics. 1985;28:131–147. doi: 10.1080/00140138508963123. [DOI] [PubMed] [Google Scholar]
- Strobel CM, Menezes PL, Lovell M, Beschorner K. Analysis of the Contribution of Adhesion and Hysteresis to Shoe-Floor Lubricated Friction in the Boundary Lubrication Regime. Tribology Letters. 2012;46:341–7. [Google Scholar]
- Tisserand M. Progress in the prevention of falls caused by slipping. Ergonomics. 1985;28:1027–1042. doi: 10.1080/00140138508963225. [DOI] [PubMed] [Google Scholar]
- U.S. Department of Labor-Bureau of Labor Statistics. Fatal occupational injuries by industry and selected event or exposure, 2011. Washington, D.C: 2012a. Census of Fatal Occupational Injuries Summary: Table 2. [Google Scholar]
- U.S. Department of Labor-Bureau of Labor Statistics. Number, incidence rate, and median days away from work for nonfatal occupational injuries and illnesses involving days away from work by selected injury or illness characteristics and private industry, state government, and local government, 2011. Washington, D.C: 2012b. Nonfatal Occupational Injuries and Illnesses Requiring Days Away From Work: Table 5. [Google Scholar]


