Abstract
The chemical exchange saturation transfer (CEST) effect on an egg white (EW) suspension was investigated for optimization of magnetization transfer (MT) power (B1,rms) and pH dependency with the addition of lactic acid. Applying a higher MT pulse, B1,rms, Z-spectrum shows higher asymmetry and the magnetisation transfer ratio (MTR)asym signal increases to around 1–3.5 ppm, indicating a higher CEST effect. Amide proton transfer (APT) at 3.5 ppm shows a signal elevation in MTRasym with the application of higher B1,rms power and high pH. In addition, the hydroxyl proton signal in MTRasym increases as pH is reduced by lactic acid. In Z-spectrum of B1,rms at 1.0 μT and 2.0 μT, the dependence on CEST effect of amide proton and hydroxyl proton could be observed by using an EW suspension phantom. The CEST MT power was optimized on the EW suspension phantom with pH dependency and further confirmed on volunteers. In addition, APT imaging at 3.5 ppm using B1,rms at 1.0 μT performed on two human brains with different pathophysiological conditions indicated appropriate ATP effect.
Keywords: chemical exchange saturation transfer, chemical exchange saturation transfer, B0 correction, B1 power, pH dependency, egg white, amide proton transfer, amide proton transfer effect on human brain
Introduction
The chemical exchange saturation transfer (CEST) effect is the phenomenon of proton exchange between bulk water and a solute at a specific resonance frequency in chemical compounds.1,2 Proton exchanges in amide, amine, and hydroxyl groups with the surrounding bulk water can be observed in endogenous CEST imaging, e.g., amide proton transfer (APT) imaging at 3.5 ppm, amine proton at around 2.0 ppm, and hydroxyl proton at 1.0 ppm.3–6 APT imaging provides image contrast based on the proton exchange of amide protons contained mainly in mobile proteins and peptides. The APT ratio offers an indicator of base-catalyzed environment in the physiological pH range, and the exchange rate increases in proportion to the increase in pH.5 However, the CEST effect is usually small and shows a dependence on field strength (B0), and is sensitive to B0 and B1 fields and saturation pulse power.7 Because CEST imaging depends on the inhomogeneity of the image field and the power of radiofrequency saturation pulses, it is important that magnetization transfer (MT) saturation pulses are optimized and tuned to each offset frequency within the suitable offset frequency range.
Lactic acid is a carboxylic acid with a hydroxyl group adjacent to the carboxyl group. In solution, a proton can be lost from the carboxyl group, producing the lactate ion CH3CH (OH) COO−. The higher acidity is a consequence of the intramolecular hydrogen bridge between the α-hydroxyl and carboxylate group, making the latter less capable of strongly attracting the proton. In vivo, during exercise, the intramuscular lactate concentration and partial pressure of CO2 (PCO2) increase, causing an increase in proton concentration [H+] and a decrease in pH.8 As a result, lactate, i.e., the conjugate base of lactic acid is produced as the final metabolite in anaerobic glycolysis of glucose by ischemia, hypoxemia, and exercise. A rise in lactate concentration appears to occur when the reaction rate of anaerobic glycolysis dissimilates lactic acid or exceeds the excretion ability of the blood.9 Furthermore, lactic acid also contains a methyl group. On proton magnetic resonance spectroscopy (1H-MRS) used in vivo, lactate methyl proton detection at 1.33 ppm has proven to be useful in clinical studies, such as investigations of brain tumors, brain infarction, and mitochondrial myopathy, encephalopathy, lactic acidosis, stroke-like episodes (MELAS).10–12 Lactate is often detected in situations differing from the “normal” pH range and amide content in situ, e.g., in brain tumors or under conditions of acidosis.13 It has been reported that APT effect had a strong correlation with pH as increasing lactate concentration as determined by 1H-MRS in animal ischemic study; however, other physiological factors may affect in the post-ischemic brain.14 Yeung, et al., has studied the MT effect of cooked egg yolk and white, and raw egg yolk and white to evaluate the MT effect on human brains.15 Their article has indicated that the raw egg white (EW) presents the highest MT effect among them in both T1 and proton density weighted conditions. Thus, we consider using the raw EW phantom in our CEST experiment under a hypotheses that adding lactic acid to the suspension of EW phantom mimics the conditions of which increasing lactic acid result in metabolic acidosis in the brain, i.e., lactic acid leads to increase in the CEST effect. In order to investigate the detailed information for the relation between pH and lactic acid, it is necessary to compare the CEST effect in our MR pulse sequence with those in previous studies, e.g., Z-spectrum to MT pulse power. Recently, the effect of APT at 3.5 ppm has been reported in different severity of between true progression and pseudo-progression in malignant gliomas (85–95%).16 Due to a long scan time of CEST experiment, it is difficult to optimize an appropriate MT pulse power in clinical setting. In addition, in order to reveal and confirm the CEST effect, the proposed method using the EW phantom with adding lactic acid was practically used to investigate the CEST effect to optimize the MT pulse power. The purpose of this study is to investigate the CEST effect of EW, the effect of lactic acid in an EW phantom causing pH changes, the brain CEST effect of B1,rms power on healthy volunteers, and further applied APT imaging on patients with two different pathophysiological conditions.
Materials and Methods
Phantom components
Three homemade EW phantoms with different concentrations of lactic acid were prepared (Table 1). EW is the cytoplasm of the egg with a gelatinous, semi-transparent liquid mixture and about 11% protein.17 EW phantoms with 10 and 20 wt% lactic acid (C3H6O3 90.08 g/mol) were used as Samples 1 and 2, respectively. The pH-induced aggregation and conformational changes of EW proteins were scarcely observed, as investigated previously.18 A total of three samples, two EW samples with lactic acid and one without lactic acid, were transferred into 50-ml conical tubes. The pH and temperature of samples were measured using a pH thermometer (Piccolo +; HI 98113, HANNA Instruments, Woonsocket, RI, USA).
Table 1.
Phantom components
| Sample number | Components | Lac molecular mass (mol) | pH | Temperature (°C) |
|---|---|---|---|---|
| 1 | EW 40 ml + Lac 20 wt% solution 1 ml | 0.22 | 6.2 | 24.0 |
| 2 | EW 40 ml + Lac 10 wt% solution 1 ml | 0.11 | 7.0 | 24.0 |
| 3 | EW 40 ml without Lac solution | − | 8.8 | 24.0 |
EW, egg white; Lac, lactic acid.
MR Imaging Parameter for CEST Imaging
Phantom studies
All phantom studies were performed using a 3T MR scanner (Vantage; Toshiba Medical Systems Corp., Otawara, Japan), using a whole-body transmission coil and a 32-channel phased array head coil as a receiver. After setting all samples at the center position on the head coil, CEST images were acquired with a fast advanced spin-echo (FASE) sequence as a readout, representing a half-Fourier fast-spin echo. The phantom containing all samples were then shimmed over the whole slice, and the water signal was tuned at center frequency. The frequency offset range was from −10 to +10 ppm at intervals of 0.5 ppm, and a total of 41 data points was acquired. The MT pulses used in our experiment were a series of 25 cycle sinc pulses of 40-ms duration with a 1-ms interval, using 200 deg., 500 deg., and 1000 deg., corresponding to each MT pulse power by mean of root mean square (B1,rms) at 0.4, 1.0, and 2.0 μT, respectively. Imaging parameters for phantom studies were as follows: TE, 60 ms; TR, 9000 ms; matrix, 256 × 256; FOV, 200 mm; single slice with 5 mm slice thickness; flip angle (FA), 90 deg.; refocusing flip angle, 160 deg.; number of shots, 1, indicating a single-shot FSE, and a total scan time of 6 min and 9 sec. Temperature around the samples was monitored and maintained during the experiment. In addition, during our testing of MT pulse train, we have confirmed that no CEST effect was observed on long T2 water signal. Our rationale of the CEST experiment design is that a 1-second duration of MR pulse train is long enough to translate the MT pulse train to the effective TE of 60 ms in 2D FASE. The repetition time or TR of 9 sec is used for waiting T1 recovery of long T2 and T1 components like water in cerebrospinal fluid (CSF).
Human studies
Human studies were approved by the local internal review board. Informed consents were obtained from all volunteers and patients. To assess a sufficiency of APT effect in the human brain, two healthy volunteers (31- and 28-year-old males) were studied using B1,rms of 0.4 μT and 1.0 μT due to the specific absorption rate (SAR) limitation. Thereafter, two patients (30-year-old male with grade 2 oligoastrocytoma and 71-year-old male with malignant lymphoma) underwent the APT experiment using B1,rms of 1.0 μT. Due to the SAR limitation on human studies, B1,rms of equal or lower than 1.0 μT was applied using similar parameters. Imaging parameters for the human studies were as follows; TE, 60 ms; TR, 9000 ms; matrix, 256 × 256; FOV, 230 mm; single slice with a 5-mm slice thickness; FA, 90 deg.; refocusing flip angle, 160 deg.; and number of shots, 1. Z-spectra were obtained similarly to the phantom experiment; 41 data points from −10 ppm to +10 ppm with a 0.5-ppm interval, and maintaining a total scan time in 6 min and 9 sec.
Post-imaging analysis
Pixel-wise B0 correction was conducted for acquired CEST data sets using spline interpolation methods, i.e., Z-spectrum.19 The asymmetric magnetization transfer ratio (MTRasym) was then calculated as:
where Isat and I0 are the imaging signal intensities measured with MT pulses at each frequency and at −10 ppm frequency where no MT effect was observed, and Δω is frequency offset. MTRasym at 1.0 ppm for hydroxyl proton and MTRasym at 3.5 ppm for amide proton were derived from CEST data sets obtained with a series of MT pulses.5 These phantom CEST experiments were repeated 3 times.
All images were processed using MATLAB version 2011b (Mathworks, Natick, MA). The image quality of the EW phantom was confirmed by observing obtained images around +1.0 ppm to −1.0 ppm with and without B0 correction. The signal intensity (SI) from B0-corrected CEST data was then measured by drawing a ROI on all sample images. Z-spectrums were obtained from the B0 corrected CEST data. The MTRasym map was computed by taking the difference of the signal between +Δω and −Δω. For human brain studies, the APT signal around +3.5 ppm was calculated on a pixel-by-pixel base and plotted in a color map. Then, the APT signals were compared to those from off-center source images.
Results
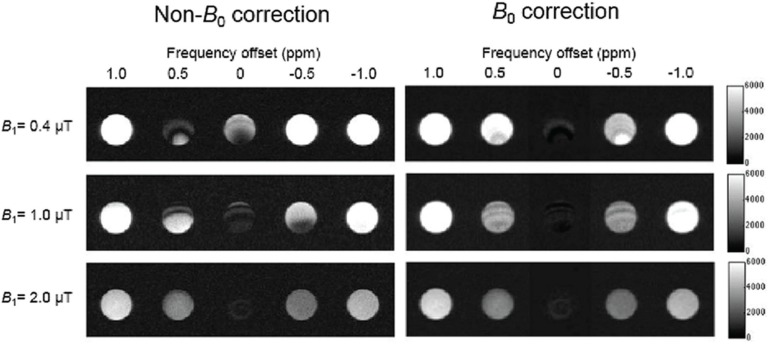
Figure 1 shows MT images of EW samples before and after B0 correction from +1.0 to −1.0 ppm with each B1,rms. MT images before B0 correction with B1,rms of 0.4 and 1.0 μT show obvious banding artifacts at +0.5 to −0.5 ppm. Note that the banding artifacts decreased with increasing B1,rms. MT images after B0 correction at 0 ppm with each B1,rms showed the lowest signal intensity among all offsets and more homogeneous signal distribution compared with those images before B0 correction, making B0-corrected images of all offsets symmetrical with the symmetry point at 0 ppm.
Fig. 1.
Chemical exchange saturation transfer (CEST) images of egg white (EW) before and after B0 correction around the central frequency of water (from 1.0 to −1.0 ppm) at each saturation pulse power. Left images show before B0 correction, and right images show after B0 correction. The upper row represents 0.4 μT, the middle row represents 1.0 μT, and the bottom row represents 2.0 μT. Gray scale bar on the right indicates signal intensity in arbitrary units.
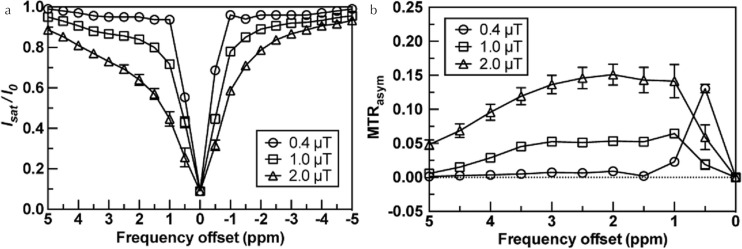
Figure 2 shows the Z-spectrum and MTRasym curve of the control EW sample without lactic acid on three B1,rms values of 0.4, 1.0, and 2.0 μT. The Z-spectrum shows broadening of the linewidth with increasing B1,rms due to direct water saturation and increasing CEST effect (Fig. 2a). The MTRasym curve showed higher values with increasing B1,rms (Fig. 2b). A broad MTRasym curve was observed around 1.0–3.5 ppm in the control EW sample. In addition, Z spectra of different B1,rms values showed broader full-width at half-maximum (FWHM), indicating the possibility of a saturation effect for the radio-frequency (RF) pulse. The elevated signal at +0.5 ppm on the B1,rms of 0.4 μT (Fig. 2b) could represent a residual banding artifact signal in 0.4 μT (Fig. 1).
Fig. 2.
(a) Z-spectra of control egg white (EW) at each saturation pulse power. Z-spectrum; X axis shows frequency offset, Y axis shows the ratio of the water signals with and without saturation (I/I0), where Isat and I0 are the imaging signal intensities measured with and without magnetization transfer (MT) pulse saturation. (b) asymmetric magnetization transfer ratio (MTRasym) curves of the control EW phantom at each saturation power. MTRasym curve; X axis shows frequency offset, Y axis MTRasym value. These MT saturation powers in the plots are shown as: open circle, 0.4 μT saturation power; open square, 1.0 μT saturation power; open triangle, 2.0 μT saturation power.
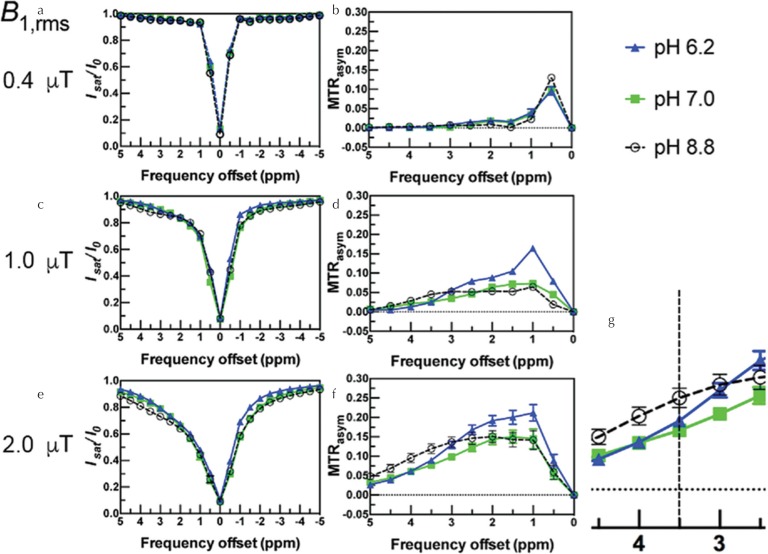
Figure 3 shows the Z-spectra and MTRasym curves of all three samples at three different B1,rms. With increasing B1,rms at 1.0 μT and 2.0 μT, symmetry of the Z-spectra became noticeable and signal on the +Δω side was decreased as compared to −Δω (Fig. 3c, e), corresponding to higher MTRasym curve values of three samples over the frequency offsets (Fig. 3d, f). In particular, the hydroxyl proton signal at +1 ppm was elevated with decreasing pH at 6.2 with B1,rms at 1.0 μT (Fig. 2d). With respect to the lower pH of samples, the Z-spectrum around +3.5 ppm showed a less-asymmetric spectrum, meaning a reduced CEST effect (Fig. 3c, e); the value of MTRasym showed a relatively increasing signal on the low-frequency side, especially at 1.0 ppm (Fig. 3d, f). Figure 3g, as an expansion of Fig. 3f, indicates the change in MTRasym value at 3.5 ppm with respect to pH change. On the other hand, these spectra of B1,rms at 0.4 μT showed less than 1% of signal change. However, MTRasym shows a high signal at 0.5–1 ppm (Fig. 3a, b). Note that the Z-spectrum of B1,rms at 0.4 μT shows a reduced CEST effect and the result of MTRasym shows high values at 0.5 ppm in all samples (Fig. 3b), due to some effect of residual banding artifacts at 0.5 ppm (Fig. 1).
Fig. 3.
Z-spectrum and asymmetric magnetization transfer ratio (MTRasym) curve of two different pH egg white (EW)_lactic acid (Lac) samples and EW sample at three saturation powers: (a, b) at 0.4 μT; (c, d) at 1.0 μT; (e, f) at 2.0 μT; and (g) an enlarged view of (f) near 3.5 ppm. Green squares indicate pH 7.0 EW_Lac sample, blue triangles indicate pH 6.2 EW_Lac sample, and open dots indicate pH 8.8 EW sample Z-spectrum: X axis shows frequency offset, Y axis shows measured value of the ratio of the water signal with saturation and without (I/I0). MTRasym curve: X axis shows frequency offset, Y axis shows MTRasym value.
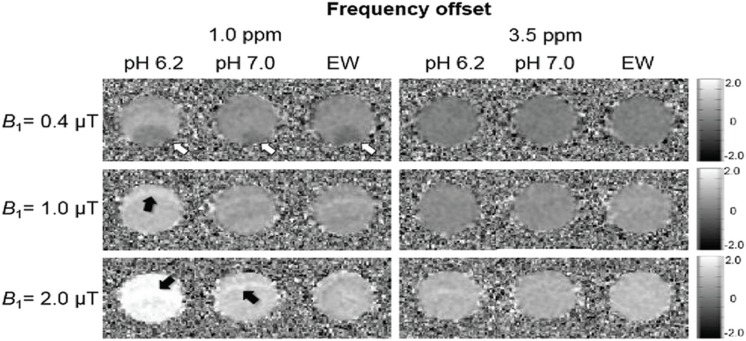
Table 2 summarizes MTRasym values of the hydroxyl proton at 1.0 ppm and amide proton at 3.5 ppm on three samples with different B1,rms. MTRasym images at 1.0 ppm and at 3.5 ppm for all three B1,rms are shown in Fig. 4. MTRasym values of all samples at a B1,rms of 2.0 μT provided higher signals at 1.0 and 3.5 ppm than those obtained at B1,rms of 1.0 μT. However, MTRasym at a B1,rms of 0.4 μT presented with reduced signals in all three samples.
Table 2.
Measured asymmetric magnetization transfer ratio (MTRasym) (1.0 ppm) and MTRasym (3.5 ppm) values of three samples at different magnetization transfer (MT) saturation pulse powers
| Sample number | pH | MTRasym(1.0 ppm) value (%) | MTRasym(3.5 ppm) value (%) | |||||
|---|---|---|---|---|---|---|---|---|
| 0.4 μT | 1.0 μT | 2.0 μT | 0.4 μT | 1.0 μT | 2.0 μT | |||
| 1 | 6.2 | 3.93 ± 0.94 | 16.42 ± 0.21 | 21.18 ± 2.10 | 0.25 ± 0.12 | 2.46 ± 0.12 | 8.96 ± 0.69 | |
| 2 | 7.0 | 3.37 ± 0.11 | 7.33 ± 0.56 | 14.50 ± 2.56 | 0.13 ± 0.05 | 2.59 ± 0.19 | 7.69 ± 0.54 | |
| 3 | 8.8 | 6.82 ± 0.11 | 6.44 ± 0.56 | 14.14 ± 2.45 | 1.50 ± 0.00 | 4.53 ± 0.24 | 11.92 ± 1.26 | |
Fig. 4.
Asymmetric magnetization transfer ratio (MTRasym) images at 1.0 ppm and 3.5 ppm at each saturation pulse power. The pH 6.2 egg white (EW)_lactic acid (Lac) sample shows the highest value, at 1.0 ppm. The EW sample shows a higher value at 3.5 ppm. The low-intensity artifact is visible in all samples of 0.4 μT at 1.0 ppm (white arrow). The high-intensity artifact is visible in some samples of 1.0 and 2.0 μT at 1.0 ppm (black arrow). No artifacts are apparent in any samples at 3.5 ppm. The upper row represents 0.4 μT, the middle row, 1.0 μT, and the bottom row, 2.0 μT.
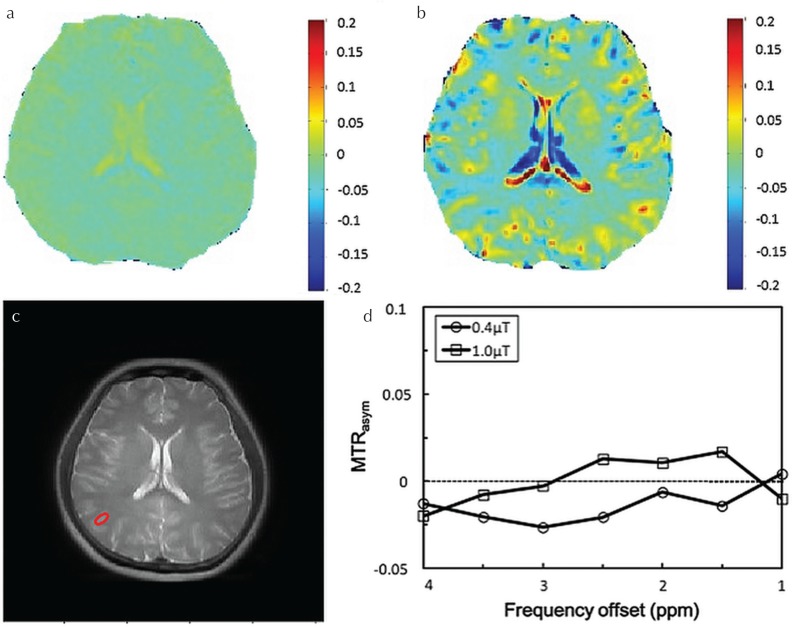
Figure 5 shows APT images around 3.5 ppm and MTRasym obtained using B1,rms of 0.4 μT and 1.0 μT. The B1,rms of 1.0 μT presents better APT effect around 3.5 ppm on both volunteers. However, there was no pathology to indicate the APT effect on the both healthy volunteers. As expected in the phantom experiment, B1,rms of 1.0 μT provides higher MTRasym signals around 1.0 to 4.0 ppm than B1,rms of 0.4 μT. In addition, we have confirmed that CSF (long T2 component) shows a sharp Z-spectrum, indicating that water signal has no saturating effect due to a narrow bandwidth of CEST RF pulses as well as no CEST effect.
Fig. 5.
Brain amide proton transfer (APT) effect at B1 at 0.4 μT (a) and 1.0 μT (b) on a 28-year-old male healthy volunteer. The source image (c) and an asymmetric magnetization transfer ratio (MTRasym) of region at red circle (d).
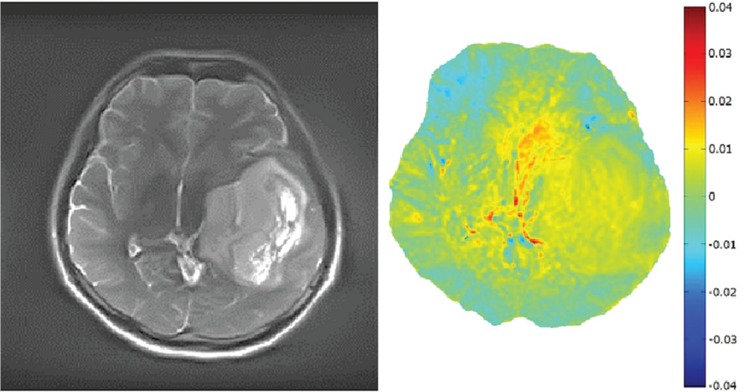
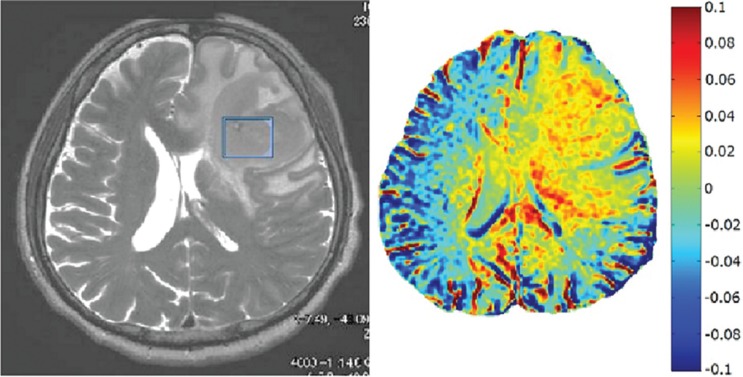
Figure 6 shows an APT image at 3.5 ppm and the source image obtained on a patient with grade 2 oligoastrocytoma using B1,rms of 1.0 μT. The APT image at 3.5 ppm indicates a mild MTRasym signal of amide proton with about 2% signal as compared to the normal tissue area in the brain. Figure 7 shows the patient with malignant lymphoma using the same B1,rms. Malignant lymphoma indicates higher MTRasym of about 5% indicating greater malignancy of MTRasym of amide proton.
Fig. 6.
The source image and amide proton transfer (APT) image around 3.5 ppm obtained from a 30-year-old male patient with grade 2 oligoastrocytoma. The tumor is identified in both source and APT images. The APT image indicates about 2% elevated signal as compared to the normal area.
Fig. 7.
The source image and amide proton transfer (APT) image around 3.5 ppm obtained on a 71-year-old patient with malignant lymphoma. The malignant lymphoma lesion is shown in both source and APT images. Note that an elevated APT value of about 5% is observed in the tumor area as compared to the normal area, indicating greater malignancy of amide proton.
Discussion
EW phantom images were observed before and after B0 correction. In EW phantom images, B0-corrected images showed symmetrical images around +0.5 ppm and −0.5 ppm with observation of a direct saturation effect at 0 ppm, unlike non-B0-corrected images. With respect to the B1,rms at 2.0 μT, Z-spectra and MTRasym spectra were successfully obtained on three EW samples (20 wt%, 10 wt%, and 0 wt% lactic acid). MTRasym value at 1.0 ppm of egg white (EW)_lactic acid (Lac) samples were higher than those of EW alone in this study. Glycosaminoglycan (GAG) monitoring has been reported in cartilage with the CEST effect of the hydroxyl proton of lactate.20 Our results were similar for the hydroxyl proton group under conditions of decreasing pH with lactate.
While our results revealed that adequate B1,rms powers provide higher contrast of MTRasym images in both EW samples with and without lactate at each offset frequency, low B1,rms power at 0.4 μT presented with almost no CEST effect, again consistent with the previous literature.4,7 In addition, we observed that low B1,rms power introduced banding artifacts at near-center frequency even after our B0 correction, and these artifacts were markedly reduced at higher B1,rms powers. Regarding the MTRasym at 1 ppm, EW_Lac samples provide an elevated peak at lower pH as compared to the MTRasym at 3.5 ppm. This was observed in both at B1,rms 1.0 and 2.0 μT powers. Prominently, the pH effect was observed on the OH proton at 1 ppm. However, because of the closer proximity to the center frequency, extra attention is required in analysis. This may be improved by sharpening the frequency profile of the MT pulse. Regarding the MTRasym at 3.5 ppm, EW_Lac samples provide lower values than that of the EW-only sample, meaning that the lactic acid concentration in EW protein may have influenced APT signals at a frequency offset of 3.5 ppm. B1,rms at both 1.0 μT and 2.0 μT provides higher APT signal of EW without lactic acid, indicating a higher signal at higher pH. Not only B1,rms but also pH effects on APT imaging were demonstrated using EW with addition of lactic acid.
In previous studies, it has been reported that APT weighted-image provide a biomarker for the evaluations of malignancy grading and treatment response, e.g., active glioma.16,21,22 Furthermore, most recently, the APT study has been reported in differentiation of malignant and benign in thoracic lesions using similar sequence parameters with B1,rms of 1.0 μT.23 In the volunteer study, the experiment with B1,rms of 0.4 μT and 1.0 μT was performed and observed the CEST effect and MTRasym value. Due to no disease lesion, no obvious APT effect was observed; however, B1,rms of 1.0 μT gave better CEST effect than using B1,rms of 0.4 μT. Similarly, we performed APT imaging at 3.5 ppm on two clinical cases of different tumors in the brain using B1,rms of 1.0 μT due to an RF power limitation. At 3T, B1,rms of 1.0 μT gave a reasonable APT contrast at MTRasym at 3.5 ppm between grade 2 oligoastorocytoma and malignant lymphoma. APT contrast indicates higher MTRasym at 3.5 ppm on malignant lymphoma, which was an indication of APT increases with tumors as compared to normal tissues.24 CEST contrast strongly depends on the choice of imaging parameters, particularly the MT saturation B1,rms, which needs to be optimized. A previous report demonstrated pH effects on the simulation and phantom experiment at different B1,rms.25 With increasing B1 power, the signal value at around 3.5 ppm of the Z-spectrum decreases and the peak broadens, and the resulting APT effect at 3.5 ppm yields higher values,25 consistent with our results. In our phantom study, relatively reasonable CEST effects were observed with B1,rms at 1.0 μT and 2.0 μT. Furthermore, MTRasym at 1.0 ppm on B1,rms 1.0 μT showed high values in low pH order, and MTRasym at 3.5 ppm on B1,rms 1.0 μT showed high values in high pH order (Fig. 3d and Table 2). On the contrary, the previous study with creatine model solutions25 showed MTRasym at 1.0 ppm on B1,rms 1.0 μT with high values in high pH order, and MTRasym at 3.5 on B1,rms 1.0 μT showed high value in low pH order. In short, these relationships to each frequency turned to be contradictory. The difference in these results might lead to dependence of pH and MTRasym, because there are different components in creatine solution and EW; one of creatine model were used to mimic CEST effects as two-pool system, and another of EW model to mimic CEST effect as complex background and realistic model system.
Brain ischemia causes a lower APT effect than normal brain.4,26,27 Sun et al. reported that APT imaging could detect ischemic lesions and findings strongly correlated with tissue lactate content as measured by 1H-MRS, indicating lactic acidosis.27 Their results indicated that APT imaging showed prominently lower values in the acute phase of ischemia compared with the control side, and this asymmetry correlates with pH. In high-grade glioma under clinical study, APT signals were significantly higher in the lesion than in normal brain tissue.4,5,28 Although the APT change in brain ischemia has been considered as the effect of pH change, other factors could be involved.14 In brain, having pH-buffering activity may affect as a cellular acidification under the MT effect of albumin itself. Albumin is one of materials having the pH-buffering activity, which is contained abundantly in the blood, cerebrospinal fluid, and EW. Hence, we thought that it was very meaningful to investigate using the EW phantom about the influence of the pH-buffering activity under the brain CEST effect. From our human brain results indicated a possibility of abundant lactate such as in high-grade brain tumor, ischemia, and acidosis, the CEST effect may be in not only MTRasym at 3.5 ppm, but also hydroxyl proton at 1.0 ppm and other offset frequencies, which might provide additional information.
Several limitations in this study must be considered when interpreting the results. First, the MT pulse bandwidth needs to be considered, especially near the center frequency. Banding artifacts near center frequency were observed on MTRasym of hydroxyl protons around 1.0 ppm. Note that these effects were less at the APT area at 3.5 ppm. Our MT bandwidth of FWHM is about 50 Hz or 0.4 ppm at 3T. MTRasym peaks at around 0.5–1.0 ppm may thus have some effect from the side lobes of the MT pulses. However, the MTRasym peak for amide proton at 3.5 ppm shows fewer artifacts. Applying a longer MT pulse duration may improve the FWHM of the RF envelope shape. Second, pixel-wise B0 correction analysis was performed using spline interpolation methods.18 Spline interpolation tends to fail, especially in samples applied with lower B1,rms in which band-like artifacts near the central frequency were observed before B0 correction. Comparison between the spline interpolation method and other B0 corrections may improve outcomes. Third, the influence of the nuclear Overhauser effect (NOE) has not been thoroughly investigated. The NOE of lactate is assumed to be seen near the negative offset frequency, which might affect APT.29 Lastly, we did not discuss pH effects on the amine peak around +2 ppm. CEST signals around 1–3.5 ppm are broad and not resolved. In addition, amino proton frequency in the EW phantom with lactate is unknown. We have yet to investigate these issues any further, but the signal at +2 ppm increases with increasing B1,rms and pH. Furthermore, due to RF amp duty cycle, we could investigate APT on human studies using B1,rms of 1.0 μT. In a result, applying B1,rms of 1.0 μT provides relatively different APT signal at 3.5 ppm on brain tumors.
In conclusion, this experiment on CEST imaging provided reasonable MTRasym curves using EW phantoms with and without lactic acid at pH 6.2–8.8. Significant influences on MTRasym curve signals were demonstrated by saturation B1,rms changes and pH changes in these ex-vivo experiments. In addition, human brain studies indicate APT signal difference in tumors by applying B1,rms of 1.0 μT power.
Footnotes
Conflicts of Interest
Naotaka Sakashita and Mitsue Miyazaki are employees of Toshiba Medical Systems. All others have no conflict of interest.
References
- 1.Liepinsh E, Otting G. Proton exchange rates from amino acid side chains—implications for image contrast. Magn Reson Med 1996; 35:30–42. [DOI] [PubMed] [Google Scholar]
- 2.Ward KM, Aletras AH, Balaban RS. A new class of contrast agents for MRI based on proton chemical exchange dependent saturation transfer (CEST). J Magn Reson 2000; 143:79–87. [DOI] [PubMed] [Google Scholar]
- 3.Kim M, Gillen J, Landman BA, Zhou J, van Zijl PC. Water saturation shift referencing (WASSR) for chemical exchange saturation transfer (CEST) experiments. Magn Reson Med 2009; 61:1441–1450. [DOI] [PMC free article] [PubMed] [Google Scholar]
- 4.Zhou J, Payen JF, Wilson DA, Traystman RJ, van Zijl PC. Using the amide proton signals of intracellular proteins and peptides to detect pH effects in MRI. Nat Med 2003; 9:1085–1090. [DOI] [PubMed] [Google Scholar]
- 5.Zhou J, Lal B, Wilson DA, Laterra J, van Zijl PC. Amide proton transfer (APT) contrast for imaging of brain tumors. Magn Reson Med 2003; 50:1120–1126. [DOI] [PubMed] [Google Scholar]
- 6.van Zijl PC, Jones CK, Ren J, Malloy CR, Sherry AD. MRI detection of glycogen in vivo by using chemical exchange saturation transfer imaging (glycoCEST). Proc Natl Acad Sci USA 2007; 104:4359–4364. [DOI] [PMC free article] [PubMed] [Google Scholar]
- 7.Sun PZ, Farrar CT, Sorensen AG. Correction for artifacts induced by B(0) and B(1) field inhomogeneities in pH-sensitive chemical exchange saturation transfer (CEST) imaging. Magn Reson Med 2007; 58:1207–1215. [DOI] [PubMed] [Google Scholar]
- 8.Stahl GL, Longhurst JC. Ischemically sensitive visceral afferents: importance of H+ derived from lactic acid and hypercapnia. Am J Physiol 1992; 262:H748–H753. [DOI] [PubMed] [Google Scholar]
- 9.Robergs RA, Ghiasvand F, Parker D. Biochemistry of exercise-induced metabolic acidosis. Am J Physiol Regul Integr Comp Physiol 2004; 287:R502–R516. [DOI] [PubMed] [Google Scholar]
- 10.Schupp DG, Merkle H, Ellermann JM, Ke Y, Garwood M. Localized detection of glioma glycolysis using edited 1H MRS. Magn Reson Med 1993; 30:18–27. [DOI] [PubMed] [Google Scholar]
- 11.Graham GD, Kalvach P, Blamire AM, Brass LM, Fayad PB, Prichard JW. Clinical correlates of proton magnetic resonance spectroscopy findings after acute cerebral infarction. Stroke 1995; 26:225–229. [DOI] [PubMed] [Google Scholar]
- 12.Kuwabara T, Watanabe H, Tanaka K, et al. Mitochondrial encephalomyopathy: elevated visual cortex lactate unresponsive to photic stimulation—a localized 1H-MRS study. Neurology 1994; 44:557–559. [DOI] [PubMed] [Google Scholar]
- 13.Gillies RJ, Raghunand N, Karczmar GS, Bhujwalla ZM. MRI of the tumor microenvironment. J Magn Reson Imaging 2002; 16:430–450. [DOI] [PubMed] [Google Scholar]
- 14.Jokivarsi KT, Gröhn HI, Gröhn OH, Kauppinen RA. Proton transfer ratio, lactate, and intracellular pH in acute cerebral ischemia. Magn Reson Med 2007; 57:647–653. [DOI] [PubMed] [Google Scholar]
- 15.Yeung HN, Aisen AM. Magnetization transfer contrast with periodic pulsed saturation. Radiology 1992; 183:209–214. [DOI] [PubMed] [Google Scholar]
- 16.Ma B, Blakeley JO, Hong X, et al. Applying amide proton transfer-weighted MRI to distinguish pseudoprogression from true progression in malignant gliomas. J Magn Reson Imaging 2016; 44:456–462. [DOI] [PMC free article] [PubMed] [Google Scholar]
- 17.Kaewmanee T, Benjakul S, Visessanguan W. Changes in chemical composition, physical properties and microstructure of duck egg as influenced by salting. Food Chemistry 2009; 112:560–569. [Google Scholar]
- 18.Stevens L. Egg white proteins. Comp Biochem Physiol B 1991; 100:1–9. [DOI] [PubMed] [Google Scholar]
- 19.Stancanello J, Terreno E, Castelli DD, Cabella C, Uggeri F, Aime S. Development and validation of a smoothing-splines-based correction method for improving the analysis of CEST-MR images. Contrast Media Mol Imaging 2008; 3:136–149. [DOI] [PubMed] [Google Scholar]
- 20.Ling W, Regatte RR, Navon G, Jerschow A. Assessment of glycosaminoglycan concentration in vivo by chemical exchange-dependent saturation transfer (gagCEST). Proc Natl Acad Sci USA 2008; 105:2266–2270. [DOI] [PMC free article] [PubMed] [Google Scholar]
- 21.Zhou J, Tryggestad E, Wen Z, et al. Differentiation between glioma and radiation necrosis using molecular magnetic resonance imaging of endogenous proteins and peptides. Nat Med 2011; 17:130–134. [DOI] [PMC free article] [PubMed] [Google Scholar]
- 22.Zhou J, Zhu H, Lim M, et al. Three-dimensional amide proton transfer MR imaging of gliomas: Initial experience and comparison with gadolinium enhancement. J Magn Reson Imaging 2013; 38:1119–1128. [DOI] [PMC free article] [PubMed] [Google Scholar]
- 23.Ohno Y, Yui M, Koyama H, et al. Chemical exchange saturation transfer MR imaging: preliminary results for differentiation of malignant and benign thoracic lesions. Radiology 2016; 279:578–589. [DOI] [PubMed] [Google Scholar]
- 24.Jones CK, Schlosser MJ, van Zijl PC, Pomper MG, Golay X, Zhou J. Amide proton transfer imaging of human brain tumors at 3T. Magn Reson Med 2006; 56:585–592. [DOI] [PubMed] [Google Scholar]
- 25.Schmitt B, Zaiss M, Zhou J, Bachert P. Optimization of pulse train presaturation for CEST imaging in clinical scanners. Magn Reson Med 2011; 65:1620–1629. [DOI] [PubMed] [Google Scholar]
- 26.Sun PZ, Zhou J, Huang J, van Zijl P. Simplified quantitative description of amide proton transfer (APT) imaging during acute ischemia. Magn Reson Med 2007; 57:405–410. [DOI] [PubMed] [Google Scholar]
- 27.Sun PZ, Cheung JS, Wang E, Lo EH. Association between pH-weighted endogenous amide proton chemical exchange saturation transfer MRI and tissue lactic acidosis during acute ischemic stroke. J Cereb Blood Flow Metab 2011; 31:1743–1750. [DOI] [PMC free article] [PubMed] [Google Scholar]
- 28.Zhou J, Blakeley JO, Hua J, et al. Practical data acquisition method for human brain tumor amide proton transfer (APT) imaging. Magn Reson Med 2008; 60:842–849. [DOI] [PMC free article] [PubMed] [Google Scholar]
- 29.Swanson SD. Protein mediated magnetic coupling between lactate and water protons. J Magn Reson 1998; 135:248–255. [DOI] [PubMed] [Google Scholar]


