

Abstract
Two common analytical chemical problems often encountered when using chromatographic techniques in drug analysis are matrix interferences and ion suppression. Common sample preparation often involves the dilution of the sample prior to injection onto an instrument, especially for liquid chromatography–mass spectrometry (LC–MS) analyses. This practice frequently does not minimize or eliminate conditions that may cause ion-suppression and therefore, suffer more from reduced method robustness. In order to achieve higher quality results and minimize possible interferences, various sample preparation techniques may be considered. Through the use of QuEChERS (“catchers”), a novel sample preparation technique used for high aqueous content samples, benzodiazepines can be extracted from biological fluids, such as blood and urine. This approach has shown increased recoveries of target compounds when using quantification by both external and internal standard. This increase in the recoveries has been attributed to a matrix enhancement and was determined through the use of the method of standard addition. While improving the overall analytical method for gas chromatography–mass spectrometry (GC–MS) analysis, it is not clear if this approach represents an overall benefit for laboratories that have both GC–MS and high performance liquid chromatography tandem mass spectrometry (HPLC–MS/MS) capability. Demonstrating evidence of variable ionization (enhancement, ion source inertness, etc.), the method of quantification should be focused on in future studies.
Keywords: Forensic science, QuEChERS, Drug analysis, Benzodiazepines, Gas Chromatography–Mass Spectrometry, Biological samples
1. Introduction
Benzodiazepines constitute a large and important class of pharmaceuticals displaying antiepileptic, hypnotic, tranquillizing, anticonvulsant, sedative, muscle relaxant, and amnesic properties [1]. They have been shown to be useful in treating a variety of neurological problems such as anxiety, insomnia, agitation, seizures and muscle spasms, as well as alcohol withdrawal [2]. Due to their beneficial effects, benzodiazepines have become one of the most frequently prescribed anxiolytic drugs worldwide [3]. The benzodiazepine parent structure consists of a 1,4-diazepine fused with a benzene ring, which is termed as a 1,4-benzodiazepine, Fig. 1 [4]. As a synthetic drug having pharmacological properties, benzodiazepines are listed as a schedule IV drug in the United States.
Fig. 1.
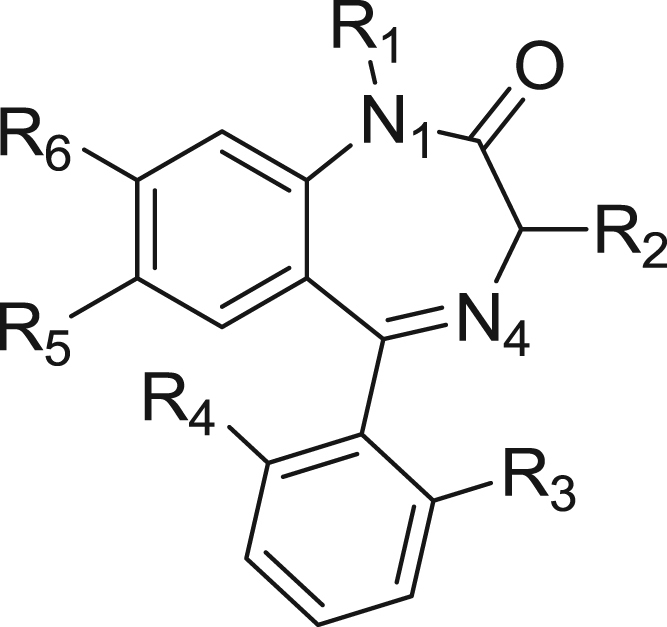
Parent structure of 1,4-benzodiazepine.
All benzodiazepines share the same mechanism of action, which is the modulation of γ-aminobutyric acid (GABA) uptake; the principle inhibitory neurotransmitter in the brain [2], [5], [6], [7]. Once bound, the benzodiazepine locks the GABA receptor into a conformation with much higher affinity for the neurotransmitter and enhances ion conduction, resulting in the reduction of neural excitability [2].
There are two main concerns associated with benzodiazepine detection: their elimination half-lives and their metabolism. While the original drug's duration in the system may not be long, their metabolites may remain in the system for an extended period of time. Benzodiazepines are mainly metabolized in the liver by cytochrome P450 isoenzymes which produce dealkylated and hydroxylated analogs of the parent compound; several of which still retain strong pharmacological properties, Fig. 2 [8]. Most of these resultant metabolites tend to exist as other commonly used and prescribed benzodiazepines.
Fig. 2.

Diazepam and its three main pharmacological metabolites [8].
Benzodiazepines are one of the most widely prescribed medications in the United States and are becoming more frequently encountered on the illicit market [9]. When used alone, benzodiazepines carry an extremely low risk of acute toxicity; however, they are often used with other drugs of abuse, which can enhance the toxic effects of benzodiazepines [10]. Due to their excessive utilization and their implication in many cases of multi-drug abuse, benzodiazepines are often found in fatal cases of drug intoxication. Their abuse is also on the increase with young illicit drug users. These young abusers are taking large doses which cause profound behavioral effects and can lead to dependence. Some benzodiazepines, such as flunitrazepam, are deliberately misused in case of chemical submission during sexual assault. The misuse and abuse of these drugs may increase the potential for experiencing negative drug interactions as well as the possibility of drug overdose. Given that benzodiazepines are widely used in clinical and forensic cases, the availability of rapid, sensitive, and selective analytical methods for their determination in biological fluids and pharmaceutical formulations is imperative [11], [12], [13].
Drug analysis of biological fluids (serum, plasma, urine) usually requires considerable preparation of the samples before they are injected into a chromatographic system for analysis [14]. The identification and confirmation of drugs of abuse requires an analytical technique that is highly sensitive and subjective of the different drugs.
The extraction of analytes from complex media is important because it isolates the analyte(s) of interest. Most of analytical methods attempt to minimize sample preparation steps to minimize costs and the time spent on the sample workup. Previous extraction methods for benzodiazepines include solid–phase extraction (SPE) and liquid–liquid extraction (LLE).
Current laboratory methods employ SPE sample preparation followed by liquid chromatography mass spectrometry (LC–MS). The use of SPE to isolate benzodiazepines from biological samples appears to be efficient, but this methodology carries along with it many disadvantages including irreversible adsorption of analytes on the packing, more complex method development, and batch-to-batch variability [15]. The utilization of LC–MS methods is also associated with various limitations, such as significant time and effort involved in sample preparation, low screening capacity for target contaminants, and insufficient capabilities for structural identification of non-target contaminants [16]. In addition to its limitations, one common concern with LC–MS analysis is ion suppression. Ion suppression is a matrix effect that negatively affects detection capability, and therefore precision and accuracy [17]. Some laboratory LC–MS methods also utilize direct injection of diluted samples. This often requires considerable instrumental maintenance [18], [19]. Without performing a sample preparation step there is a possibility for reduced data quality, which is of extreme concern in the field of Forensic Science.
Anastassiades and Lehotay developed the QuEChERS (“catchers”) method; which stands for quick, easy, cheap, effective, rugged, and safe [20]. The development of the QuEChERS method was designed to improve conventional sample preparation for multi-residue pesticide analysis. Researchers were looking for a simple, effective, and inexpensive way to extract and clean pesticide residues from the many varied sample matrices that worked with routinely. The QuEChERS methodology was found to be an effective alternative. The key to this new approach is the ability to amend the dispersive solid-phase extraction (d-SPE) sorbents. The dispersive act allows for the distribution of the salts to diffuse throughout the entire sample for a more thorough extraction. This research methodology focused on sorbents that assist in the clean-up of the biological matrix and extraction of benzodiazepines.
Since the development of the QuEChERS method, its application has been introduced to a variety of analytes and matrices. These other applications include the extraction of antibiotics [21], pharmaceuticals [22], and veterinary drugs [23], [24] in biological samples or food products. Very recently the QuEChERS method has caught the attention of the forensic chemistry community. The research represented currently has shown that this extraction method can be used for benzodiazepines, in biological matrices such as blood and urine.
2. Materials and methods
2.1. Chemicals and materials
Internal (cocaine-d3, 1000 ng/µL) and recovery (diazepam-d5, 1000 ng/µL) standards were purchased from Cerilliant® (Round Rock, TX). Cocaine-d3, while structurally dissimilar to benzodiazepines, was utilized as the internal standard due to its availability and its pKa, which is intermediate between the relatively wide ranges of pKa's for benzodiazepines. It also does not have any interfering masses with the target benzodiazepines, and should function well as a gas chromatography mass spectrometry (GC–MS) internal standard. Diazepam-d5 was employed as the recovery standard because it would mimic the behavior of the benzodiazepines throughout the extraction process.
Benzodiazepine standard stock solutions (of approximately 1000 ng/µL) were prepared from neat material purchased from Alltech® (Deerfield, IL) and Grace (Columbia, MD). All reagents (acetonitrile, ammonium hydroxide, and anhydrous magnesium sulfate) were obtained from Avantor™ Performance Materials, Inc. (Phillipsburg, NJ). Sodium chloride was obtained from BDH® Chemicals (Radnor, PA). All chromatographic consumables and graphitized carbon black (GCB) were obtained from Restek Corporation (Bellefonte, PA). All 50 mL and 1.7 mL centrifuge tubes along with all urine collection cups were purchased from Denville Scientific Incorporated (Metuchen, NJ).
2.2. The QuEChERS methodology
Previously developed methodology was employed for the sample preparation (both pre-dispersive and d-SPE) [24]. Pre-dispersive extraction began with 10 mL of sample (representative of 10 g water (18.2 MΩ), blood, defibrillated sheep's blood; or human urine) was pipetted into a 50 mL centrifuge tube. It should be noted that 10 mL is on the large side of a reasonable sample size, but it is expected that the sample size can be cut down pending initial results.
A selected benzodiazepine was added to a 10 mL sample along with a recovery standard (diazepam-d5). 10 mL of acetonitrile (ACN) was pipetted into the sample's 50 mL centrifuge tube. The sample was vortexed for 1 min on a fixed vortex mixer at maximum speed. The aqueous sample was then transferred into another 50 mL centrifuge tube containing nominally 4 g anhydrous magnesium sulfate (MgSO4; which helps bind large amounts of water) and nominally 1 g sodium chloride (NaCl; which increases the ionic strength of the aqueous phase and induces a phase separation). The sample was then directly vortexed for 1 min (note: this step prevents the formation of MgSO4 conglomerates [25]). Finally, the sample was centrifuged for 5 min at 3000 rpm. The organic layer was transferred from the 50 mL centrifuge tube to a screw capped vial and set aside for analysis. The d-SPE involved obtaining a 1 mL aliquot of the organic layer which was pipetted into a 1.8 mL centrifuge tube containing nominally 0.150 g anhydrous MgSO4 and nominally 0.025 g graphitized carbon black (GCB). The sorbents help remove residual water and remove matrix interferents for an improved clean-up. The sample was vortexed for 30 s, then centrifuged for 3 min at approximately 5000 rpm on an Eppendorf Centrifuge 5415C. The sample was transferred from the centrifuge tube to a screw cap vial and set aside for analysis. There were three rounds of extractions conducted for each sample (the reported results are averaged between the extractions).
2.3. Analysis
2.3.1. Chromatography
SPE along with LC–MS has been a typical method for the analysis of benzodiazepines because of their polarity and non-volatility. This, however, does not mean that benzodiazepines are not amendable to other chromatographic techniques. For this research study, benzodiazepines extracted via QuEChERS methodology were analyzed by GC–MS without derivatization. The detection of low concentrations (especially in forensics) is of significant interest since the determination of trace analytes is often the main objective. Based on the techniques advantages, GC–MS provided the sensitivity for these trace analytes; and also an improvement in chromatographic resolution compared to those appearing in LC–MS.
2.3.2. Quantification
Quantification was performed and compared using calibration standards involving both internal standard and method of standard additions (MSA). The internal standard was added to each sample analysis vial just prior to instrumental analysis. The internal standard quantification allowed for the use of a correction based upon the response factor (RF) of each target compound.
The use of MSA allows for more accurate concentration results, especially if there is a bias occurring due to the sample matrix [26]. For MSA quantification, standards were added to separate sample vials in increasing concentrations for each benzodiazepine prior to analysis.
2.3.3. GC–MS
Extracts were analyzed using an Agilent Technologies 7890A GC, coupled to a 5975C mass spectrometer. The inlet system was operated in splitless mode with a 1 µL injection volume. The system was equipped with a Restek SKY injection liner (drilled uniliner, hole near top; 4 mm×6.3 mm×78.5 mm). Helium was used as the carrier gas with a constant flow rate of 1 mL/min. Separation was performed on a Restek Rxi®-5Sil MS column (30 m×0.25 mm-ID×0.25 µm). The injector temperature was set to 250 °C and an oven temperature gradient was applied starting from 40 °C (1 min) to 340 °C (10 min) at a ramp rate of 20 °C/min. The mass spectrometer acquisition mode was set to scan and the acquisition frequency was 2.91 scans/s. The mass range was from 50 to 550 amu.
3. Results
Factors affecting quantification and recovery of benzodiazepines from varying matrices via pre-dSPE and d-SPE clean-ups were examined. Table 1 shows the benzodiazepines of interest used in this work. These analytes were chosen as they are suitable probes for evaluation of analytical methodology for a larger list of benzodiazepines. The analysis of the initial data indicated some concern with ion enhancement and shifts in the retention times of the target compounds. Fig. 3, Fig. 4 show the chromatograms of diazepam and medazepam, respectively, extracted from both water and blood matrices. The known concentrations in each of the samples were below the standard at 5 ng/µL. A noticeable difference in peak areas was observed and thought to be caused by the sample matrix. It was also observed that there was an increase in abundance of the extracted benzodiazepine from blood compared to water which was thought to be caused by ion enhancement, or another ion-source-related artifact. Another concern observed was a shift in the retention times, which appeared to be consistent and matrix-related (Table 2). It was also observed that the extractions of the blood samples eluted earlier than those from the water samples. Fig. 5 shows the chromatograms of flunitrazepam extracted from urine.
Table 1.
Benzodiazepines of interest.
| Benzodiazepine | Acronym | Brand name | pKa | Spiked concentration (ng/µL) | MRTDa (mg/kg-bw/day) |
|---|---|---|---|---|---|
| Clonazepam | CLON | Klonopin® | 1.5 | 2.98 | 0.133 |
| Diazepam | DIA | Valium® | 3.3 | 3.45 | 0.667 |
| Flunitrazepam | FLU | Rohypnol® | 1.5 | 3.30 | 0.0333 |
| Medazepam | MED | Nobrium, Rudotel® | 6.2 | 2.80 | n/a |
Maximum recommended therapeutic dose (MRTD) value for adults expressed in milligram/kilogram of body weight per day (mg/kg-bw/day) [27].
Fig. 3.

Chromatogram of diazepam (extracted ion: 256) illustrating the differences in retention time and abundance between water and blood samples from one extraction set.
Fig. 4.

Chromatogram of medazepam (extracted ion: 242) illustrating the differences in retention time and abundance between water and blood samples from one extraction set.
Table 2.
Average retention timea and retention time shifts of benzodiazepines in different matrices.
| Water | Blood | Urine | |
|---|---|---|---|
| Benzodiazepine | Avg. tr (min) | Avg. tr (min) | Avg. tr (min) |
| Diazepam | 14.089 | 14.081 | 14.062 |
| Flunitrazepam | 14.790 | 14.779 | 14.761 |
| Medazepam | 13.224 | 13.216 | 13.191 |
Average retention time includes the averages of both the pre-dispersive and the dSPE steps.
Fig. 5.

Chromatogram of flunitrazepam (extracted ion: 312) illustrating the difference in retention time in the urine samples from one extraction set.
Table 3 shows the average response factors (RFs) for each sample (clonazepam, diazepam, flunitrazepam, and medazepam) in each of the three matrices (water, blood, and urine). These average RF values show the intra-lab reproducibility of the replications. Fig. 6, Fig. 7 also display the retention time consistency of the internal standard in the different matrices.
Table 3.
Response factors and relative standard deviation of benzodiazepines of interest.
| Matrix | Extraction | RF |
|||
|---|---|---|---|---|---|
| Clonazepam | Diazepam | Flunitrazepam | Medazepam | ||
| H2O | Pre-dSPE | n/a | 6.38 | 5.03 | 4.03 |
| dSPE | n/a | 5.05 | 3.80 | 2.46 | |
| Blood | Pre-dSPE | 7.9 | 8.13 | 9.28 | 4.25 |
| dSPE | 8.5 | 8.48 | 9.06 | 3.98 | |
| Urine | Pre-dSPE | n/a | 4.15 | 3.68 | 2.26 |
| dSPE | n/a | 4.63 | 4.32 | 2.24 | |
| Avg. RF | 8.20 | 6.14 | 5.86 | 3.20 | |
| % RSD | 5.17 | 29.98 | 44.48 | 30.44 | |
Fig. 6.

Chromatogram of the internal standard (ISTD) in medazepam samples (extracted ion: 85) illustrating the differences in retention time and abundance in the water, blood, and urine matrices.
Fig. 7.

Chromatogram of internal standard (ISTD) throughout one entire urine extraction set (extracted ion: 85), illustrating the reproducibility and stability of the analysis.
Quantification and recovery data are shown in Table 4. Quantification was conducted by external standard, internal standard (response factor), and comparison of single-point peak areas. These quantifications displayed a trend of ion enhancement and thus an increase in recovery. In order to rule out ion enhancement, MSA quantification was conducted (Table 5).
Table 4.
Concentrations and percent recovery of unknowns based on various quantification methods.
| Sample | External STD |
Internal STD (RF) |
Single point |
|||
|---|---|---|---|---|---|---|
| Concentration (ng/µL) | Recovery (%) | Concentration (ng/µL) | Recovery (%) | Area | Recovery (%) | |
| Clonazepam | ||||||
| Blood | ||||||
| Pre-dSPE | 9.25 | 310 | 7.73 | 259 | 101,806 | 346 |
| dSPE | 9.54 | 320 | 8.10 | 272 | 105,068 | 357 |
| Diazepam | ||||||
| H2O | ||||||
| Pre-dSPE | 3.24 | 93 | 7.62 | 220 | 432,059 | 115 |
| dSPE | 3.26 | 94 | 4.84 | 140 | 434,786 | 115 |
| Blood | ||||||
| Pre-dSPE | 5.17 | 149 | 8.12 | 235 | 752,168 | 200 |
| dSPE | 6.28 | 182 | 8.47 | 245 | 938,183 | 249 |
| Urine | ||||||
| Pre-dSPE | 3.81 | 110 | 4.15 | 120 | 429,332 | 7.0 |
| dSPE | 4.42 | 128 | 4.63 | 134 | 517,114 | 6.4 |
| Flunitrazepam | ||||||
| H2O | ||||||
| Pre-dSPE | 2.78 | 84 | 5.73 | 173 | 137,063 | 189 |
| dSPE | 2.60 | 78 | 4.18 | 126 | 123,332 | 170 |
| Blood | ||||||
| Pre-dSPE | 8.38 | 253 | 10.85 | 328 | 562,382 | 777 |
| dSPE | 4.28 | 129 | 8.70 | 263 | 251,405 | 347 |
| Urine | ||||||
| Pre-dSPE | 2.77 | 83 | 3.68 | 111 | 120,620 | 1.8 |
| dSPE | 2.81 | 85 | 4.32 | 130 | 123,605 | 2.1 |
| Medazepam | ||||||
| H2O | ||||||
| Pre-dSPE | 1.74 | 62 | 3.84 | 137 | 492,037 | 56 |
| dSPE | 2.19 | 78 | 3.25 | 115 | 635,109 | 72 |
| Blood | ||||||
| Pre-dSPE | 3.16 | 112 | 4.32 | 154 | 941,579 | 108 |
| dSPE | 3.22 | 115 | 4.66 | 166 | 963,053 | 110 |
| Urine | ||||||
| Pre-dSPE | 1.45 | 51 | 2.26 | 80 | 453,900 | 16 |
| dSPE | 1.54 | 55 | 2.44 | 87 | 543,902 | 15 |
Table 5.
Concentrations and percent recovery of unknowns by MSA quantification.
| Sample | Conc. (ng/µL) | Recovery (%) |
|---|---|---|
| Clonazepam | ||
| Blood | ||
| Pre-dSPE | 0.89 | 30 |
| dSPE | 1.70 | 56 |
| Urine | ||
| Pre-dSPE | 8.98 | 301 |
| dSPE | 3.31 | 111 |
| Diazepam | ||
| H2O | ||
| Pre-dSPE | 1.09 | 31 |
| dSPE | 3.52 | 102 |
| Blood | ||
| Pre-dSPE | 1.81 | 52 |
| dSPE | 3.08 | 89 |
| Urine | ||
| Pre-dSPE | 2.95 | 85 |
| dSPE | 4.26 | 123 |
| Flunitrazepam | ||
| H2O | ||
| Pre-dSPE | 0.91 | 27 |
| dSPE | 2.72 | 82 |
| Blood | ||
| Pre-dSPE | 2.83 | 85 |
| dSPE | 2.13 | 64 |
| Urine | ||
| Pre-dSPE | 1.76 | 53 |
| dSPE | 0.43 | 13 |
| Medazepam | ||
| H2O | ||
| Pre-dSPE | 1.44 | 51 |
| dSPE | 1.45 | 51 |
| Blood | ||
| Pre-dSPE | 1.46 | 52 |
| dSPE | 2.71 | 96 |
| Urine | ||
| Pre-dSPE | 1.77 | 63 |
| dSPE | 3.92 | 140 |
4. Discussion
Initial research demonstrated the ability of the QuEChERS to be applied to the extraction of benzodiazepines in biological fluids. Also, the use of acetonitrile as the extraction solvent allows for an extract that is compatible with both GC–MS and LC–MS analyses. The use of the QuEChERS methodology allows for potential automation, which may yield less operator handling and higher sample throughput. It also easily allows for various combinations of clean-up salts and sorbents to be investigated in an automated fashion, which may allow for improved method development.
Currently, the initial data has not permitted the understanding of the matrix related effects. Although, it does demonstrate that ion enhancement is a possible explanation. This extraction method warrants replication as well as the investigation of other quantification methods. Along with MSA other quantification methods may be considered. Recovery standard single point quantification is a possible approach, although this is generally considered to be less desirable for accurate quantification and is not advisable for forensic studies. Another possible approach is to use matrix-matched calibration standards, similar to what is often used in food commodity analysis. This approach does require additional preparation of the standards, and may not be able to adequately reflect possible biases in different matrices (blood, urine, etc.) or possible biases between samples within the same matrix class.
Acknowledgments
Special thanks are dedicated to Agilent Technologies for instrumentation support and to Avantor™ Performance Materials, Inc. (formerly J.T. Baker) for supplementary funding. The authors would also like to thank Restek Corporation for chromatographic consumables and The Pennsylvania State University for research funding.
Footnotes
Peer review under responsibility of Xi'an Jiaotong University.

Contributor Information
Jessica L. Westland, Email: jlw1120@psu.edu.
Frank L. Dorman, Email: fld3@psu.edu, frank@peak-diagnostics.com.
References
- 1.Uddin M., Samanidou V., Papadoyannis I. Validation of SPE-HPLC determination of 1,4-benzodiazepines and metabolites in blood plasma, urine, and saliva. J. Sep. Sci. 2008;31:3704–3717. doi: 10.1002/jssc.200800342. [DOI] [PubMed] [Google Scholar]
- 2.Mercolini L., Mandrioli R., Amore M. Separation and HPLC analysis of 15 benzodiazepines in human plasma. J. Sep. Sci. 2008;31:2619–2626. doi: 10.1002/jssc.200800212. [DOI] [PubMed] [Google Scholar]
- 3.Uddin M., Samanidou V., Papadoyannis I. Development and validation of HPLC method for the determination of benzodiazepines and tricyclic antidepressants in biological fluids after sequential SPE. J. Sep. Sci. 2008;31:2358–2370. doi: 10.1002/jssc.200800079. [DOI] [PubMed] [Google Scholar]
- 4.Samanidou V., Uddin M., Papadoyannis I. Benzodiazepines: sample preparation and HPLC methods for their determination in biological samples. Bioanalysis. 2009;1:755–784. doi: 10.4155/bio.09.43. [DOI] [PubMed] [Google Scholar]
- 5.al-Hawasli H., al-Khayat M., al-Mardini M. Development of a validated HPLC method for the separation and analysis of a Bromazepam, Medazepam and Midazolam mixture, J. Pharm. Anal. 2012;2(6):484–491. doi: 10.1016/j.jpha.2012.05.001. [DOI] [PMC free article] [PubMed] [Google Scholar]
- 6.Jain R., Kumar Yadav R. Voltammetric behavior of sedative drug midazolam at glassy carbon electrode in solubilized systems. J. Pharm. Anal. 2012;2(2):123–129. doi: 10.1016/j.jpha.2011.11.008. [DOI] [PMC free article] [PubMed] [Google Scholar]
- 7.Gallager D. Functional importance of benzodiazepine binding in brain. Brain Res. Bull. 1980;5:833–838. [Google Scholar]
- 8.Mercolini L., Mandrioli R., Iannello C. Simultaneous analysis of diazepam and its metabolites in rat plasma and brain tissue by HPLC–UV and SPE. Talanta. 2009;80:279–285. doi: 10.1016/j.talanta.2009.06.074. [DOI] [PubMed] [Google Scholar]
- 9.United States Drug Enforcement Administration. Benzodiazepines. 〈http://www.justice.gov/dea/concern/benzodiazepines.html〉.
- 10.Longo L., Johnson B. Addiction: Part I. Benzodiazepines—side effects, abuse risk and alternatives. Am. Fam. Physicians. 2000;61(7):2121–2128. [PubMed] [Google Scholar]
- 11.Uddin M., Samanidou V., Papadoyannis I. Development and validation of an HPLC method for the determination of six 1,4-Benzodiazepines in pharmaceuticals and human biological fluids. J. Liq. Chromatogr. Relat. Tech. 2008;31:1258–1285. [Google Scholar]
- 12.McIntyre I., Syrjanen M., Crump K. Simultaneous HPLC gradient analysis of 15 benzodiazepines and selected metabolites in postmortem blood. J. Anal. Toxicol. 1993;17:202–207. doi: 10.1093/jat/17.4.202. [DOI] [PubMed] [Google Scholar]
- 13.Ferrara S., Tedeschi L., Frison G. Solid-phase extraction and HPLC–UV confirmation of drugs of abuse in urine. J. Anal. Toxicol. 1992;4:217–222. doi: 10.1093/jat/16.4.217. [DOI] [PubMed] [Google Scholar]
- 14.Casas M., Berrueta L., Gallo B. Solid-phase extraction of 1,4-benzodiazepines from biological fluids. J. Pharm. Biomed. Anal. 1993;11:277–284. doi: 10.1016/0731-7085(93)80018-v. [DOI] [PubMed] [Google Scholar]
- 15.Pawliszyn J., Lord H. Handbook of Sample Preparation. Wiley; Hoboken: 2012. pp. 53–79. [Google Scholar]
- 16.Sultan J., Gabryelski W. Structural identification of highly polar nontarget contaminants in drinking water by ESI-FAIMS-Q-TOF-MS. J. Anal. Chem. 2006;78:2905–2917. doi: 10.1021/ac060384x. [DOI] [PubMed] [Google Scholar]
- 17.Matuszewski B., Constanzer M., Chavez-Eng C. Strategies for the assessment of matrix effect in quantitative bioanalytical methods based on HPLC–MS/MS. Anal. Chem. 2003;75:3019–3030. doi: 10.1021/ac020361s. [DOI] [PubMed] [Google Scholar]
- 18.Andersson M., Gustavsson E., Stephanson N. Direct injection LC–MS/MS method for identification and quantification of amphetamine, methamphetamine, 3,4-methylenedioxyamphetamine and 3,4-methylenedioxymethamphetamine in urine drug testing. J. Chromatogr. B. 2008;861:22–28. doi: 10.1016/j.jchromb.2007.11.025. [DOI] [PubMed] [Google Scholar]
- 19.S. Snyder, B. Vanderford, R. Trenholm, et al., Endocrine disruptor and pharmaceutical analysis using direct-injection LC/MS/MS, Water Quality Technology Conference, 2003, pp. 2201–2218.
- 20.Lehotay S.J., Catches QuEChERS Method. Pesticide residues. Agri. Res. Mag. 2003;51(7) [Google Scholar]
- 21.Karageorgou E., Samanidou V. Development and validation according to European Union Decision 2002/657/EC of an HPLC-DAD method for milk multi-residue analysis of penicillins and amphenicols based on dispersive extraction by QuEChERS in MSPD format. J. Sep. Sci. 2011;34:1893–1901. doi: 10.1002/jssc.201100194. [DOI] [PubMed] [Google Scholar]
- 22.Plössl F., Giera M., Bracher F. Multiresidue analytical method using dispersive solid-phase extraction and gas chromatography/ion trap mass spectrometry to determine pharmaceuticals in whole blood. J. Chromatogr. A. 2006;1135:19–26. doi: 10.1016/j.chroma.2006.09.033. [DOI] [PubMed] [Google Scholar]
- 23.Martinez Vidal J., Frenich A., Aguilera-Luiz M. Development of fast screening methods for the analysis of veterinary drug residues in milk by liquid chromatography-triple quadrupole mass spectrometry. Anal. Bioanal. Chem. 2010;397:2777–2790. doi: 10.1007/s00216-009-3425-1. [DOI] [PubMed] [Google Scholar]
- 24.Stubbings G., Bigwood T. The development and validation of a multiclass liquid chromatography tandem mass spectrometry (LC–MS/MS) procedure for the determination of veterinary drug residues in animal tissue using a QuEChERS (QUick, Easy, CHeap, Effective, Rugged and Safe) approach. Anal. Chim. Acta. 2009;637:68–78. doi: 10.1016/j.aca.2009.01.029. [DOI] [PubMed] [Google Scholar]
- 25.Anastassiades M., Lehotay S., Stajnbaher D. Fast and easy multiresidue method employing acetonitrile extraction/partitioning and dispersive solid-phase extraction for the determination of pesticide residues in produce. J. AOAC Int. 2003;86:412–431. [PubMed] [Google Scholar]
- 26.Ellison S., Thompson M. Standard additions: myth and reality. The Analyst. 2008;133(8):992–997. doi: 10.1039/b717660k. [DOI] [PubMed] [Google Scholar]
- 27.U.S. Food and Drug Administration, FDA's Center for Drug Evaluation and Research, Office of Pharmaceutical Science, Informatics and Computational Safety Analysis Staff's Maximum Recommended Therapeutic Dose (MRTD) database. 〈http://www.fda.gov/aboutfda/centersoffices/cder/ucm092199.htm〉, 2009.