Abstract
Background & objectives:
Tumour protein p53 (TP53) is a stress sensitive transcription factor responsible for the control of cell survival and death to prevent from tumour formation. In vitro and animal studies have indicated that TP53 also responds to metabolic changes and influences metabolic pathways. This study was undertaken to determine the serum level of TP53 and its correlations with clinical and biochemical parameters in type 2 diabetes mellitus (T2DM) patients in comparison to non-diabetic control individuals.
Methods:
An observational study was conducted between December 2009 and November 2013 to evaluate TP53 serum level using ELISA. Cases (n=225) were defined as patients who were diagnosed with T2DM. Non-diabetic controls (n=255) were matched by age and sex. Multivariable modelling using logistic regression examined associations between clinical characteristics and TP53 level or T2DM predication was performed.
Results:
Serum TP53 level was significantly higher in T2DM patients as compared to non-diabetic healthy controls (1.69 vs 2.07 ng/ml, P <0.001). In T2DM patients, the level of TP53 increased with the age, duration of diabetes and waist-to-hip ratio (WHR) value. A logistic regression analysis revealed that increased serum TP53 level was significantly associated with family history of diabetes, age and WHR. Moreover, TP53, triglyceride and body mass index could be used to predict T2DM.
Interpretation & conclusions:
Our results suggest that TP53 may be linked with T2DM. The fluctuations of serum TP53 level may reflect metabolic and oxidative stress associated with chronic hyperglycaemia. Further studies need to be done to confirm these findings.
Keywords: Age, body mass index, diabetes duration, family history of diabetes, triglycerides, tumour protein 53, type 2 diabetes mellitus, waist-to-hip ratio
Tumour protein 53 (TP53) is a transcription factor that responds to various cellular stresses and regulates target genes involved in cell cycle arrest, apoptosis, senescence, DNA repair or metabolism1. TP53 is a phosphoprotein consisting of 393 amino acids containing transcriptional activation, DNA binding and oligomerization domains. In unstressed cells, TP53 exists as bound up with the ubiquitin ligase MDM2, which inhibits its transcriptional activity and promotes its degradation. However, genotoxic agents and stresses induce the TP53 protein phosphorylation and activate its transcriptional activity. This activation leads either to growth arrest, mostly at the G1/S phase, or to apoptosis and helps prevent cancer development1. It has also been demonstrated that tumour suppressive activity of TP53 is associated with metabolism alterations. TP53 was found to suppress glycolysis and promote oxidative phosphorylation in response to nutrient starvation and hypoxia2. Taking into consideration that TP53 induces changes in metabolism in response to various stresses, including oxidative stress, it has been postulated that TP53 may play a significant role in metabolic diseases such as diabetes and obesity. Type 2 diabetes mellitus (T2DM) covers a number of dysfunctions characterized by hyperglycaemia arising from the combination of insulin resistance, inadequate insulin secretion, and disorders in glucagon secretion. It is believed that insulin resistance and central obesity that coincide with T2DM lead to lipids abnormalities termed as diabetic dyslipidaemia.
Minamino et al3 demonstrated that excessive intake of calories led to the accumulation of oxidative stress in adipose tissue of mice with T2DM-like disease and promoted senescence-like changes, including an increased expression of TP53 and increased production of pro-inflammatory cytokines. Moreover, adipose tissue from individuals with T2DM also showed senescence-like features, confirming a role of TP53 in the regulation of insulin resistance in diabetes3.
The aim of this study was to determine the serum level of TP53 and its correlations with clinical and biochemical parameters in T2DM patients in comparison to non-diabetic control individuals. Using a multivariable logistic regression it was also evaluated as to which of these parameters was associated with increased TP53 level and whether TP53 together with other clinical and biochemical parameters could be useful in T2DM predication.
Material & Methods
A total of 480 unrelated Caucasian Polish adults, residents of Lodz region, hospitalized due to various internal disorders in the department of Internal Disease, Diabetology and Clinical Pharmacology of the Medical University of Lodz, Lodz, Poland, between December 2009 and November 2013 were enrolled in the study. They were categorized as T2DM group (n=225) and control group (n=255). Individuals were included if they were older than 18 yr and had T2DM. T2DM was diagnosed based on the American Diabetes Association criteria4 or using hypoglycaemic medication before hospitalization. Individuals from the control group had normal glucose level. Patients were excluded if they were younger than 18 yr, had other type of diabetes than T2DM, were mentally ill or had any severe illness such as malignancy, severe infection, liver cirrhosis, heart failure and toxin exposure or were unable to understand or provide informed written consent. T2DM patients were treated with oral hypoglycaemic drugs and /or insulin. Since the T2DM is associated with insulin resistance and central obesity, patients with dyslipidaemia were also included. The study protocol was reviewed and approved by the Ethics Committee of the Medical University of Lodz (decision no. RNN/230/09KE). Written informed consent was obtained from each patient before enrolment in the study.
Anthropometric and biochemical measurements: The height, body mass and waist and hip circumference were measured in the morning after an overnight fast. Body mass index (BMI) and waist-to-hip ratio (WHR) were calculated. Blood sample (15 ml) was collected in the morning after at least eight hours of overnight fasting. Serum levels of glucose [fasting plasma glucose (FPG)], glycated haemoglobin (HbA1c), total cholesterol (TC), high-density lipoprotein (HDL), low-density lipoprotein (LDL) and triglycerides (TG) were assessed using standard analytical methods. Serum was separated and stored at −80°C before analysis. The serum level of TP53 was determined as described previously5 in duplicate with competitive ELISA kits (Gen-probe, Diaclone, France) according to manufacturer's instructions.
Statistical analysis: Data were expressed as mean value±standard deviation in the case of normal distribution or as median with lower and upper quartiles in the case of data with non-normal distribution. Distribution of variables was assessed by the Shapiro–Wilk test. For comparison between the groups with and without T2DM, Student's t test was used in the case of data with normal distribution or the Mann–Whitney test in other cases. The correlations between TP53 level and each clinical parameter were calculated using the Spearman's rank correlation method. Multivariate analysis of clinical parameters was performed using logistic regression analysis. Backward elimination method was employed to select predictive variables. The linear nature of dependence between modeled variable and each predictor was checked by the likelihood ratio test (LR test). The goodness of fit was evaluated by LR test and Hosmer-Lemeshow test. The significance of logistic coefficients was checked by the Wald's test. The model prediction quality was assessed by 10-fold cross-validation method and subsequent receiver operating characteristic (ROC) curve for the learning and validation data with an area under the curve (AUCL/V) as a quality index. All analyses were conducted with STATISTICA 10.0 software (Statsoft, Tulsa, OK, USA).
Results
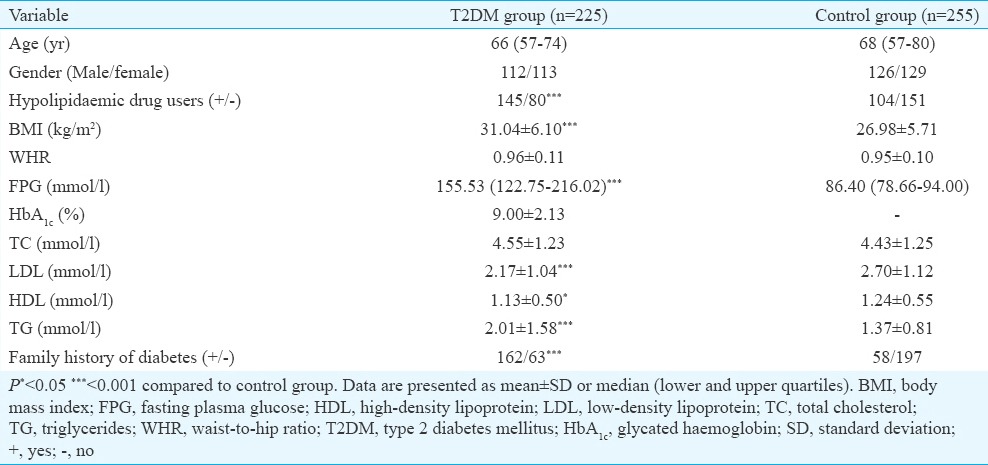
The mean age between T2DM patients (n=225, 65.53±12.18yr) and non-diabetic control (n=255, 67.08±14.23yr) individuals did not differ significantly. Both groups were matched for gender, and male/female ratios were 112/113 for T2DM group and 126/129 for control group. The age, gender and WHR distribution were not significantly different between T2DM and control groups. The significantly higher values of FPG, BMI and TG were observed in T2DM patients compared to controls. The level of HDL and LDL was significantly lower in T2DM patients. The mean percentage of HbA1c was 9.00±2.13 and the mean diabetes duration (yr) was 6.93±6.09 (Table I).
Table I.
Clinical and biochemical characteristics of the study population
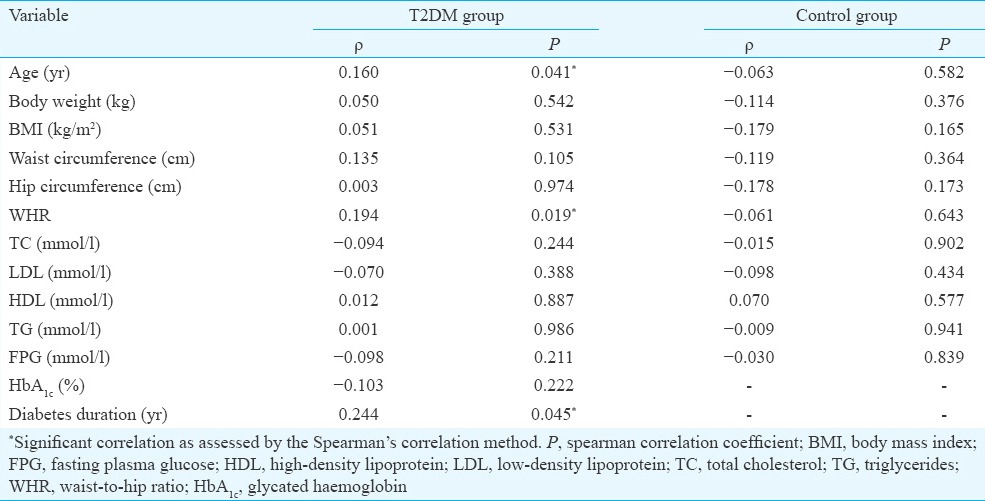
TP53 level and clinical parameters: Significantly higher level of TP53 was found in T2DM patients in comparison to non-diabetic control individuals (2.07, 1.22-3.06; vs 1.69, 1.24-2.48 ng/ml, P <0.001. Fig. 1). A subanalysis of those with coexisting dyslipidaemia did not reveal any significant differences of TP53 level between those treated and untreated with statins both in T2DM and control groups (data not shown). The results of univariate correlation analysis between TP53 level and clinical parameters of the patients are presented in Table II. No correlations between TP53 level and clinical parameters were found in the control group. In T2DM patients, the level of TP53 was positively associated with age (ρ=0.160, P =0.041), diabetes duration (ρ=0.224, P =0.045) and WHR (ρ=0.194, P =0.019).
Fig. 1.
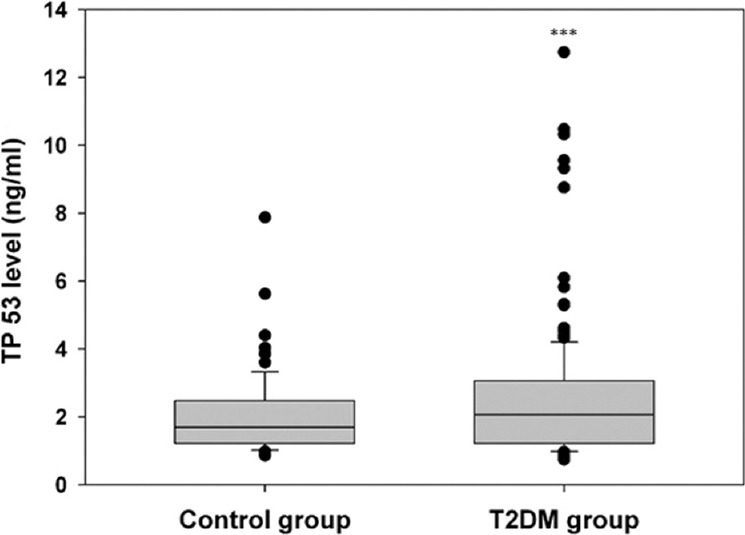
Boxplot of tumour protein p53 serum level in the control and type 2 diabetes mellitus groups. Middle line, median; box, interquartile range; whisker, range (including outliers). ***P<0.001 compared to control group.
Table II.
Univariate correlations of tumour protein p53 level and clinical parameters of type 2 diabetes mellitus (T2DM) patients and control individuals
Multivariate logistic regression analysis after adjusting for gender was employed to search for clinical and biochemical parameters which may be associated with increased level of TP53. Family history of diabetes [odds ratio (OR)=1.927, 95% confidence interval (CI) 1.079-3.441], age (OR=1.026, 95% CI 1.003-1.045) and WHR (OR=22.262, 95% CI 1.009-490.978) were found to be significantly linked with higher than mean serum TP53 level (Table III). ROC analysis revealed that family history of diabetes, ageing and increased WHR might be potential clinical parameters for searching individuals with increased serum TP53 level (AUCL=0.636; error 0.037 and AUCV=0.601; error 0.038) (Fig. 2).
Table III.
Multivariate logistic regression analysis for higher than mean serum tumour protein p53 level

Fig. 2.
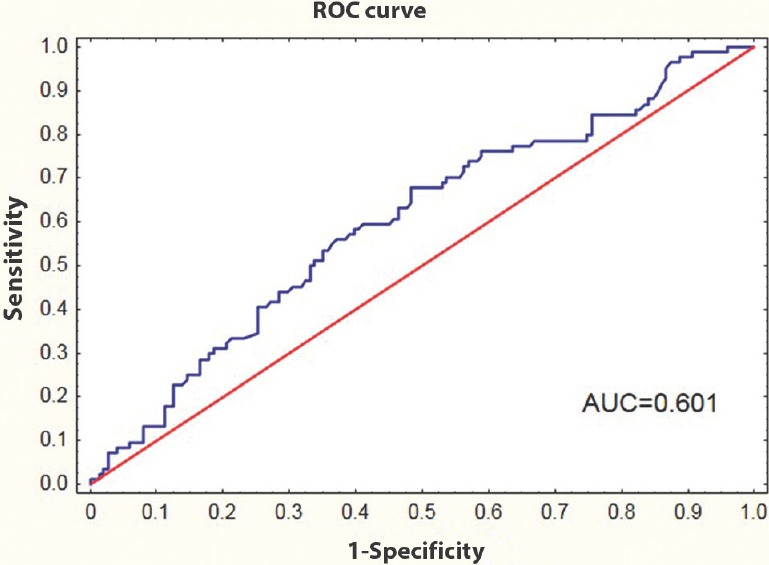
Receiver operating characteristic (ROC) curve for family history of diabetes, ageing and WHR; to separate individuals with high serum tumour protein p53 level from those with normal serum tumour protein p53 level. AUC, area under the curve.
TP53 level and prognosis of type 2 diabetes mellitus (T2DM): To find whether serum TP53 level together with other clinical and biochemical parameters can be a useful prognostic factor for T2DM, a multivariate logistic regression analysis was conducted. FPG, HbA1c and family history of diabetes directly associated with the diagnosis of T2DM were excluded from analysis. Both increased TP53 level (OR=1.271, 95% CI 1.024-1.579) and TG (OR=1.578, 95% CI 1.066-2.335) as well as overweight and obesity (>25 BMI) (OR=5.588, 95% CI 2.242-13.928) were considered to be predictive parameters for T2DM (Table IV). In addition, ROC analysis showed that TP53 level, TG and BMI might be used as potential markers for screening T2DM patients (AUCL=0.766; error 0.032 and AUCV=0.729; error 0.034) (Fig. 3).
Table IV.
Multivariate logistic regression analysis for type 2 diabetes mellitus prognosis

Fig. 3.
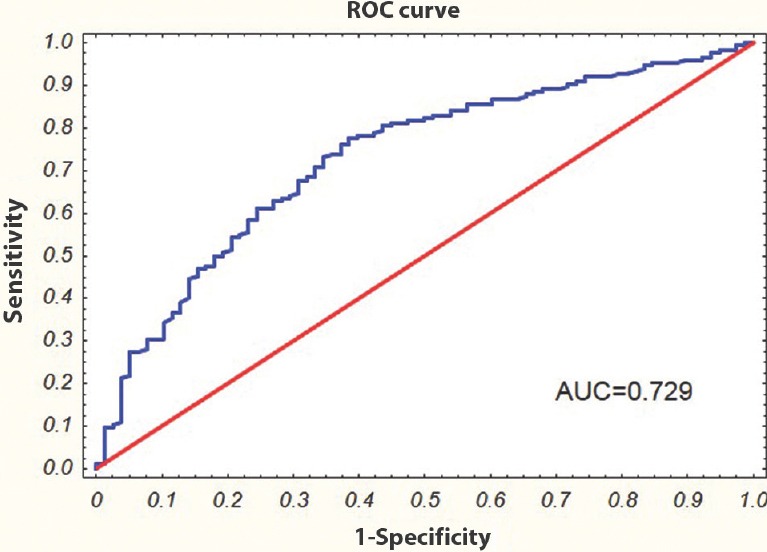
Receiver operating characteristic (ROC) curve for serum tumour protein p53 level, triglycerides, and body mass index; to separate type 2 diabetes mellitus patients from non-diabetic control subjects. AUC, area under the curve.
Discussion
It is well known that chronic hyperglycaemia induces mitochondrial dysfunction, production of advanced glycation end products (AGEs) and activation of protein kinase C, polyol and hexosamine pathways, which all together promote reactive oxygen species (ROS) overproduction and oxidative stress6. ROS evokes cellular damage as a result of oxidative lipids, proteins and DNA damage. These oxidative damages lead to the activation of TP53, which in turn regulates the expression of apoptotic, pro-inflammatory and metabolic genes. Therefore, hyperglycaemia-induced TP53-mediated changes in gene expression play a central role in the development of metabolic disturbances and vascular complications of diabetes6.
It was found in the present study that T2DM patients had significantly higher level of TP53 compared to controls. TP53 level increased with age and duration of diabetes. These results supported in vitro and animal studies that revealed that chronic hyperglycaemia was responsible for the increasing level of TP537,8,9. Keim et al7 found that high glucose levels caused apoptosis of mouse blastocyst and were associated with increased TP53 expression and proapoptotic factor (BAX). Barzalobre-Gerónimo et al8 demonstrated that apoptosis of pancreatic β cells (RINm5F) exposed to chronic high glucose was related with TP53 stabilization caused by decreased expression of Mdm2 and ubiquitin-dependent degradation of TP53. Orimo et al9 demonstrated that treatment of human endothelial cells with high glucose evoked TP53-mediated endothelial senescence as a result of decreased SIRT1 expression. SIRT1 has been reported to downregulate TP53 activity by its deacetylation9. It was reported that AGEs induced apoptosis of the human endothelial Eahy926 cells as a result of reduction of the SIRT1 level and the increase of TP53 level10. The only study performed on human regarding TP53 was conducted by Dincer et al11. They noted significantly lower serum level of TP53 in T2DM patients in comparison to patients with impaired glucose tolerance as well as to normoglycaemic individuals. Our results were in contrast. However, it should be noted that both number of T2DM patients and the level of control of diabetes (expressed as percentage of HbA1c) significantly discriminate our study from the analysis by Dincer et al11.
TP53 is known to be a regulator of various metabolic pathway i.e. represses metabolic pathways that support tumour development (such as glycolysis and the pentose phosphate) and enhances metabolic pathways that are considered anti-tumorigenic such as fatty acid oxidation12,13. Goldstein et al14 have reported that TP53 promotes the expression of gluconeogenesis-related genes and enhances hepatic glucose production using two consecutive high-throughput analyses in human liver-derived cells with varying TP53 statuses. The role of TP53 in the pathogenesis of obesity and T2DM has been extensively investigated3,15,16. Minamino et al3 showed that excessive calorie intake led to the accumulation of oxidative stress in the adipose tissue of mice with T2DM-like disease and promoted senescence-like changes, including increased expression of TP53 and increased production of pro-inflammatory cytokines. Homayounfar et al16 demonstrated that 12-wk high-fat diet in Wistar rats caused an increase of TP53 level in peripheral tissues including adipose, muscle and small intestine. Yokoyama et al17 found that a high-calorie diet increased endothelial expression of TP53 in mice organs/tissues. These findings indicate that diabetic conditions, such as hyperglycaemia and hyperinsulinaemia, lead to upregulation of TP53 expression in various tissues through mechanisms involving an increased oxidative stress. Our present results were in agreement with findings on animal models of diabetes and/or obesity and showed that T2DM patients had significantly higher level of TP53, which increased with T2DM duration and values of WHR. In addition, a multivariate modeling analysis revealed that family history of diabetes, age and WHR were factors which might predispose to high level of TP53. The limitation of the study was its observational design. Although many efforts were made to match controls to cases, it is possible that the control of extraneous variables may be incomplete.
In conclusion, TP53 level was significantly higher in T2DM patients compared to controls. In addition, high TP53 level was associated with age, family history and duration of diabetes and WHR. Serum TP53 together with metabolic parameters might be potential predictors for T2DM. Our results support the role of TP53 in age-related diseases, such as T2DM and obesity.
Acknowledgment
Authors thank all participants of this study, and acknowledge all nursing and laboratory workers of Maria Sklodowska-Curie's Provincial Specialist Hospital in Zgierz, for computing and laboratory support. This study was supported by the Grant 502-04-007 from the Medical University of Lodz. Partial support was provided by the Polish Society of Metabolic Disease.
Footnotes
Conflicts of Interest: None.
References
- 1.Vousden KH, Prives C. Blinded by the light: The growing complexity of p53. Cell. 2009;137:413–31. doi: 10.1016/j.cell.2009.04.037. [DOI] [PubMed] [Google Scholar]
- 2.Jones RG, Thompson CB. Tumor suppressors and cell metabolism: A recipe for cancer growth. Genes Dev. 2009;23:537–48. doi: 10.1101/gad.1756509. [DOI] [PMC free article] [PubMed] [Google Scholar]
- 3.Minamino T, Orimo M, Shimizu I, Kunieda T, Yokoyama M, Ito T, et al. A crucial role for adipose tissue p53 in the regulation of insulin resistance. Nat Med. 2009;15:1082–7. doi: 10.1038/nm.2014. [DOI] [PubMed] [Google Scholar]
- 4.Expert Committee on the Diagnosis and Classification of Diabetes Mellitus. Report of the expert committee on the diagnosis and classification of diabetes mellitus. Diabetes Care. 2003;26(Suppl 1):S5–20. doi: 10.2337/diacare.26.2007.s5. [DOI] [PubMed] [Google Scholar]
- 5.Sliwinska A, Rogalska A, Marczak A, Kasznicki J, Drzewoski J. Metformin, but not sitagliptin, enhances WP 631-induced apoptotic HepG2 cell death. Toxicol In Vitro. 2015;29:1116–23. doi: 10.1016/j.tiv.2015.04.019. [DOI] [PubMed] [Google Scholar]
- 6.Fiorentino TV, Prioletta A, Zuo P, Folli F. Hyperglycemia-induced oxidative stress and its role in diabetes mellitus related cardiovascular diseases. Curr Pharm Des. 2013;19:5695–703. doi: 10.2174/1381612811319320005. [DOI] [PubMed] [Google Scholar]
- 7.Keim AL, Chi MM, Moley KH. Hyperglycemia-induced apoptotic cell death in the mouse blastocyst is dependent on expression of p53. Mol Reprod Dev. 2001;60:214–24. doi: 10.1002/mrd.1080. [DOI] [PubMed] [Google Scholar]
- 8.Barzalobre-Gerónimo R, Flores-López LA, Baiza-Gutman LA, Cruz M, García-Macedo R, Ávalos-Rodríguez A, et al. Hyperglycemia promotes p53-Mdm2 interaction but reduces p53 ubiquitination in RINm5F cells. Mol Cell Biochem. 2015;405:257–64. doi: 10.1007/s11010-015-2416-0. [DOI] [PubMed] [Google Scholar]
- 9.Orimo M, Minamino T, Miyauchi H, Tateno K, Okada S, Moriya J, et al. Protective role of SIRT1 in diabetic vascular dysfunction. Arterioscler Thromb Vasc Biol. 2009;29:889–94. doi: 10.1161/ATVBAHA.109.185694. [DOI] [PubMed] [Google Scholar]
- 10.Li P, Zhang L, Zhou C, Lin N, Liu A. Sirt 1 activator inhibits the AGE-induced apoptosis and p53 acetylation in human vascular endothelial cells. J Toxicol Sci. 2015;40:615–24. doi: 10.2131/jts.40.615. [DOI] [PubMed] [Google Scholar]
- 11.Dincer Y, Himmetoglu S, Yalin S, Damci T, Ilkova H, Akcay T. Serum levels of p53 and cytochrome c in subjects with type 2 diabetes and impaired glucose tolerance. Clin Invest Med. 2009;32:E266–70. doi: 10.25011/cim.v32i4.6617. [DOI] [PubMed] [Google Scholar]
- 12.Goldstein I, Rotter V. Regulation of lipid metabolism by p53-fighting two villains with one sword. Trends Endocrinol Metab. 2012;23:567–75. doi: 10.1016/j.tem.2012.06.007. [DOI] [PubMed] [Google Scholar]
- 13.Maddocks OD, Vousden KH. Metabolic regulation by p53. J Mol Med (Berl) 2011;89:237–45. doi: 10.1007/s00109-011-0735-5. [DOI] [PMC free article] [PubMed] [Google Scholar]
- 14.Goldstein I, Yizhak K, Madar S, Goldfinger N, Ruppin E, Rotter V. p53 promotes the expression of gluconeogenesis-related genes and enhances hepatic glucose production. Cancer Metab. 2013;1:9. doi: 10.1186/2049-3002-1-9. [DOI] [PMC free article] [PubMed] [Google Scholar]
- 15.Rodrigues MR, Santo MA, Favero GM, Vieira EC, Artoni RF, Nogaroto V, et al. Metabolic surgery and intestinal gene expression: Digestive tract and diabetes evolution considerations. World J Gastroenterol. 2015;21:6990–8. doi: 10.3748/wjg.v21.i22.6990. [DOI] [PMC free article] [PubMed] [Google Scholar]
- 16.Homayounfar R, Jeddi-Tehrani M, Cheraghpour M, Ghorbani A, Zand H. Relationship of p53 accumulation in peripheral tissues of high-fat diet-induced obese rats with decrease in metabolic and oncogenic signaling of insulin. Gen Comp Endocrinol. 2015;214:134–9. doi: 10.1016/j.ygcen.2014.06.029. [DOI] [PubMed] [Google Scholar]
- 17.Yokoyama M, Okada S, Nakagomi A, Moriya J, Shimizu I, Nojima A, et al. Inhibition of endothelial p53 improves metabolic abnormalities related to dietary obesity. Cell Rep. 2014;7:1691–703. doi: 10.1016/j.celrep.2014.04.046. [DOI] [PubMed] [Google Scholar]


