Abstract
Aim:
Differential diagnosis of parenchymal thyroid diseases by gray-scale ultrasound is quite difficult for a radiologist as the findings are very similar to each other. In this study we aimed to assess some quantitative spectral Doppler parameters, resistivity index (RI), acceleration time (AT), and quantitative elastography [shear wave velocity (SWV)] together to show their reliability for differential diagnosis of parenchymal thyroid diseases.
Materials and Methods:
We retrospectively reviewed findings of 227 patients (179 females, 48 males) that underwent spectral Doppler ultrasound and acoustic radiation force impulse between October 2013 and March 2016. Ages of the patients were between 18 and 74 years (39.52 ± 12.67). Based on clinical and laboratory findings, patients were divided into five groups (N: Normal, EH: Early Hashimoto, H: Late Hashimoto, M: Nodular Thyroid Disease, HM: Hashimoto + Nodular Thyroid Disease). Detailed statistical analyses were done on parameters such as age, gender, volume information, and RI, AT (ms), SWV (m/s).
Results:
No significant effect of gender or volume on the differentiation of disease pattern (Chi-square test: P = 0.306, Kruskal-Wallis test: P = 0.290) was found in this study. RI (0.41 ± 0.06) and SWV values (1.19 ± 0.18 m/s) were the lowest. AT values (>55 ms) were the highest in EH group (area under the curve: 0.913). Existence of H decreased RI and SWV values, while it extended AT in a different thyroid disease.
Conclusion:
Thyroid parenchymal diseases could be classified and differentiated from each other by measuring RI, AT, and SWV values quantitatively. So, in suspicious cases, these parameters could be a reliable asset for differential diagnosis.
Keywords: Acoustic radiation force impulse imaging, elastography, Hashimoto disease, thyroid gland, ultrasonography
Introduction
Differential diagnosis in advanced stages of diffuse and nodular thyroid parenchymal diseases is quite difficult with gray-scale ultrasonography because findings are usually very similar to each other. Also, nodular changes in multinodular (M) form and a chronic autoimmune disease Hashimoto (H) could be seen together in clinical practice.[1] Actually, chronic autoimmune disease may show different radiologic characteristics depending on its stage: for early-stage disease (Early Hashimoto, EH) ultrasonography is done at the beginning, and for chronic-stage disease (Chronic Hashimoto, H) ultrasonography is done when the patient is under a medical treatment. Different pathologic stages during progression of the disease are hard to differentiate from each other with the conventional ultrasound (US).[2,3] Although there are many studies regarding radiological differential diagnosis of nodules (nodule–pseudo-nodule or benign–malignant nodule) in the literature, there are not enough studies on differential diagnosis of parenchymal changes in heterogeneous parenchyma of H, due to diffuse or other nodular parenchymal diseases with multinodular dysplasia.
In this study, in addition to conventional US examination, quantitative spectral Doppler parameters (resistivity index, RI and acceleration time, AT) and quantitative elastography values (shear wave speeds) were evaluated together to show their diagnostic capacity on differentiation of parenchymal thyroid diseases.
Materials and Methods
The study protocol was approved by Local Ethics Committee. We retrospectively reviewed the findings of 227 patients (179 females, 48 males) that underwent spectral Doppler US and acoustic radiation force impulse (ARFI) between October 2013 and March 2016. Ages of patients were between 18 and 74 years (39.52 ± 12.67). All the measurements of the patients were done by the same radiologist (D.Y. with 7 years of ARFI and Doppler US experience), who were blinded to all clinical and laboratory findings. All examinations were performed with the same system (Siemens ACUSON S2000, Siemens Healthcare, Erlangen, Germany). Total volume measurements of the thyroid lobes were done by Linear Transducer (9L4) after gray-scale examinations. We started Doppler US with the lowest pulse repetition frequency (PRF) value that causes artifacts and then increased PRF step by step (we performed all examinations within 700–1000 Hz) with medium wall filter. RI-AT values were obtained by measuring automatically from proximal segment of the first main parenchymal branch of the inferior thyroid artery. Then, with longitudinal examination, central poles of both lobes were evaluated and by using the ARFI-virtual touch quantification (VTQ) method, shear wave velocities (SWV, m/s) were measured. Mean values of five consecutive measurements were obtained for each localization. During elastographic study, areas with nodular or pseudo-nodular contents were excluded and the focus of the study was maintained on only more uniform areas. Gray-scale US combined with RI-AT-SWV were classified as multiparametric imaging.
Patients with normal thyroid gray-scale US findings (homogeneous parenchyma with regular normal echogenicity), normal thyroid function test, and normal auto-antibody levels were included in normal group, while patient with abnormal thyroid gray-scale US findings (heterogeneity, pseudo-nodular appearance with surrounding echogenic septations) and abnormal Doppler US findings were accepted as abnormal. According to these findings, after 2 years of follow-up, based on clinical, biochemical parameters [thyroid stimulating hormone (TSH), triiodothyronine (T3), thyroxine (T4), anti-thyroid peroxidase antibody (anti-TPO), thyroglobulin antibody (anti-Tg)], all the patients were divided into five different groups: control group (normal, N); first detected, early-untreated Hashimoto disease (EH); chronic Hashimoto patients that are under treatment and/or follow-up (H); multinodular parenchymal hyperplasia (M); and nodular hyperplasia with Hashimoto (HM). And all the data obtained from these groups were recorded.
Statistical method
All the data except demographic properties of the study group were analyzed statistically. Demographic data were excluded from this study because there was no significant relation between our study targets and demographic properties. Gray-scale findings, such as diffuse heterogeneity–diffuse nodularity or visual Doppler assessment such as vascularization degree or heterogeneity, were also excluded for their dependence on the operator and the subjectivity of the measurements.
First descriptive statistics of variables in the context of the data set is presented in assessment. Continuous variables are expressed by mean, standard deviation, while discrete variables are expressed by their frequency.
On comparisons, continuous normally distributed variables were evaluated by Student's t-test or analysis of variance. Abnormal variables were evaluated by Mann–Whitney U-test or Kruskal-Wallis H-test. Binary post hoc analyses were performed for comparisons that were found statistically significant in multigroup comparison analyses. Chi-square test was used for comparison of discrete variables. In order to determine the direction and strength of the relationship between two continuous variables, Pearson or Spearman correlation coefficient tests were used based on whether the data were distributed normally or not. In continuous variables, receive operator characteristics (ROC) analyses, area under the curve (AUC), sensitivity–specificity results were used for determination of cut-off values. Statistical Package for the Social Sciences, version 15 was used for analyses, and the results were compared to P < 0.05 level, with maintaining the level of confidence interval by 95%.
Results
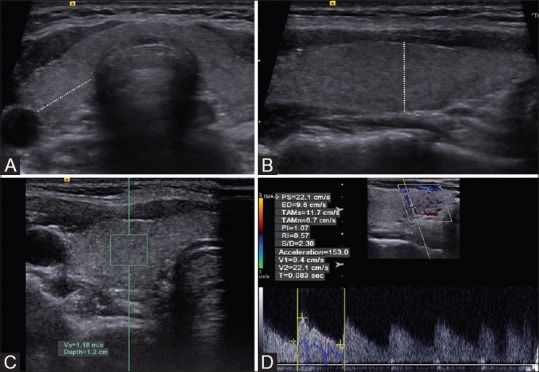
In statistical analysis, the evaluated parameters such as thyroid volume, RI, AT, and SWV values [Figure 1] that was determined by multiparametric US, age, and sex and descriptive statistics of the data set was compiled in Table 1.
Figure 1(A-D).

Radiological stages of the data obtainment (A) lateral, (B) longitudinal, and anteroposterior diameter measurements plans, (C) measurement of SWV on ARFI-VTQ window, (D) RI and AT measurements on spectral Doppler window
Table 1.
Assessments of the cases that were done by consideration of age, sex, thyroid gland volume, RI, AT, SWV values, and statistical analyses

No statistically significant difference was detected between the diagnostic groups by gender; no selectivity for diagnosis [Table 1]. Due to the abnormal distribution of continuous variables, correlation between them was done by Spearman's Rho correlation analyses. Weak but positive relationship was found between age and AT (%53), while a very weak and opposite relationship was determined between RI and AT (P < 0.05).
Because variables were also abnormally distributed between each group, Kolmogorov-Smirnov test, which is a nonparametric method, is used for determining possible differences between groups. Significant differences were found in age, RI, AT, and ARFI values between groups (P < 0.001), but no significant difference was detected in volume values (P > 0.05) [Table 1]. Bonferroni corrected Mann–Whitney test was used to see, which binary group shows significant differences, and the significance limit was reduced to 0.005 due to the 10 paired.
According to the age, there was a significant difference between N-EH, M-HM, and M-EH groups. Mean age of EH group was (52.15 ± 15.74 years) different than both N (36.31 ± 11.87 years) and M groups (36.95 ± 10.96 years). Also the mean age of HM group (45.41 ± 13.18 years) was higher than M group statistically.
There was no statistically significant difference between N-M, HM-H, HM-EH groups, in the evaluation of AT values (P > 0.005). AT values of EH group (70.00 ± 28.28) were significantly longer than N (27.35 ± 13.66), M (26.60 ± 11.74), and H (46.74 ± 12.09) groups. In addition to that, AT values were also significantly longer in H and HM groups (45.45 ± 15.65) than N and M groups.
When RI values were evaluated, HM (0.49 ± 0.05) and H (0.49 ± 0.05) groups had statistically lower values than N (0.56 ± 0.05) and M (0.58 ± 0.06) groups. SWV values of EH (1.19 ± 0.18) group were statistically lower than M (1.72 ± 0.33) and HM (1.64 ± 0.42) groups and values of M group (1.72 ± 0.33) were significantly higher than H group (1.45 ± 0.38). In thyroid diseases, presence of H decreased SWV, while presence of M increased SWV.
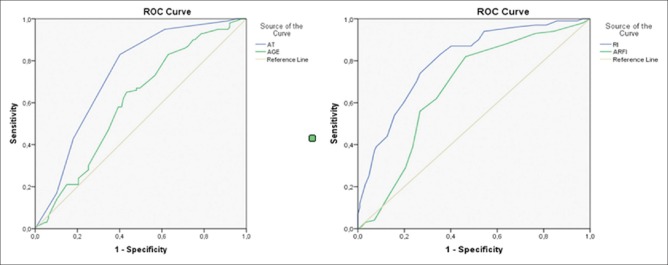
Results of ROC analysis were used for differentiation of groups due to measured values; AT values <35 ms with 0.76 sensitivity and −0.46 specificity and with 0.645 AUC is distinguishing for N group. In gray-scale, nodular parenchyma, AT values <35 ms (0.83 sensitivity, −0.60 specificity, and with 0.737 AUC) show that this pattern is compatible with M group. In these cases, the characteristic features for M group would be that SWV value being faster than 1.45 m/s (with 0.82 sensitivity, −0.54 specificity and with 0.669 AUC) and RI being bigger than 0.53 (0.83 sensitivity, −0.65 specificity, and 0.669 AUC) [Figure 2] (M group).
Figure 2.
ROC curves of specificity for M group concerning the AT, RI, ARFI values, and age
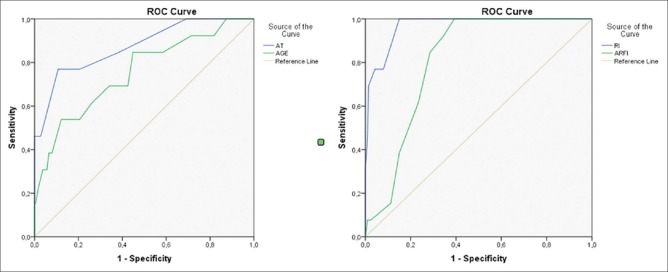
In the presence of rough heterogeneous parenchymal changes and pseudo-nodularity, M and H groups might be confusable. In these cases if AT is longer than 55 ms (0.77 sensitivity, −0.89 specificity, and 0.87 AUC), EH could be a more plausible diagnosis. Also in these cases, age, especially older than 56 (0.54 sensitivity, −0.88 specificity, and 0.753 AUC) and RI values lower than 0.48 (1 sensitivity, −0.85 specificity, and 0.968 AUC), is important for differential diagnosis of EH [Figure 3] (EH group).
Figure 3.
ROC curves of specificity for EH group concerning the AT, RI, ARFI values, and age
Parenchymal nodular changes and increase of SWV (1.72 ± 0.33) supported multinodular thyroid disease, but if AT was longer than 35 ms (0.73 sensitivity, −0.62 specificity, and 0.715 AUC), it showed that these cases are compatible with HM group.
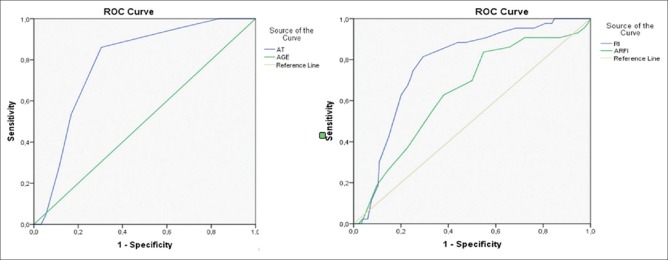
Differentiation between the characteristics of HM group and H group is also required, because pseudo-nodules that develop in H disease could be confusable with true nodules of HM group. The cases with AT values are between 35 and 55 ms and are compatible with H or HM group. The RI values also did not show statistically significant differences between H and HM groups, so only SWV and age variables could be used for differential diagnosis between these two groups. The cases with AT values were between 35 and 55 ms and SWV values were <1.75 (0.84 sensitivity, −0.45 specificity, and 0.641 AUC) in group H. For this reason, in cases that had rough nodular parenchymal structure, SWV was distinctive, while AT and RI values were not [Figure 4] (H group).
Figure 4.
ROC curves of specificity for H group concerning the AT, RI, ARFI values, and age
Discussion
Up-to-date, thyroid US was used for the measurement of parenchymal volume, assessing vascular characteristic of gland, screening, and differentiation of the nodules.[1,2] After the technologic developments about the transducers and high-resolution screens, gray scale and Doppler examinations became easier.[3,4] Additionally, SWV expensed the scope of elastography and enabled the quantitative examination of the nodules and the thyroid parenchyma with the help of hardware and software.[5,6,7,8,9,10] Besides thyroid nodule evaluations, many works reported value of elastography to detect changes of thyroid parenchyma in diseases that affects thyroid parenchyma including HT.[11,12]
There are a lot of new methods and developments in the area of Doppler US and US elastography in thyroid diseases and this information could be learned from proper literatures or guidelines.[13,14]
In this study, instead of finding new parameters for differentiation of benign–malignant nodules which have been investigated frequently, our aim was to produce a supportive method for differentiation of the thyroid parenchymal diseases which had similar visualization pattern that radiologists often encountered in daily practice. Thyroidal diseases are very common both in our country and worldwide. High prevalence of these diseases may generate certain risks in our population. Furthermore, in recent literatures, seronegative Hashimoto cases are seen in 13% of the population, and Hashimoto increases the risk of papillary thyroid malignancy. So these findings support that H should be differentiated from other chronic parenchymal diseases even in remission period.[15,16,17,18]
We had some limitations in our study. The same radiologist did all measurements. However, as the evaluation was done by quantitative features and statistical analysis, we believe that this situation did not have any negative effects on our study. On the contrary, we did not evaluate other diffuse parenchymal diseases such as Graves’ disease, silent thyroiditis, subacute thyroiditis, or lymphoma. But these diseases are less common and also they have more specific clinical and laboratory findings. Nevertheless, the distinctive properties of these diseases with our parameters may also be studied in larger series. As most of our patients had parenchymal disease instead of nodular thyroid pathologies, there was no indication of surgery in most of the cases. Hence, we were not able to obtain pathological finding and we used first clinical and laboratory data as baseline during 2-year follow-up period.
In commonly overlapping thyroid parenchymal diseases, evaluation parameters are complex and difficult. In order to ease the level of analysis, we established HM as a separate group, as it is the most common combination. Also, diagnostic blood chemistry such as thyroid function tests and autoantibodies were carried out and evaluated by endocrinologists. But analysis of these findings was not included because they were not among the intended objectives of our study.
Increased vascularity of thyroid gland parenchyma in Doppler US generally requires questioning of active parenchyma disease. On the contrary, visual vascularity evaluation is a subjective parameter. Quantitative parameters, including peak systolic values and diastolic flow, have been evaluated in various studies. However, reproducibility of these parameters was found low as they are mostly angle- and direction-dependent.[19,20]
Hence, we used parameters which are not angle- and direction-dependent, including AT and RI. We found one study that evaluated RI in the diagnosis of Hashimoto's disease, in which results were compatible with our study.[21]
The values we obtained from this study are supporting the current literature. As a conclusion, we believe that minor changes observed in our study are based on the differences of the devices and the measurement methods, which the radiologist used.[22,23]
Consequently, diseases that manifest similar gray-scale and color Doppler US findings and which affect thyroid parenchyma could be differentiated from each other quantitatively by measurement of RI, AT, and SWV values. In our study, the AT values should be <35 m/s in thyroid parenchyma, which has homogenous parenchyma and should show normal echogenicity pattern. If thyroid parenchyma had rough-nodular structure, and AT was <35 ms, RI was equal or more than 0.54 ms and SWV was equal or higher than 1.45 m/s, then diagnosis should be multinodular goiter. In the same group, if AT was between 35 and 55 ms, and RI was <0.54 ms, then the diagnosis should be HM. The most important parameter for differentiation of HM and pseudo-nodular structure of H with rough and heterogeneous parenchyma was SWV values being <1.75 m/s in H group. Differentiation of EH group was easier than other groups, with the help of long AT (>55 ms), low RI (<0.48), and low SWV (<1.55 m/s) values. In order to facilitate the readers to follow the results more conveniently, all the data were summarized and enrolled in Table 2.
Table 2.
Distinctive parameters for each group

In the light of these parameters, early and chronic Hashimoto disease, nodular hyperplastic thyroid diseases, or overlaps of these diseases could be differentiated from normal group or isolated forms of diseases. Also, quantitative data could be obtained for supporting clinical laboratory findings.
In conclusion, apart from subjective gray-scale US findings, parenchymal thyroid disease might be further classified with the aid of spectral Doppler US and quantitative ARFI elastography measurements, especially in suspicious cases (differentiation of senile parenchymal changes and chronic Hashimoto disease, diagnosis of autoantibodies negative Hashimoto disease, differentiation of pseudo-nodular structure from multinodular structure); diagnosis and follow-up could be done with more reliable parameters. We believe that the algorithm we used or similar ones could be considered in daily practice.
Financial support and sponsorship
Nil.
Conflicts of interest
There are no conflicts of interest.
References
- 1.Liang XN, Guo RJ, Li S, Zheng ZM, Liang HD. Binary logistic regression analysis of solid thyroid nodules imaged by high-frequency ultrasonography, acoustic radiation force impulse, and contrast-enhanced ultrasonography. Eur Rev Med Pharmacol Sci. 2014;18:3601–10. [PubMed] [Google Scholar]
- 2.Russ G, Leboulleux S, Leenhardt L, Hegedüs L. Thyroid incidentalomas: Epidemiology, risk stratification with ultrasound workup. Eur Thyroid J. 2014;3:154–63. doi: 10.1159/000365289. [DOI] [PMC free article] [PubMed] [Google Scholar]
- 3.Nam-Goong IS, Kim HY, Gong G, Lee HK, Hong SJ, Kim WB, et al. Ultrasonography-guided fine-needle aspiration of thyroid incidentaloma: Correlation with pathological findings. Clin Endocrinol. 2004;60:21–8. doi: 10.1046/j.1365-2265.2003.01912.x. [DOI] [PubMed] [Google Scholar]
- 4.Sarkis LM, Norlen O, Aniss A, Watson N, Delbridge LW, Gill AJ, et al. The Australian experience with the Bethesda classification system for thyroid fine needle aspiration biopsies. Pathology. 2014;46:592–5. doi: 10.1097/PAT.0000000000000168. [DOI] [PubMed] [Google Scholar]
- 5.Ma BY, Parajuly SS, Ying SX, Lan PY. Application of shear wave elastography in fine needle aspiration biopsy for thyroid nodule. J Pak Med Assoc. 2014;64:954–7. [PubMed] [Google Scholar]
- 6.Liu BX, Xie XY, Liang JY, Zheng YL, Zhou LY, Lu MD, et al. Shear wave elastography versus real time elastography on evaluation thyroid nodules: A preliminary study. Eur J Radiol. 2014;83:1135–43. doi: 10.1016/j.ejrad.2014.02.024. [DOI] [PubMed] [Google Scholar]
- 7.Woliński K, Szczepanek-Parulska E, Stangierski A, Gurgul E, Rewaj-Losyk M, Ruchala M, et al. How to select nodules for fine-needle aspiration biopsy in multinodular goitre. Role of conventional ultrasonography and shear wave elastography – A preliminary study. Endokrynol Pol. 2014;65:114–8. doi: 10.5603/EP.2014.0016. [DOI] [PubMed] [Google Scholar]
- 8.Jung WS, Kim JA, Son EJ, Youk JH, Park CS. Shear wave elastography in evaluation of cervical lymph node metastasis of papillary thyroid carcinoma: Elasticity index as a prognostic implication. Ann Surg Oncol. 2015;22:111–6. doi: 10.1245/s10434-014-3627-4. [DOI] [PubMed] [Google Scholar]
- 9.Szczepanek-Parulska E, Woliński K, Stangierski A, Gurgurl E, Rewaj-Losyk M, Majewski P, et al. Comparison of diagnostic value of conventional ultrasonography and shear wave elastography in the prediction of thyroid lesions malignancy. PLoS One. 2013;8:e81532. doi: 10.1371/journal.pone.0081532. [DOI] [PMC free article] [PubMed] [Google Scholar]
- 10.Monpeyssen H, Tramalloni J, Poirée S, Hélénon O, Correas JM. Elastography of the thyroid. Diagn Interv Imaging. 2013;94:535–44. doi: 10.1016/j.diii.2013.01.023. [DOI] [PubMed] [Google Scholar]
- 11.Calvete AC, Mestre JD, Gonzalez JM, Martinez ES, Sala BT, Zambudio AR. Acoustic radiation force impulse imaging for evaluation of the thyroid gland. J Ultrasound Med. 2014;33:1031–40. doi: 10.7863/ultra.33.6.1031. [DOI] [PubMed] [Google Scholar]
- 12.Fukuhara T, Matsuda E, Endo Y, Donishi R, Izawa S, Fujiwara K, et al. Impact of fibrotic tissue on shear wave velocity in thyroid: An ex vivo study with fresh thyroid specimens. Biomed Res Int 2015. 2015 doi: 10.1155/2015/569367. 569367. [DOI] [PMC free article] [PubMed] [Google Scholar]
- 13.Cosgrove D, Piscaglia F, Bamber J, Bojunga J, Fink M, Sporea I, et al. EFSUMB guidelines and recommendations on the clinical use of ultrasound elastography. Part 2: Clinical applications. Ultraschall Med. 2013;34:238–53. doi: 10.1055/s-0033-1335375. [DOI] [PubMed] [Google Scholar]
- 14.Bamber J, Cosgrove D, Dietrich CF, Bojunga J, Fink M, Sporea I, et al. EFSUMB guidelines and recommendations on the clinical use of ultrasound elastography. Part 1: Basic principles and technology. Ultraschall Med. 2013;34:169–84. doi: 10.1055/s-0033-1335205. [DOI] [PubMed] [Google Scholar]
- 15.Guclu F, Ozmen B, Kirmaz C, Kafesciler SO, Degirmenci PB, Taneli F, et al. Down-regulation of the auto-aggressive processes in patients with hypothyroid Hashimoto's thyroiditis following substitutive treatment with L-thyroxine. Eur Cytokine Netw. 2009;20:27–32. doi: 10.1684/ecn.2009.0147. [DOI] [PubMed] [Google Scholar]
- 16.Anderson L, Middleton WD, Teefey SA, Reading CC, Langer JE, Desser T, et al. Hashimoto thyroiditis: Part 1, sonographic analysis of the nodular form of Hashimoto thyroiditis. AJR Am J Roentgenol. 2010;195:208–15. doi: 10.2214/AJR.09.2459. [DOI] [PubMed] [Google Scholar]
- 17.Schmidt M, Voell M, Rahlff I, Dietlein M, Kobe C, Faust M, et al. Long-term follow-up of antithyroid peroxidase antibodies in patients with chronic autoimmune thyroiditis (Hashimoto's thyroiditis) treated with levothyroxine. Thyroid. 2008;18:755–60. doi: 10.1089/thy.2008.0008. [DOI] [PubMed] [Google Scholar]
- 18.Antonelli A, Ferrari SM, Corrado AD, Domenicantonio A, Fallahi P. Autoimmune thyroid disorders. Autoimmun Rev. 2015;14:174–80. doi: 10.1016/j.autrev.2014.10.016. [DOI] [PubMed] [Google Scholar]
- 19.Donkol RH, Nada AM, Boughattas S. Role of color Doppler in differentiation of Graves’ disease and thyroiditis in thyrotoxicosis. World J Radiol. 2013;5:178–83. doi: 10.4329/wjr.v5.i4.178. [DOI] [PMC free article] [PubMed] [Google Scholar]
- 20.Hari Kumar KV, Pasupuleti V, Jayaraman M, Abhyuday V, Rayudu BR, Modi KD. Role of thyroid Doppler in differential diagnosis of thyrotoxicosis. Endocr Pract. 2009;15:6–9. doi: 10.4158/EP.15.1.6. [DOI] [PubMed] [Google Scholar]
- 21.Sarikaya B, Demirbilek H, Akata D, Kandemir N. The role of the resistive index in Hashimoto's thyroiditis: A sonographic pilot study in children. Clinics (Sao Paulo) 2012;67:1253–7. doi: 10.6061/clinics/2012(11)05. [DOI] [PMC free article] [PubMed] [Google Scholar]
- 22.Sporea I, Sirli R, Bota S, Vlad M, Popescu A, Zosin I. ARFI elastography for the evaluation of diffuse thyroid gland pathology: Preliminary results. World J Radiol. 2012;4:174–8. doi: 10.4329/wjr.v4.i4.174. [DOI] [PMC free article] [PubMed] [Google Scholar]
- 23.Sporea I, Vlad M, Bota S, Sirli RL, Danila M, Zosin I, et al. Thyroid stiffness assessment by acoustic radiation force impulse elastography (ARFI) Ultraschall Med. 2011;32:281–5. doi: 10.1055/s-0029-1246048. [DOI] [PubMed] [Google Scholar]


