Abstract
In medical X-ray Computed Tomography (CT), the use of two distinct X-ray source spectra (energies) allows dose-reduction and material discrimination relative to that achieved with only one source spectrum. Existing dual-energy CT methods include source kVp-switching, double-layer detection, dual-source gantry, and two-pass scanning. Each method suffers either from strong spectral correlation or patient-motion artifacts. To simultaneously address these problems, we propose to improve CT data acquisition with the Grating Oriented Line-wise Filtration (GOLF) method, a novel X-ray filter that is placed between the source and patient. GOLF uses a combination of absorption and filtering gratings that are moved relative to each other and in synchronization with the X-ray tube kVp-switching process and/or the detector view-sampling process. Simulation results show that GOLF can improve the spectral performance of kVp-switching to match that of dual-source CT while avoiding patient motion artifacts and dual imaging chains. Although significant flux is absorbed by this pre-patient filter, the proposed GOLF method is a novel path for cost-effectively extracting dual-energy or multi-energy data and reducing radiation dose with or without kVp switching.
Keywords: Dual-energy CT, KVp-switching, Energy-discriminating CT, Grating oriented line-wise filtration (GOLF)
1 Introduction
Since its invention in 1971, X-ray CT has gone through major performance-improving transitions [1, 2]. One is from single-slice fan-beam CT to multi-slice/cone-beam spiral CT, dramatically reducing patient scan times and adding longitudinal dimension to CT images [3–5]. A transition currently in progress is to enable X-ray energy-discrimination, adding a spectral dimension to CT images [6, 7]. CT energy discrimination allows monochromatic imaging and material decomposition to be performed, reducing X-ray radiation dose and facilitating a number of important applications [6, 8, 9]. This emerging field will mature in time and grow in importance to the clinical world [10–13].
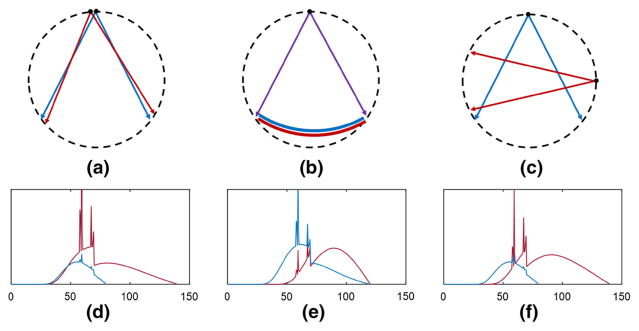
Current energy discriminating methods include kVp-switching [14], double-layer detection [15], dual-source gantry [16], and simplistic two-pass scanning. Simple source-detector sketches for these systems are illustrated in Fig. 1a–c respectively. Here we consider neither two-pass scanning (because of its triviality and time delay) nor CT with photon-counting detectors (because of the current high cost and immaturity of that detector technology). With kVp-switching, the X-ray source rapidly alternates between low kVp and high kVp during a scan so that low and high-energy data are collected nearly simultaneously and at nearly the same gantry angle. With double-layer detection, a single high-kVp spectrum is emitted. Low-energy X-rays are predominantly collected by a first detector layer while high-energy X-rays are detected by both the first and second layers. These two methods each use a single X-ray source with fixed X-ray filtration. In contrast, the dual-source gantry uses separate low and high-energy imaging subsystems with associated sources operating at low and high kVp settings. The two X-ray sources are independent and use different X-ray filters so that the emitted low and high-energy X-ray spectra can be individually shaped and better separated.
Fig. 1.
Dual-energy CT systems with a kVp-switching, b double-layer detector, and c dual-source technologies respectively. Graphs d–f show the pre-patient low and high-energy X-ray spectra for a–c respectively, with blue for low energy and red for high energy X-rays. Horizontal axes in d–f show energy (keV) (Color figure online)
Figure 1d–f show simulations of typical low-energy and high-energy X-ray spectra, as they would be detected with an “air shot” for the respective systems in Fig. 1a–c. With kVp switching, Fig. 1d shows that the detected low and high spectra differ mainly in the high energies and that there is no spectral overlap at energies above the low kVp energy limit. With a double-layer detector, Fig. 1e shows that the low energies are predominantly detected by the first layer. Fig. 1f shows that the dual-source system has the largest spectral difference because (for example) a Tin filter with its associated K-edge can be used with just the high-kVp source to attenuate the low spectral energies. This is not possible with conventional kVp switching. However, a dual-source CT system is much more expensive and, because the two sources are large and therefore at very different gantry angles, there is temporal discrepancy between low and high-energy data acquisitions. Breath, heart beating and patient motion will cause artifacts in reconstructed images, compromising material decomposition and monochromatic imaging [17].
To improve the spectral separation with single-source CT, we propose the Grating Oriented Line–wise Filtration (GOLF) method to rapidly alternate between two X-ray filters. As discussed in more detail below, GOLF combines an absorption grating and a filter grating in front of an X-ray source, and moves one grating with respect to the other for a nearly instantaneous filter change. In one form of GOLF, the relative motion is small and can be synchronized with source kVp-switching and/or detector-view sampling for collection of well-aligned dual-energy datasets. One of the gratings can be moved by a high-precision manipulator such as a piezoelectrical motor for rapid oscillation. If the rapid grating motion can be made practical, this vibrational GOLF may be readily integrated with or even retrofitted with current CT scanners. GOLF can also provide dual-spectrum imaging without source kVp-switching, but the limited selectivity of X-ray filters limits the achievable spectral separation.
Our GOLF technology is related to, but distinct from, the multiple-aperture device (MAD) technology developed by Stayman et al. [18]. Both GOLF and MAD are for CT, but GOLF is for X-ray spectral modulation while MAD is for X-ray intensity (fluence-field) modulation (FFM); i.e., as a dynamic bowtie attenuator that is not intended to alter the X-ray spectrum. The MAD [19] uses two interfering absorption gratings such that small relative grating motions will change the output spatial (fan) intensity distribution as desired during a scan. They describe a design process to yield a MAD device that changes the X-ray intensity field from an initial source distribution to a more desirable target distribution as a function of CT gantry angle. A tungsten laser sintering process is utilized to make a MAD, and it was integrated into an X-ray imaging platform. In [19], the MAD was numerically and experimentally evaluated against traditional bowtie attenuators with good results. The mechanical structure of a MAD and the proposed GOLF apparatus are similar, and this implies that the GOLF gratings can be successfully manufactured. However, a MAD in [19] involves low frequency motions associated with CT gantry rotation rates while GOLF demands higher frequency motions associated with the detector view rate. The development of a vibrational grating-movement system for GOLF is a challenge that is partially addressed here.
The reminder of the paper is organized as follows. In Sect. 2, we describe technical details of the proposed vibrational GOLF method and discuss an alternative rotational method. In Sect. 3, we show via numerical simulations that (1) properly sized GOLF gratings cause no significant degradation of CT system resolution, and (2) that the CNR (contrast-to-noise ratio) performance of GOLF is better than normal kVp-switching, approaching that of dual-source CT systems. We then investigate the feasibility of vibrational GOLF. In Sect. 4, we discuss relevant issues, potential extensions and draw conclusions.
2 GOLF Methods and Technical Details
2.1 Vibrational GOLF with Dual-Energy CT
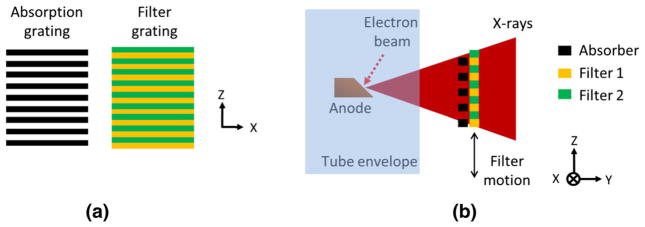
Vibrational GOLF uses a thin-sheet absorption grating and a thin-sheet filter grating, as shown in Fig. 2a. The gratings are overlaid and placed in the X-ray beam at the tube output, as shown in Fig. 2b. The absorption grating consists of interlaced bars and open slits, with the bars made of X-ray absorbing material such as Gold so that incident X-rays pass only through the open slits. The filter grating consists of interlaced type-1 and type-2 filtering strips with the two types chosen to yield significantly different filtered X-ray spectra. The absorption and filter gratings are periodic and matched so that either of the two interlaced filters can be imposed on the entire X-ray beam by shifting the filter grating by only one-half period relative to the absorption grating. The grating period is typically smaller than the X-ray source spot size. The purpose of the absorption grating is to provide a place for one of the interlaced filters to hide (out of the X-ray beam), while the other filter intersects the X-ray beam. Figure 2b shows the filter grating as the moved grating and places it after the absorption grating on the X-ray path. However, either grating or both of them can be moved. It may be most practical to move the one with the least mass.
Fig. 2.
Vibrational GOLF method for dual-energy CT. a Matched absorption and filter gratings, b Grating placements relative to the X-ray tube
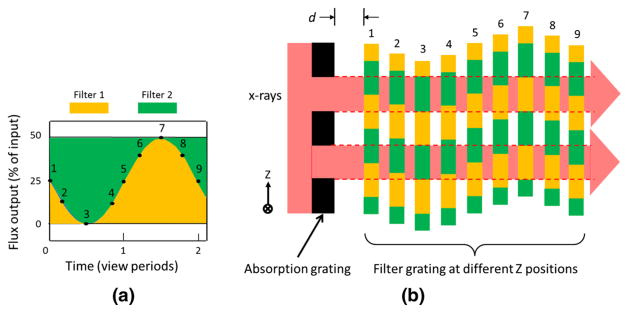
When used with kVp-switching, GOLF can improve the spectral separation by placing a high-pass filter in the beam when the tube voltage is high, and a low-pass filter in the beam when the tube voltage is low. Contemporary kVp-switching toggles the tube voltage at the end of every detector view period. Figure 3 shows how GOLF operates when the absorption grating is stationary and the filter grating is moved. Figure 3a shows a plot of the flux output and composition versus time, where sinusoidal displacement is assumed. This displacement waveform is realistic given the desired rapid detector view rate (~1 kHz or more) and the inertia of the grating assembly. Figure 3b shows relative Z (vertical) positions of the absorption and filter gratings associated with numbered times in Fig. 3a. In this case, the filter moves only in the Z direction, while the distance between the absorption and filter gratings, d, is held constant as in positon 1. The green and yellow areas represent low-pass and high-pass filtering, respectively. At position 3, all X-rays that pass the absorption grating are low-pass filtered while at position 7, all X-rays are high-pass filtered. At all other filter positons, the output X-ray spectrum is a mix of low- and high-pass filtered kVp switching spectra. Integration of the X-ray flux occurs over the detector view period, and the changing spectra yields spectral blur and reduced high and low spectral separation. Maximum separation of the low and high GOLF output spectra is achieved by setting the filter displacement frequency to one-half of the detector view rate and aligning filter positions 1 and 5 with the start of low-kVp and high-kVp views, respectively.
Fig. 3.
GOLF stationary absorption and moving filter gratings with sinusoidal filter motion. a Graph of filter output flux and filter composition versus time, and b Sequence of filter Z-axis positions associated with numbered times in (a). The X-rays flow from left to right with a constant absorption-filter separation, d
In the GOLF example of Fig. 3b, the absorption and filter gratings have the same spatial period, their duty cycles are both 50%, and the peak-to-peak filter displacement is ½ period. However, other duty cycles and peak-to-peak displacements may be valuable. Some kVp-switching systems may use long view periods for the low-energy spectrum and short ones for the high-energy spectrum because the X-ray tube generates much less X-ray flux at low voltage than it does at high voltage for the same anode current. For such a system, it would be beneficial to lengthen the low-pass filter exposure and shorten the high-pass exposure.
The spectral blur resulting from a sinusoidal filter motion can be reduced by decreasing the absorption-grating slit duty cycle. Figure 4 shows a GOLF arrangement similar to that in Fig. 3, but with a significantly reduced absorption duty cycle. The filter grating and its sinusoidal peak-to-peak motion are unchanged. With a narrower absorption slit, the filter edges spend less time traversing the slits, meaning that each detector view integrates less incorrectly filtered X-ray flux. However, the absorption-grating output flux is directly proportional to the absorption-grating duty cycle. Therefore, reducing the duty cycle improves spectral separation but reduces total output flux.
Fig. 4.
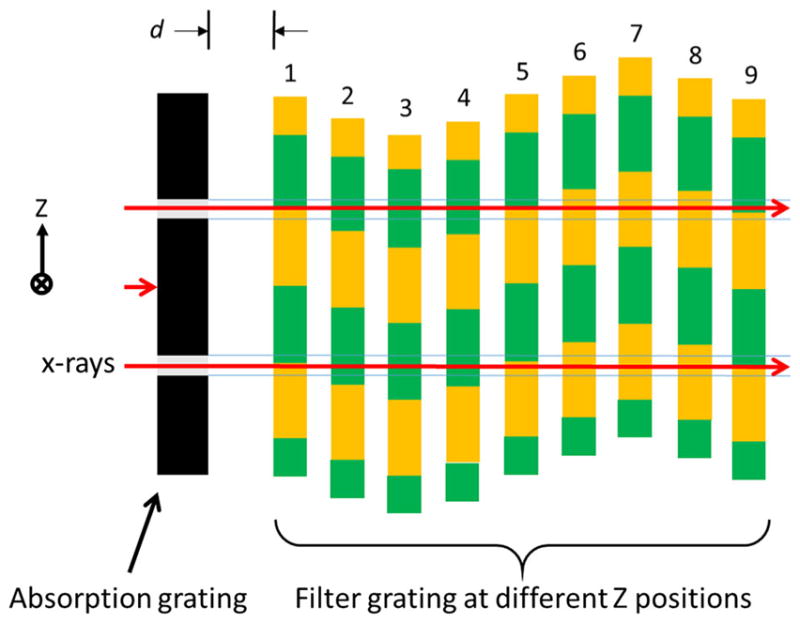
GOLF arrangement for reduced filter blur. Similar to Fig. 3, but with reduced absorption-grating duty cycle (narrower slit)
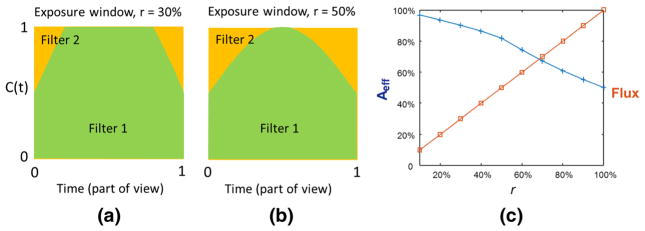
Figure 5 shows how the absorption-grating duty cycle, r, affects the amount of spectral mixing during a view-period for the GOLF arrangement in Fig. 4. Figure 5a–b show the “exposure window” for absorption-grating duty cycles of r = 30% and r = 50% respectively, where the exposure window plots the % correct filtering versus time, over one view period, and filter 1 is the correct filter and filter 2 is the wrong one (contamination). Let C(t) and W(t) = 1 − C(t) be the time dependent % slit coverage by the correct and wrong filters respectively. Also, let ST (E) be the energy-dependent (E) tube output spectrum during the view, Fc(E) be the correct filter energy function, and Fw(E) the wrong filter energy function. Note that C(t) depends only on the filter-motion as a function of time, which in this case is sinusoidal. The average spectrum over a view period, ΔT, is then given by
Fig. 5.
Impact of absorption-grating duty cycle on spectral mixing for the GOLF arrangement of Fig. 4 and sinusoidal filter motion. a Exposure window for r = 30%, b Exposure window for r = 50%, and c percentage of the correct filtration (blue) and flux efficiency (red) as a function of the absorption-grating duty cycle, r
| (1) |
where Aeff is the effective correct-filter time-slit area given by
| (2) |
Figure 5c shows how Aeff (in %) depends on r when the motion is sinusoidal, and at the same time shows the flux efficiency. See that when r = 50%, the output spectrum is the sum of 81% correctly filtered and 19% incorrectly filtered input spectra, and one half of the input flux is lost (absorbed). As r approaches 0, spectral filtering becomes perfect (no blurring), but the output flux goes to zero.
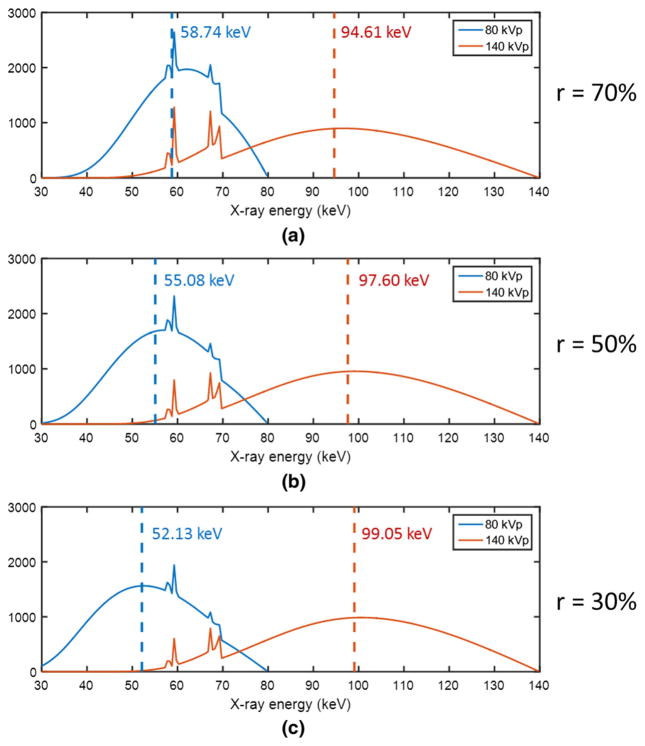
In Fig. 6, simulated low and high-energy spectra are shown for a kVp-switching source that is augmented with the GOLF arrangement in Fig. 4. The kVp-switching is between 80 and 140 kV with equal periods, and the GOLF low and high-pass filter materials are Air and 0.5 mm of Tin, respectively. The GOLF output spectra (pre-patient) are calculated using Eqs. (1) and (2) above. Figure 6a–c show the output spectra when r = 70%, r = 50%, and r = 30%, respectively. The narrower absorption-grating slit (r = 30%) yields largest mean-energy separation.
Fig. 6.
Air-shot spectral distributions using the GOLF method, with equal-period kVp-switching between 80 and 140 kV, for different absorption grating duty cycles, r. Dotted lines indicate corresponding mean energies
It is important to note that filter blurring can be avoided with less flux loss by (1) using vibration more like a square wave (non-sinusoidal) and/or (2) using a pulsed X-ray source and properly phasing the source pulses with the GOLF filter positions. For example, staying with the 50% absorption grating in Fig. 3a, the source can be turned on at times 2 and 6, and turned off at times 4 and 8. This generates X-rays and illuminates the absorber slits only when the filter is mostly of one type.
For a practical vibrational GOLF system, we assume that the gratings will each be a single continuous grating (not segmented), and that the moved grating is planar and moved only in the plane. Segmentation would likely cause boundary issues that we currently want to avoid, and rapidly vibrating a non-planar grating seems very difficult. The gratings must work with the large fan and cone angles of a CT system and, because the gratings have a significant thickness, they should be “focused” on the source spot to avoid flux loss and spectral error. Although the stationary grating could be curved, we assume both gratings to be planar and very close together to minimize alignment issues. Figure 7 illustrates planar absorption and filter gratings focused on a focal spot. For proper GOLF operation, the absorber and filter grating periods must be properly related for the given grating separation, d. For small separation, the periods are nearly equal. Furthermore, for small grating periods, the filter grating will remain in focus when it is shifted (vibrated) by only the required ½ period.
Fig. 7.
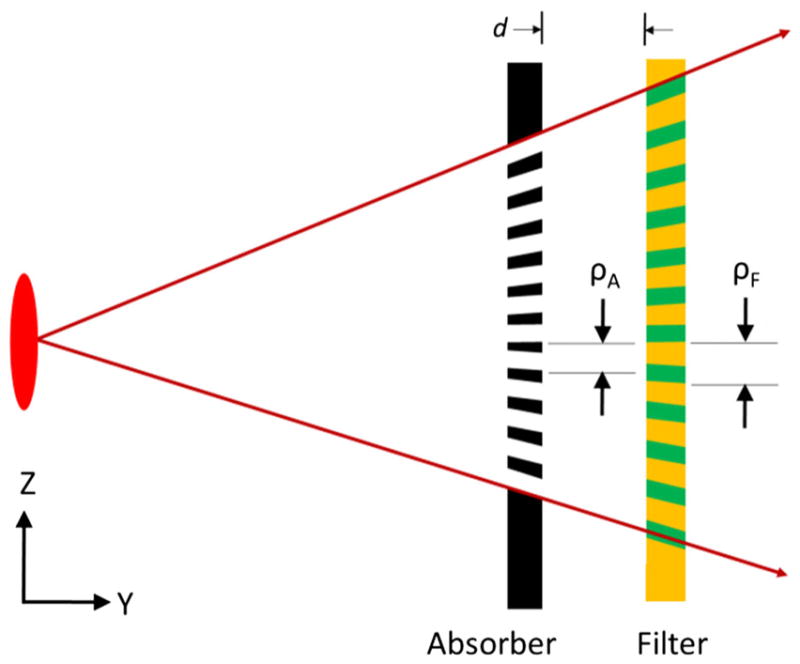
Planar absorption and filter gratings focused on the source
For a real system, several GOLF design parameters must be set. For vibrational GOLF where r = 50% as in Fig. 3, the key parameters are (1) absorption and filter grating materials and thicknesses, (2) grating period, and (3) distance of the gratings from the X-ray source spot. The absorber and filter materials and thicknesses are chosen to provide the required absorption and spectral filtration for the given source spectra. With a gold absorber for 80 and 140 kVp source spectra, a gold thickness of 0.5 mm would be sufficient to block at least 98% at all energy below 140 keV. With Air and Tin as filters, a filter-grating thickness of 0.5 mm will provide good spectral separation improvement as will be demonstrated in Sect. 3.
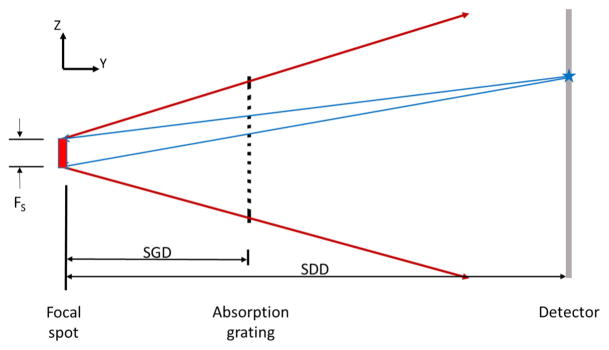
For vibrational GOLF, the grating period must be small enough to allow the rapid filter displacement but not so small that the grating cannot be fabricated or mechanically stabilized. Furthermore, it must not be too large relative to the source-spot size because the absorption grating bars would cast undesirable non-uniform (pixel-location-dependent) shadows on the detector (although they can be corrected), or for very large bars, completely block some detector pixels. Figure 8 shows the source spot, absorption grating and detector relevant geometry. As is discussed in [19], the extended spot size will beneficially blur the image of the grating on the detector, and the grating period can be chosen to insure little or no grating visibility in the detector image. Grating-induced flux variation across the detector is avoided if the focal-spot size FS, the source-to-grating distance SGD, the source-to-detector distance SDD, and the absorber grating period ρA are related by
Fig. 8.
Geometric optics for source focal spot blurring of the absorption-grating image at the detector. If Eq. (3) is satisfied and the grating duty cycle of 50%, then exactly ½ of the focal spot is blocked by the absorption grating for every point on the detector
| (3) |
where n is a positive integer. With a parallel arrangement of the planar detector array and planar gratings, every detector pixel has the same ratio SGD/SDD. When Eq. (3) is satisfied, every detector pixel gets the same percentage of flux blocked by the grating. When Eq. (3) is not satisfied, there is grating-induced flux variation across the detector array. As the integer n grows larger, the grating-induced variations diminish even when Eq. (3) is not satisfied. If necessary, this variation could be allowed to remain and be accounted in the common CT air and spectral calibrations.
From the perspective of diffractive optics (http://hyperphysics.phy-astr.gsu.edu/hbase/phyopt/sinslit.html), there is virtually no X-ray diffraction from the gratings. The diffraction for an X-ray of wavelength λ from an open slit of width L (L ≫ λ) is a sinc2 function with maximum at θ = 0 (straight through, no bending) and first zeros at the positive and negative angles given by
| (4) |
For 30 keV X-rays, λ = 4.13E–10. With an open slit width of 50 um, Eq. (4) gives the diffraction as bounded between ± 8.26E–6 radians. Thus, all X-ray energies above 30 keV stay within ± 8.26E–6 radians on leaving any slit larger than 50 um. Therefore, X-rays continue straight through the slit and, with an SDD of only ~1 m, there is little interaction with radiation from other slits.
Approximate parameter values for a typical CT machine are: SDD = 0.9 m, FS = 0.8 mm and a spot-to-tube-window distance of ~65 mm. The GOLF gratings are to be placed close to the source but outside of the X-ray tube (although this could change), and we add another 10 mm to get SGD ~75 mm. With these values, Eq. (3) says that grating periods of 0.733, 0.367, 0.244, 0.183, 0.147, and 0.122 mm (for n = 1 through 6, respectively) will yield no visible grating shadows on the detector. With thicknesses of 0.5 mm for a Gold absorption grating, and 0.5 mm for a Tin filter grating, it is feasible to choose the n = 3 result above and use a grating period of 0.244 mm. This choice yields an absorption-grating thickness/width ratio of ~4 for the slits which may be manufactured. As shown in Fig. 3, the filter grating would then need to be vibrated with a peak-to-peak amplitude of 0.122 mm.
2.2 Alternative GOLF Implementations
Vibrational GOLF as discussed above can be modified to avoid any mixing of the filter types during each view period by inserting absorption bars into the filter grating between adjacent filter types and narrowing the absorption-grating slits. The absorbers placed between the different filter stripes allow only one filter type to be active in any absorber-grating slit at a time. For such “spectrally pure” filtering, the slits in the absorber grating must not be larger than the absorbers in the filter grating. For sinusoidal vibration (and without pulsing the X-ray source), the best achievable flux efficiency is 15.9% when the absorber-grating duty cycle is 25%.
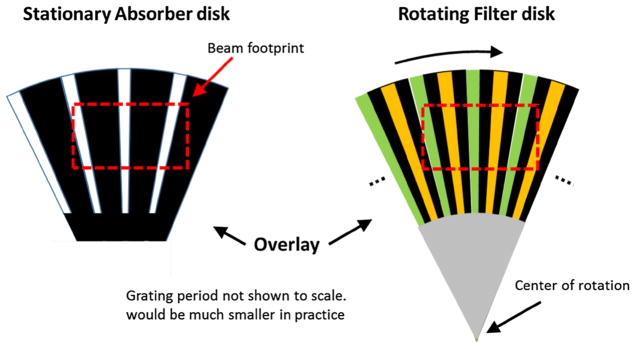
Vibrational GOLF requires rapid vibration of either the filter or absorption grating. If accurate vibration proves too costly or impractical, GOLF can be modified to a non-vibrating spherically shaped rotating version as shown in Figs. 9 and 10. Figure 9 shows a surface view of the absorber and filter grating sections flattened to disks for illustration while Fig. 10 shows a side view of how the spherical sections are positioned relative to the source. In Fig. 9, the two gratings are radially oriented with a constant angular grating period and overlaid with their radial centers aligned. The absorption grating is small and stationary while the filter section is larger and slowly rotated, with its center of rotation placed outside of the beam footprint. For demonstration, the gratings in Fig. 9 are also modified for spectrally pure filtering as mentioned above. The gratings are focused on the source by placing the gratings so their centers of curvature are aligned with the focal spot. Long CT scans are possible with no aberrated views if the entire filter grating has an integer number of grating periods.
Fig. 9.
Spherical grating sections flattened to a plane for illustration
Fig. 10.
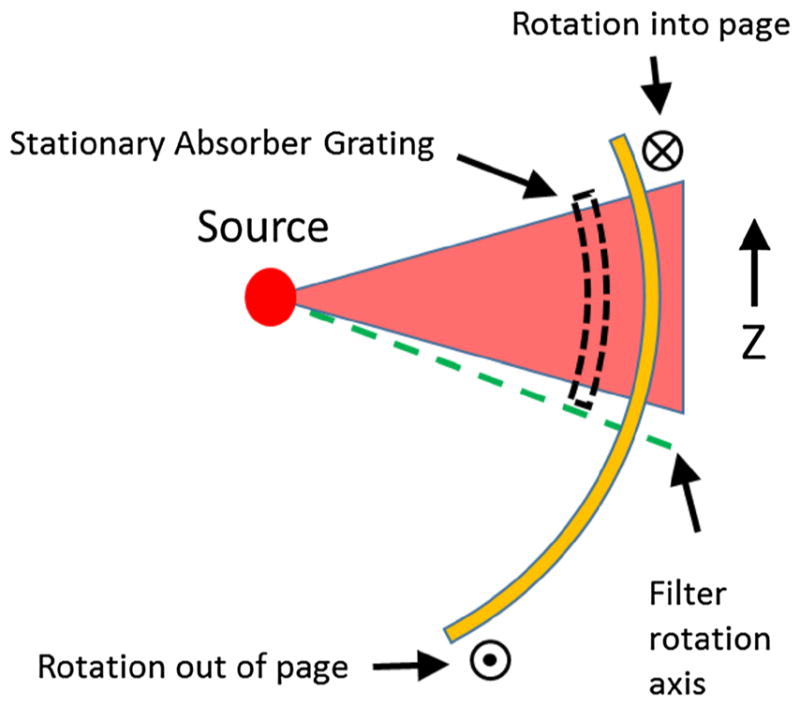
Side view of a spherically-shaped rotating GOLF filter
The size of the rotating filter depends on the spherical angle it spans, and it is desirable to choose a size that has acceptable grating slit widths (while fitting within the CT machine). As an example, let λ be the chosen Z-direction offset of the filter rotation axis from the beam footprint center and, from Eq. (3), we choose a filter grating period of ρFmax = 0.244 mm at the corner of the beam footprint furthest from the filter rotation center. Furthermore, we seek the filter spherical span angle and offset λ that insure the minimum grating period over the beam footprint, ρFmin, is no smaller than ρFmax/2 = 0.122 mm. Using spherical trigonometry we can show that if b = 7 deg is the half-cone span, d = 29 deg is the half-fan span, and the filter surface is placed 75 mm from the source spot, then a spherical filter section with a half-span of 45 deg and surface radial length of 59 mm will yield ρFmin = 0.122 at the edge of the footprint closest to the filter rotation center. These values are then subtly adjusted to make an integer number of periods in one filter rotation. With an outer-edge grating period of 0.244 mm and 2 views per grating period, a 1000 view scan requires 122 mm of rotation at the filter outer edge, or 149 degrees per 1000 views. A CT view rate of 3000 views per second would require this filter to spin at only 1.25 revolutions per second. By maintaining contact between the absorber and rotating filter gratings, susceptibility to gantry or tube vibrations may be minimized.
While the radial grating pattern of Fig. 9 is simple and allows the entire beam footprint to experience the same filtration at any time, other patterns are feasible. For example, grating rigidity may be improved by using absorber and filter spherical sections having a radial “checkerboard” pattern, where the absorber and filter grating patterns in Fig. 9 are divided into separate rings, and the rings phase-shifted relative to each other.
3 Experimental Results
3.1 Effect of the GOLF Gratings on the Image Resolution
In Sect. 2.1 it was shown via Eq. (4) that there is little diffraction of X-rays by the GOLF gratings. This means that X-ray propagation can be modeled by geometric optics. The grating bars will block some X-rays and, with a source focal spot that is larger than the grating bars, each point on the detector will receive flux from those parts of the focal spot that are not blocked. There is little blurring of the source spot.
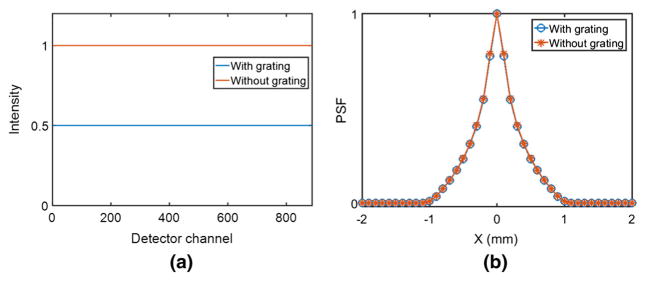
A simulation experiment was performed to verify that the absorption grating causes no change in the apparent spot size or loss of image resolution. The simulation setup is the same as shown in Fig. 8. The focal spot size was set to 1 mm, and SGD and SDD were set to 100 and 1000 mm respectively. According to Eq. (3) with n = 4, an absorption grating period of 0.225 mm will give a uniform illumination on the detector array (after normalization for intensity fall-off due to source-to-pixel distance). An ideal zero-thickness absorption grating was used with a period of 0.225 mm and 50% duty cycle. X-rays were collected using an ideal 888-pixel detector array of 1 mm pixels. Figure 11a shows the detected (distance normalized) X-ray intensity profile across the detector array with and without the absorption grating. The intensity profiles are uniform in both the cases, except that the profile with the grating is just half of that without the grating.
Fig. 11.
Simulated point spread functions (PSFs) with a perfectly absorbing 0.5 mm rod at the CT iso-center with and without the GOLF absorption grating
The system point spread function (PSF) was measured by placing an ideal high-absorption 0.5 mm rod at the center of the imaging field of view. The PSF-convolved profiles account for the focal spot distribution, the absorption grating, and the 0.5 mm-diameter rod. The PSF with the grating is virtually identical to the PSF without the grating as shown in Fig. 11b. There is no observable effect of the GOLF gratings on the image resolution.
3.2 Projection-Based Monochromatic Image Reconstruction
Monochromatic (single keV) X-ray images can be reconstructed from dual-kVp CT scan data either in the projection domain or the image domain [8, 19]. This is based on the assumption that any material can be represented as a linear combination of two basis materials:
| (5) |
where “L” and “H” indicate low- and high-energy while “1” and “2” denote the two basis materials respectively, and (ρ1, ρ2) are mass densities of the two basis materials. In the projection domain (p) and image domain (μ), we have low- and high-energy datasets and images (pL, pH and μL, μH), respectively. The monochromatic image CT(E) at any X-ray energy E can be reconstructed from projections
| (6) |
Specifically, we have
| (7) |
and
| (8) |
where the weighting factor is
| (9) |
In our study, monochromatic images were reconstructed using Eqs. (8) and (9) with filtered backprojection. In the reconstruction of a low-kVp image CTL and a high-kVp image CTH, water-based beam-hardening correction was made (alternatively, pL and pH can be directly computed using a more complicated algorithm).
3.3 X-ray CT Image Simulation
The performance of kVp-switching vibrational GOLF was investigated for several absorption-grating duty cycles via CT simulation with a simple thorax phantom. The image quality associated with GOLF was also compared to that of normal kVp-switching CT and dual-source CT. All three CT systems used 80 and 140 kV for the two source voltages, and all simulations were performed in the same single-slice CT geometry: Point source (FS = 0), Source-Iso-center distance (SID) = 500 mm, Source-Detector distance (SDD) = 900 mm, and a source-centered detector arc with 888 square pixels of 1 mm per side.
In the GOLF simulations, the planar gratings were simulated as perfectly focused on the source and with a grating period and source distance satisfying Eq. (3) so that there is no grating visibility in the projection domain. The absorber grating was 0.5 mm Gold while the filter grating used Air and Tin with thickness specified for each simulation test. All the simulations used 1440 views per full gantry revolution. For all the kVp-switching simulations (including GOLF), a total flux (and associated Poisson-noise) of 1e6 photons was generated at the filter output for each ray (source-to-pixel path). The source voltage was instantly switched at the end of each view. In the dual-source simulations, only ½ flux (5e5 photons) was generated for each ray to normalize the dose for performance comparison with the kVp-switching system. For image reconstruction, the field-of-view was set to 320 mm in diameter, and reconstructed with 512 × 512 pixels and 0.625 mm pixel size.
Figure 12 shows the simulation phantom. The contrast-to-noise ratio (CNR) performance was examined using the blood and water regions in the reconstructed monochromatic image. The images were reconstructed according to Eq. (8). The contrast-to-noise ratio (CNR) is defined as
Fig. 12.
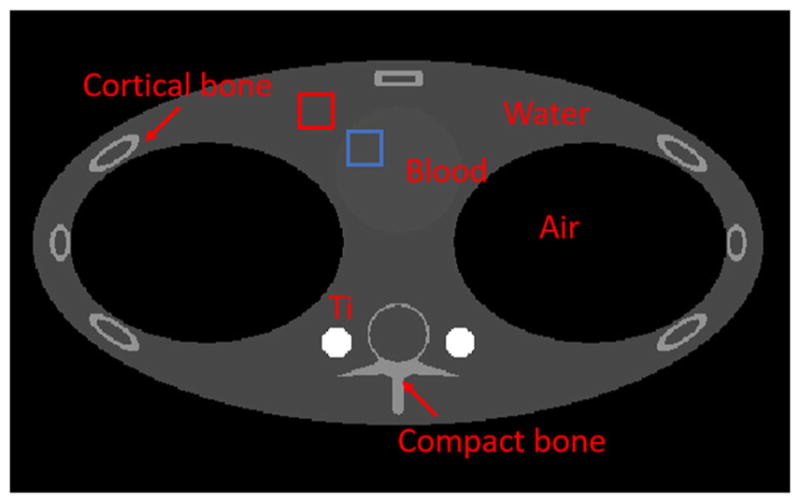
Thorax simulation phantom. Red (water) and blue (blood) boxes indicate the regions of interest (ROIs) for CNR calculation (Color figure online)
| (10) |
where Ā is the average over a region of interest (ROI), and σ is the standard deviation within the ROI. For each simulation, the red (water) and blue (blood) boxes in Fig. 12 defined the ROIs of 30 × 30 pixels. Note that the blood was in a barely visible circular region only slightly denser than water.
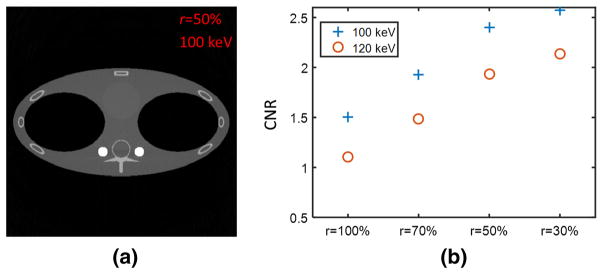
Figure 13 shows how the GOLF CNR performance changed as the absorber-grating duty cycle, r, was varied. Figure 13a shows the 100 keV monochromatic reconstruction when r = 50%, while Fig. 13b shows CNR vs r for both 100 and 120 keV. It can be clearly seen that the CNR is monotonically increasing with decreasing absorber duty cycle. This is expected because the spectral separation monotonically improves when r is reduced, as discussed in Sect. 2. CNR reached the lowest when r = 100%. In this case, there was no absorber grating because both filter types were always fully exposed. This filtration is equivalent to normal (non-GOLF) kVp-switching but with two parallel filter paths, one in Air and the other in Tin.
Fig. 13.
Monochromatic images reconstructed using the sinusoidal vibrational GOLF. a The 100 keV image with the grating duty cycle = 50% and the window-level = [0, 0.06], and b the CNR versus grating duty cycle for 100 and 120 keV reconstructions respectively
Dual-energy CT imaging can dramatically reduce beam hardening artifacts when the X-ray absorption and scattering properties (Photoelectric and Compton) of each imaged material can be accurately represented by a combination of the two basis materials. The thorax phantom includes two Titanium rods with an X-ray absorption K-edge at 85 keV that is not well represented by the basis materials (Water and Bone). However, the artifact can still be reduced using X-ray energy filters that modify the source spectra in a way that reduces the material representation error. Figure 14 shows 100 keV monochromatic reconstructions of the Titanium-rod region for duty cycles of 30, 50, 70, and 100% respectively. The artifact was clearly reduced as the spectral separation improved (as r was reduced), likely because the high-pass filter reduced the spectra at and below 85 keV relative to that at the higher energies.
Fig. 14.
Beam hardening around the Titanium rods for several GOLF absorber-grating duty cycles. Images are 100 keV monochromatic reconstructions, displayed with window-level = [0.01, 0.03]
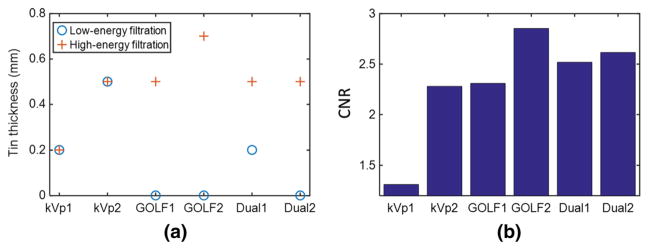
The simulated CNR performance of GOLF, normal kVp-switching, and dual-source CT were compared in Fig. 15 using the thorax phantom and the system parameters as described above for Fig. 13. Six different simulations were performed, two for each system type. For both GOLF simulations, the duty cycle is r = 50%. Figure 15a shows the filter thicknesses and system type for each simulation. Figure 15b shows the resulting CNR values. For example, GOLF2 used Air as the low-pass filter for the 80 kVp views, and 0.7 mm Tin as the high-pass filter for the 140 kVp views. The resulting water-blood CNR was 2.8, the best of the simulation results. GOLF2 has produced significantly higher CNR than either kVp1 or kVp2, and kVp2 had a dramatic low-kVp flux inefficiency due to attenuation by the 0.5 mm Tin filter. Of course, with other filter choices, we expect that the CNR of a dual-source system can always be made to match that of GOLF (e.g., by using the same two effective filters as that used by GOLF).
Fig. 15.
Water-blood CNR results for the thorax-phantom simulations with the GOLF (r = 50%), dual-source, and normal kVp-switching CT systems using various low-pass and high-pass filter thicknesses
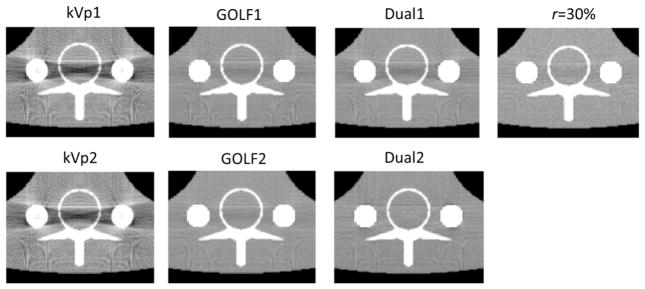
Figure 16 shows reconstructions around the metal rods from all 6 simulations in Fig. 15 and also for GOLF1 with r = 30% (from Fig. 14). Beam hardening with GOLF seems much less than that with kVp switching, and nearly equals that of dual-source CT.
Fig. 16.
Metal areas from Fig. 15. Images are displayed with win-lev = [0.01, 0.03]
3.4 Feasibility of grating vibration
A vibrational GOLF module will be practical for CT only if it is effective, tolerant of gantry G forces, and easily fit within the current CT envelope between the source and patient. To be effective, the gratings must maintain their shape and alignment during a rapid vibration, and the vibration must be sufficiently repeatable to allow calibration and avoid image artifacts. These challenges have not yet been addressed with a real prototype, which is beyond the scope of this initial paper, but candidate PZT actuators and power amplifiers have been identified for testing a prototype set of vibrational GOLF gratings.
In Sect. 2.1, we considered a Tin filter grating that is 0.5 mm thick, has a 50% duty cycle and 0.244 mm period, and is located 75 mm from the source spot. In the context, the filter grating must vibrate with a peak-to-peak (p–p) amplitude of ½ of the grating period, or ~120 um at a 1 kHz rate. The Kinetic Ceramics A050120 PZT actuator provides a maximum displacement of 120 um when 1000 V is applied. It has a self-resonant frequency of 12.3 kHz and, with very light loading, it will support 1 kHz sinusoidal operation with 120 um p–p displacement.
To see that the actuator is lightly loaded, the forces required to vibrate the filter grating are calculated as follows. If the filter is placed 75 mm from the source in a 64-slice CT machine with a fan angle of 57° and a cone angle of 4°, then the filter grating must be approximately 82 mm in X and 6 mm in Z to filter the entire beam. The filter volume is then 246 mm3, half Air and half Tin. With the density of Tin at 7.31 g/cm3, the resulting mass is only 0.9 g. Assuming we allow another ~10 × mass for filter stiffening/stability, we have to vibrate ~10 g. With sinusoidal vibration, the filter position, velocity, and acceleration are given by
| (11) |
| (12) |
| (13) |
where Dpeak = 60 um so that the peak acceleration is 2.4E + 03 m/s2. The peak force required for this acceleration of ~10 g is 24 N. This is very small compared to the actuator blocking force of 4500 N (Newtons) and will allow the actuator to achieve the desired 120 um of displacement at ~1000 V.
According to Kinetic Ceramics, the voltage and current required for sinusoidal displacement are expressed as
| (14) |
| (15) |
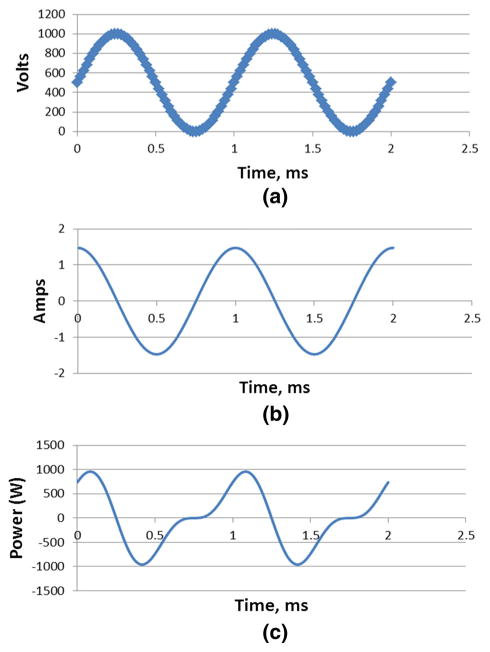
where Dpeak is in microns and cannot exceed 120, f is in Hz and should be well below the self-resonant frequency, and C = 1.18 μF is the PZT stack capacitance for the A050120 actuator. The resulting voltage and current waveforms are in Fig. 17a and b. The instantaneous power required is the product of the voltage and current, as shown in Fig. 17c. The average power required is near zero because the energy is alternately stored in and then removed from the actuator capacitance and mechanical spring in the actuator. However, a controller capable of sourcing and sinking 1 kW is needed. Inefficient controllers are available that waste the stored energy, but new controller designs are being developed (Kinetic Ceramics) to recover much of the energy.
Fig. 17.
Mechanical feasibility of grating vibration. a Voltage, b current, and c power waveforms for driving the Kinetic Ceramics A050120 PZT actuator
The above analysis indicates that a PZT actuator can meet the vibrational GOLF motion requirements. However, steps must be taken to prevent the vibration from coupling to other CT system components (the tube, etc.) and/or making offensive audible noise. One method to reduce unwanted coupling is to incorporate a counterweight in the GOLF module so the net momentum of the GOLF module is zero. The absorption grating might make an effective counter weight. To maintain the filter-grating character during vibration, a parallel stiffening plate, captivating travel tracks, and mode dampening methods may be needed to avoid travelling waves and/or out of plane vibrations within the grating. Section 2 focused on linear grating slits and bars, but unwanted vibration modes might be avoided using a checkerboard grating instead. This would eliminate long unsupported regions of absorbing bars within the grating.
4 Discussions and Conclusion
Dual-energy CT is a major advance in medical CT, and yet further improvements are desirable [9, 20]. The key feature of dual-energy CT imaging is the use of two different spectra to extract more information for material composition and monochromatic imaging. The proposed GOLF approach, when combined with conventional kVp-switching technology, should yield imaging results equivalent to that of dual-source CT, but without the associated high cost and temporal discrepancy between low and high-energy data acquisitions. Furthermore, GOLF can be used with single-kVp CT to add dual-energy capability.
Our GOLF approach combines a filter grating of sub-millimeter-sized filtering strips with a matching overlaid absorption grating. The gratings are placed between the X-ray source and the patient and moved relative to one another to enable rapid filter changes using only a small relative displacement of the gratings. The relative motion is synchronized with the kVp-switching or view-sampling processes to provide the desired view-dependent spectral filtering. With this micro-fabricated GOLF technology, the medical CT requirements for large coverage (field of view) can be combined with rapid filter changes to yield superior dual-energy spectral separation. The filter vibration, translation or rotation can be driven by a piezoelectric device or alternative methods that are compatible with CT scanning.
However, a cost associated with the use of the absorption grating is loss of X-ray flux from the source. The duty cycle of the absorption grating balances X-ray spectral separation and X-ray flux utilization. According to our above-described results, better spectral separation (narrower opening slit) leads to better quality of reconstructed monochromatic images. For high-power CT scans (e.g., 100 kW), a pulsed X-ray source is highly desirable because it can cut wasted flux in half. Nevertheless, the wasted flux does not contribute to patient radiation dose. Since the current mainstream is toward low-dose (low-current) CT imaging protocols, wasted flux should not be a major issue in moving our proposed technology into practice.
As demonstrated in our feasibility analysis and simulations, GOLF presents improved spectral separation for single-source dual-energy CT. With optimized piezoelectric devices and narrow grating periods, the vibrational GOLF method should be implementable with the high oscillation frequency needed for modern single-source CT scanners. However, it is emphasized that other GOLF implementations may have practical benefits. For example, other grating shapes and patterns can provide improved flux utilization and/or allow slower grating motions. Also, more than two filtering material types can be introduced for multi-energy X-ray imaging. Another interesting possibility is to take X-ray path lengths in the patient body into account so that the final diagnostic performance will be optimized instead of just increasing the spectral separation of X-rays prior to patient exposure.
In conclusion, we have proposed a novel GOLF approach for single-source dual-energy CT that may be quite valuable with kVp-switching or non-switching source techniques. The proposed GOLF technology can be an independent device that may be added with small overhead. With the proposed technology, the imaging performance can be improved in terms of monochromatic image quality, material decomposition, and radiation dose reduction. Although the absorption grating will decrease the efficiency of the X-ray source, it will not increase the patient radiation dose, and is consistent with the trend of radiation dose reduction.
Acknowledgments
This work is supported in part by National Institute of Biomedical Imaging and Bioengineering (NIBIB)/National Institutes of Health (NIH) (R01 EB016977, U01 EB017140).
References
- 1.Kalender WA. X-ray computed tomography. Physics in Medicine & Biology. 2006;51:R29. doi: 10.1088/0031-9155/51/13/R03. [DOI] [PubMed] [Google Scholar]
- 2.Wang G, Yu H, De Man B. An outlook on X-ray CT research and development. Medical Physics. 2008;35:1051–1064. doi: 10.1118/1.2836950. [DOI] [PubMed] [Google Scholar]
- 3.Wang G, Lin TH, Cheng PC, Shinozaki DM. A general cone-beam reconstruction algorithm. IEEE Transactions on Medical Imaging. 1993;12:486–496. doi: 10.1109/42.241876. [DOI] [PubMed] [Google Scholar]
- 4.Taguchi K, Aradate H. Algorithm for image reconstruction in multi-slice helical CT. Medical Physics. 1998;25:550–561. doi: 10.1118/1.598230. [DOI] [PubMed] [Google Scholar]
- 5.Wang G, Crawford CR, Kalender WA. Guest editorial-Multirow detector and cone-beam spiral/helical CT. IEEE Transactions on Medical Imaging. 2000;19:817–821. doi: 10.1109/tmi.2000.887831. [DOI] [PubMed] [Google Scholar]
- 6.Johnson TR, Krauss B, Sedlmair M, Grasruck M, Bruder H, Morhard D, et al. Material differentiation by dual energy CT: Initial experience. European Radiology. 2007;17:1510–1517. doi: 10.1007/s00330-006-0517-6. [DOI] [PubMed] [Google Scholar]
- 7.Graser A, Johnson TR, Chandarana H, Macari M. Dual energy CT: Preliminary observations and potential clinical applications in the abdomen. European Radiology. 2009;19:13–23. doi: 10.1007/s00330-008-1122-7. [DOI] [PubMed] [Google Scholar]
- 8.Yu L, Leng S, Mccollough CH. Dual-energy CT-based monochromatic imaging. AJR American Journal of Roentgenology. 2012;199:S9–S15. doi: 10.2214/AJR.12.9121. [DOI] [PubMed] [Google Scholar]
- 9.Karçaaltıncaba M, Aktaş A. Dual-energy CT revisited with multidetector CT: Review of principles and clinical applications. Diagnostic & Interventional Radiology. 2010;17:181–194. doi: 10.4261/1305-3825.DIR.3860-10.0. [DOI] [PubMed] [Google Scholar]
- 10.Schlomka J, Roessl E, Dorscheid R, Dill S, Martens G, Istel T, et al. Experimental feasibility of multi-energy photon-counting K-edge imaging in pre-clinical computed tomography. Physics in Medicine & Biology. 2008;53:4031. doi: 10.1088/0031-9155/53/15/002. [DOI] [PubMed] [Google Scholar]
- 11.Barber WC, Nygard E, Iwanczyk JS, Zhang M, Frey EC, Tsui BM, et al. Characterization of a novel photon counting detector for clinical CT: Count rate, energy resolution, and noise performance. In Proceedings of. SPIE medical imaging. 2009:725824–725824-9. [Google Scholar]
- 12.Gao H, Yu H, Osher S, Wang G. Multi-energy CT based on a prior rank, intensity and sparsity model (PRISM) Inverse Problems. 2011;27:115012. doi: 10.1088/0266-5611/27/11/115012. [DOI] [PMC free article] [PubMed] [Google Scholar]
- 13.Fornaro J, Leschka S, Hibbeln D, Butler A, Anderson N, Pache G, et al. Dual-and multi-energy CT: Approach to functional imaging. Insights Into Imaging. 2011;2:149–159. doi: 10.1007/s13244-010-0057-0. [DOI] [PMC free article] [PubMed] [Google Scholar]
- 14.Li B, Yadava G, Hsieh J. Quantification of head and body CTDIVOL of dual-energy X-ray CT with fast-kVp switching. Medical Physics. 2011;38:2595–2601. doi: 10.1118/1.3582701. [DOI] [PubMed] [Google Scholar]
- 15.Carmi R, Naveh G, Altman A. Material separation with dual-layer CT. IEEE nuclear science symposium conference record nuclear science symposium. 2005;4 [Google Scholar]
- 16.Flohr TG, Mccollough CH, Bruder H, Petersilka M, Gruber K, Süβ C, et al. First performance evaluation of a dual-source CT (DSCT) system. European Radiology. 2006;16:256–268. doi: 10.1007/s00330-005-2919-2. [DOI] [PubMed] [Google Scholar]
- 17.Grasruck M, Kappler S, Reinwand M, Stierstorfer K. Dual energy with dual source CT and kVp switching with single source CT: A comparison of dual energy performance. Proceedings of SPIE—The international society for optical engineering. 2009;7258 [Google Scholar]
- 18.Stayman JW, Mathews A, Zbijewski W, Gang G, Siewerdsen J, Kawamoto S, et al. Fluence-field modulated X-ray CT using multiple aperture devices. Proceedings of SPIE—The international society for optical engineering; [DOI] [PMC free article] [PubMed] [Google Scholar]
- 19.Yu L, Christner JA, Leng S, Wang J, Fletcher JG, Mccollough CH. Virtual monochromatic imaging in dual-source dual-energy CT: Radiation dose and image quality. Medical Physics. 2011;38:6371–6379. doi: 10.1118/1.3658568. [DOI] [PMC free article] [PubMed] [Google Scholar]
- 20.Kang MJ, Park CM, Lee CH, Goo JM, Lee HJ. Dual-energy CT: Clinical applications in various pulmonary diseases. Radiographics. 2010;30:685–698. doi: 10.1148/rg.303095101. [DOI] [PubMed] [Google Scholar]


