

Abstract
Often, studies modeling an exposure’s influence on time to disease-specific death from study enrollment are incorrectly interpreted as if based on time to death from disease diagnosis. We studied 151,996 post-menopausal women without breast or colorectal cancer in the Women’s Health Initiative with weight and height measured at enrollment (1993–1998). Using Cox regression models, we contrast hazard ratios (HR) from two time-scales and corresponding study subpopulations: time to cancer death after enrollment among all women and time to cancer death after diagnosis among only cancer survivors. Median follow-up from enrollment to diagnosis/censoring was 13-years for both breast (7633 cases) and colorectal cancer (2290 cases). Follow-up from diagnosis to death/censoring was 7-years for breast and 5-years for colorectal cancer. In analyses of time from enrollment to death, body mass index (BMI)≥35-kg/m2 versus 18.5-<25-kg/m2 was associated with higher rates of cancer mortality: HR=1.99; 95%CI: 1.54, 2.56 for breast cancer (p-trend <0.001) and HR=1.40; 95%CI: 1.04, 1.88 for colorectal cancer (p-trend=0.05). However, in analyses of time from diagnosis to cancer death, trends indicated no significant association (for BMI≥35-kg/m2, HR=1.25; 95%CI: 0.94, 1.67 for breast [p-trend=0.33] and HR=1.18; 95%CI: 0.84, 1.86 for colorectal cancer [p-trend=0.39]). We conclude that a risk factor that increases disease incidence will increase disease-specific mortality. Yet, its influence on post-diagnosis survival can vary, and requires consideration of additional design and analysis issues such as selection bias. Quantitative tools allow joint modeling to compare an exposure’s influence on time from enrollment to disease incidence and time from diagnosis to death.
Keywords: Mortality, Survival, Breast Cancer, Colorectal Cancer, Obesity, Methods
INTRODUCTION
In prospective epidemiologic studies, cancer mortality refers to the occurrence of deaths from a particular form of cancer over time among those who entered the study cohort without a history of that cancer.1,2 Cancer mortality from enrollment can be configured into different time scales and corresponding study populations, as illustrated in Figure 1: time from enrollment to incidence of a particular cancer among all study participants (including both those who develop cancer during follow-up as well as those who do not), and time from cancer diagnosis to death among individuals with a cancer diagnosis (Figure 1). Studies that examine the associations between exposures measured before cancer diagnosis and cancer mortality among all study participants enrolled in a cohort therefore could identify risk factors for cancer incidence, cancer prognosis, or both. However, risk estimates for cancer mortality from these studies are often misinterpreted as reflecting associations with post-diagnosis death (i.e., survival) among those who are diagnosed with cancer.
Figure 1. Analyses of “Cancer Mortality from Enrollment” versus “Post-Diagnosis Survival”.
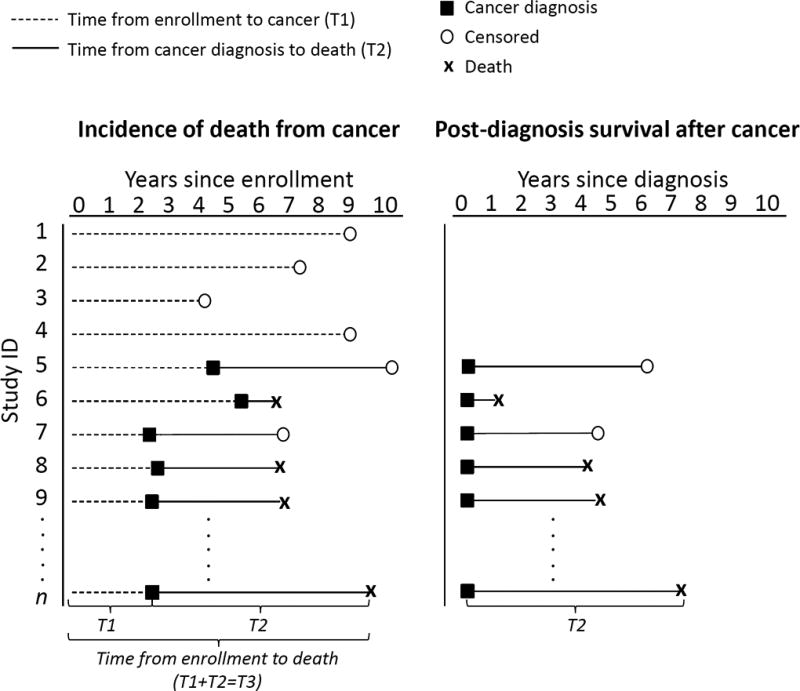
An analytic sketch that contrasts cancer mortality (left panel) and post-diagnosis cancer survival (right panel) with respect to cohort and time-scale. Each line or “study ID” represents a participant, where the survivor cohort (right panel) includes only participants with a cancer diagnosis, a subset of the cohort that was enrolled (left panel). The time to cancer mortality from enrollment can be partitioned into two parts: time from enrollment to incidence of a cancer, and time from cancer diagnosis to death as indicated by n-th participant.
The distinction between time from study enrollment to death and time from cancer diagnosis to death may be of importance when studying the relationship between obesity and cancer. Obesity is a key risk factor for incidence of colorectal cancer3 as well as post-menopausal breast cancer.4 However, the relationship of obesity to cancer mortality has not been consistent. The relationship of obesity to death depends on modeling choices (e.g., whether the time-scale is from enrollment or from cancer diagnosis), exposure timing (e.g., when obesity is assessed in relation to diagnosis), study population (individuals with a cancer diagnosis versus all cohort members), and whether the outcome is cancer-specific death or any death following a cancer diagnosis. Illustrating these considerations in the design and interpretation of cancer mortality studies can help distinguish a risk factor’s role in cancer incidence from its role in the prevention of morbidity, recurrence and death after a cancer diagnosis. This in turn can help clarify the appropriate clinical management and broader public health messages.
Modeling a risk factor’s association with post-diagnosis survival among a population with existing disease (T2 in Figure 1) introduces new potential biases that warrant consideration. eFigure 1 provides a simplified illustration of how such biases might arise. In brief, restricting analyses to individuals with a cancer diagnosis constitutes conditioning on a variable (cancer diagnosis) that is affected by exposure (BMI) and shares common etiologic relationships with the outcome, cancer mortality. Conditioning on a variable affected by exposure produces a form of selection bias called collider stratification bias.5 This type of bias will likely move risk estimates toward the null, attenuating the estimated association of BMI with post-diagnosis mortality among patients with cancer. Measured confounders of BMI’s association with cancer death can be adjusted for in analysis, but selection bias could still result from the existence of unmeasured confounders (e.g., genetic factors) that influence both cancer risk and the probability of death after cancer. The relative importance of this bias has been debated in the epidemiologic literature, including in the context of cancer, and is partially addressed here.6–12
The main objective of this article is to address two of the many methodological issues in the interpretation of cancer mortality studies: first, we a few address the choice of time-scale (from enrollment or diagnosis) and corresponding study cohort (all cohort members or only those with disease). Secondly, we demonstrate the potential bias that may be induced by choosing time since diagnosis as the time-scale and discuss the resulting public health interpretation. Our illustration uses the example of obesity and death due to breast or colorectal cancer modeled with data from the Women’s Health Initiative (WHI) clinical trials (CT) and observational study (OS). To highlight the difference between cancer mortality from enrollment versus from after cancer diagnosis, we distinguish two cohorts corresponding to our choice of time-scale: first, we examine all WHI participants (where membership is all women without a cancer history at the time of study enrollment, and the time-scale is since enrollment), and, second, we examine a ‘survivor’ sub-cohort (where membership is defined by diagnosis of breast or colorectal cancer and the time-scale is since diagnosis). We further consider models in which body mass index (BMI) is measured only once, at cohort entry, and assumed to be constant over time, and subsequently models in which BMI is updated over time and includes measurements proximal to cancer diagnosis.
METHODS
Study Population
Design details of the WHI have been published.13 Briefly, postmenopausal women aged 50–79 years were recruited at 40 clinical centers in the United States from 1993–1998. Women could be enrolled in the OS or randomized to one, two or three overlapping CTs of post-menopausal hormones, dietary modification (DM) and/or calcium plus vitamin D supplementation. Study protocols were reviewed and approved by the institutional review boards at each clinical center and the Clinical Coordinating Center. All women signed informed consent. Women who re-consented were followed through the WHI Extension periods (2005–2010 and 2011–2016)
Body Mass Index
Height and weight were measured at baseline clinic visits using a standardized protocol. BMI in kilograms per meters squared (kg/m2) was categorized as normal-weight (BMI<25); overweight (25–<30); grade-1obesity (30–<35); and grade-2+3 obesity (≥35). Our models considered BMI measured at enrollment and updated information on BMI over follow-up until cancer diagnosis. BMI was measured three years after enrollment in the OS, and annually in the CT from baseline.
Covariates
At enrollment, self-reported data were collected on demographic characteristics, smoking, dietary and alcohol intake, recreational physical activity, medical history, and family history of breast and colorectal cancer.
Cancer Outcomes
Details of outcomes data collection and adjudication are published.14 Self-reports of breast and colorectal cancers were collected at least annually and then verified by medical records and pathology reports by physician adjudicators using the National Cancer Institute’s Surveillance Epidemiology and End Results (SEER) coding system. Vital status was collected through participant follow-up and periodic searches of the National Death Index. Cause of death was determined by medical record and death certificate review. Primary outcomes were death due to breast or colorectal cancer, i.e., deaths where the cancer of interest was listed as the primary cause. Secondary outcomes were deaths from any cause following the cancer diagnosis. Terminology is clarified in Table 1.
Table 1.
Terminology
| Term | Definition |
|---|---|
| Cancer mortality | Time from study enrollment to death after a diagnosis of breast or colorectal cancer among all cohort participants |
| Post-diagnosis survival | Time from diagnosis to death among participants diagnosed with breast or colorectal cancer |
| Death due to (breast or colorectal) cancer | Deaths in which the primary cause listed on the death certificate was the cancer of interest |
| Death due to any cause after (breast or colorectal) cancer | Any death following a diagnosis of breast or colorectal cancer |
| Cancer-specific Survival | Estimated hazard ratio (association) of BMI for cancer-specific death after a diagnosis of (breast or colorectal) cancer (including only deaths due to breast or colorectal cancer) with the time-scale for follow-up beginning at cancer diagnosis |
| Overall survival | Estimated hazard ratio (association) of BMI for with death from any cause after a diagnosis of (breast or colorectal) cancer (including all deaths following a diagnosis of breast or colorectal cancer) with the time-scale for follow-up beginning at diagnosis |
| Estimates obtained from a traditional, time-to-first-event Cox Proportional Hazards model | The Cox model is a commonly-used, semi-parametric survival analysis method which models the incidence or hazard rate, the number of new cases of disease per population at-risk per unit time. If the outcome is death, this is the mortality rate |
| T1 | Estimated association of BMI with incident cancer (breast or colorectal cancer) with the time-scale beginning at study enrollment |
| T2a | Estimated association of BMI with cancer-specific death after diagnosis (only deaths due to breast or colorectal cancer) with the time-scale beginning at diagnosis |
| T2b | Estimated association of BMI with all deaths following a diagnosis of breast or colorectal cancer with the time-scale beginning at diagnosis |
| T3a | Estimated association of BMI with cancer-specific death after enrollment (only deaths due to breast or colorectal cancer) with the time-scale beginning at study enrollment |
| T3b | Estimated association of BMI with all deaths following a diagnosis of breast or colorectal cancer with the time-scale beginning at study enrollment |
Statistical Methods
As illustrated in Figure 1, in a typical cancer mortality study, time to death from enrollment (T3) can be parsed into incidence (time from enrollment to cancer diagnosis, T1) and post-diagnosis survival (T2). For clinical interpretability, time from cancer diagnosis to death is often used to model T2 (Figure 1). To investigate the difference in the association of obesity with cancer mortality arising from these two components of T3, we provide the usual time-to-event hazard ratio (HR) estimates from Cox proportional hazards models for the association of obesity with incident cancer (T1), obesity with cancer mortality after enrollment (T3), and obesity with death following a cancer diagnosis (post-diagnosis survival, T2). In general, proportional hazard models for T1, T2 and T3 are mathematically not mutually compatible (see Appendix). In the common situations presented here, proportional hazards models provide an adequate fit, where associations in T3 can be parsed into the associations in T1 and T2 without substantive departures from proportionality. We illustrate that the HR for the association of obesity with cancer mortality after enrollment (T3) can be approximated by the product of a risk factor’s HR for cancer incidence (T1) and its HR for post-diagnosis survival (T2). The Appendix provides an explicit formula for T3 induced by the proportional hazards models for T1 and T2, along with assumptions and mathematical details.
Trend tests treated BMI categories as an ordinal variable. For brevity, we report the HR and 95% Confidence Intervals (95%CI) for our primary outcome (deaths due to the cancer of interest) in the text. To highlight the influence of time-scale and cohort, all time-to-first event models that use BMI at enrollment adjust for the same set of baseline covariates, regardless of whether the event of interest was incident cancer or death following cancer diagnosis. Alternate models use time dependent BMI as a more proximal measurement that precedes cancer diagnosis and are presented in the e-Supplement. Sensitivity analyses adjust for time since cancer diagnosis in models in which women are followed from enrollment. Andersen et. al. provide a more general example of multistate models and mortality.15 They define explicitly situations were adjustment for time from diagnosis does and does not influence risk estimates; these are semi-Markov models and Markov models, respectively.
For breast cancer, covariates consisted of baseline age, race/ethnicity, education, bilateral oophorectomy, Gail 5-year risk, hormone therapy (HT: estrogen-alone use/duration, or estrogen and progesterone use/duration), smoking, diabetes mellitus, alcohol, and self-reported health. We used stratified Cox models, with strata defined by baseline age, WHI study (OS vs. CT), trial arm, hysterectomy, and whether the participant enrolled in the extended study follow-up (time-dependent).
For colorectal cancer, covariates consisted of age, race/ethnicity, education, HT, smoking, diabetes, alcohol, self-reported health, family history of colorectal cancer, ever colonoscopy/sigmoidoscopy, physical activity, and diet (total dietary energy, fiber, fat, fruits, vegetables, and red meat) with similar stratification as the breast cancer models.
All women were free of breast or colorectal cancer at the start of follow-up, and we excluded women with baseline weight measurements >135 or <35 kg or BMI >50.0 or <18.5 kg/m2, leaving 151,996 participants for analysis.
All analyses were conducted using SAS statistical software (version 9.4; SAS Institute Inc.). Forest plots were produced with R (version 3.2; R core team).
RESULTS
Table 2 shows the characteristics of all women by enrollment BMI group: mean (SD) age was 63.2 (7.2) years and BMI was 27.9 (5.5) kg/m2. In the e-Supplement, these characteristics are shown separately for each survivor sub-cohort: women who developed invasive breast (eTable 1) or colorectal cancer (eTable 2) during follow-up. Compared to normal-weight women, obese women were slightly younger, had lower educational attainment, notably worse self-reported health and were less likely to be non-Hispanic white.
Table 2.
Baseline Characteristics of Women’s Health Initiative Participants by Body Mass Index at Enrollment (n=151,996)
| Normal < 25 (n=52,616) |
Overweight 25 – < 30 (n=53,597) |
Grade-1Obesity 30 – < 35 (n=28,705) |
Grade-2+3 Obesity ≥ 35 (n=17,078) |
|||||
|---|---|---|---|---|---|---|---|---|
|
|
||||||||
| N | % | N | % | N | % | N | % | |
| Age at screening | ||||||||
| 50–59 | 17854 | 33.9 | 16862 | 31.5 | 9523 | 33.2 | 6569 | 38.5 |
| 60–69 | 22588 | 42.9 | 24371 | 45.5 | 13367 | 46.6 | 8020 | 47.0 |
| 70–79 | 12174 | 23.1 | 12364 | 23.1 | 5815 | 20.3 | 2489 | 14.6 |
| Race/ethnicity | ||||||||
| White | 45861 | 87.2 | 44478 | 83.0 | 22582 | 78.7 | 12597 | 73.8 |
| Black | 2161 | 4.1 | 4514 | 8.4 | 3741 | 13.0 | 3159 | 18.5 |
| Hispanic | 1524 | 2.9 | 2385 | 4.4 | 1460 | 5.1 | 824 | 4.8 |
| American Indian | 157 | 0.3 | 205 | 0.4 | 171 | 0.6 | 128 | 0.7 |
| Asian/Pacific Islander | 2241 | 4.3 | 1246 | 2.3 | 319 | 1.1 | 121 | 0.7 |
| Unknown | 672 | 1.3 | 769 | 1.4 | 432 | 1.5 | 249 | 1.5 |
| Education | ||||||||
| ≤ High school/GED or less | 9477 | 18.1 | 12054 | 22.7 | 7755 | 27.2 | 4938 | 29.1 |
| School after high school | 18246 | 34.9 | 20599 | 38.7 | 11516 | 40.4 | 7018 | 41.4 |
| College degree or higher | 24517 | 46.9 | 20527 | 38.6 | 9229 | 32.4 | 4984 | 29.4 |
| Hysterectomy at randomization | 19474 | 37.0 | 22912 | 42.8 | 13144 | 45.8 | 8130 | 47.6 |
| Number of term pregnancies | ||||||||
| Never been pregnant/ No term pregnancy | 6815 | 13.0 | 5933 | 11.1 | 2992 | 10.5 | 1878 | 11.1 |
| 1 | 4821 | 9.2 | 4548 | 8.5 | 2412 | 8.5 | 1464 | 8.6 |
| 2 | 14641 | 28.0 | 13071 | 24.5 | 6474 | 22.7 | 3635 | 21.4 |
| 3 | 12941 | 24.8 | 13075 | 24.5 | 6728 | 23.6 | 3827 | 22.5 |
| 4+ | 13063 | 25.0 | 16672 | 31.3 | 9931 | 34.8 | 6169 | 36.3 |
| Age at first birth | ||||||||
| Never pregnant/No term pregnancy | 6815 | 14.1 | 5933 | 12.3 | 2992 | 11.6 | 1878 | 12.3 |
| <20 | 4805 | 10.0 | 6771 | 14.0 | 4648 | 18.1 | 3407 | 22.3 |
| 20 – 29 | 32236 | 66.9 | 31844 | 65.9 | 16163 | 62.8 | 8948 | 58.6 |
| 30+ | 4328 | 9.0 | 3800 | 7.9 | 1940 | 7.5 | 1038 | 6.8 |
| Family history of female relative with breast cancer | 9322 | 18.7 | 9255 | 18.2 | 4823 | 17.8 | 2817 | 17.6 |
| Bilateral oophorectomy | 9384 | 18.2 | 10470 | 20.0 | 5988 | 21.5 | 3653 | 22.1 |
| Treated diabetes (pills or shots) | 789 | 1.5 | 1874 | 3.5 | 1986 | 6.9 | 2021 | 11.8 |
| Smoking status | ||||||||
| Never | 26711 | 51.4 | 26836 | 50.7 | 14593 | 51.5 | 8482 | 50.3 |
| Past | 21069 | 40.6 | 22385 | 42.3 | 11980 | 42.3 | 7511 | 44.6 |
| Current | 4163 | 8.0 | 3674 | 6.9 | 1757 | 6.2 | 860 | 5.1 |
| Self-reported health | ||||||||
| Excellent | 13300 | 25.4 | 8941 | 16.8 | 2906 | 10.2 | 966 | 5.7 |
| Very good | 23518 | 45.0 | 23107 | 43.4 | 10701 | 37.5 | 4861 | 28.6 |
| Good | 12831 | 24.5 | 17272 | 32.4 | 11560 | 40.5 | 7718 | 45.5 |
| Fair/poor | 2647 | 5.1 | 3909 | 7.3 | 3366 | 11.8 | 3424 | 20.2 |
| Duration of unopposed estrogen use | ||||||||
| None | 33550 | 63.8 | 33612 | 62.7 | 18576 | 64.8 | 11576 | 67.8 |
| Past User | 6293 | 12.0 | 6896 | 12.9 | 3719 | 13.0 | 2201 | 12.9 |
| Current User | 12735 | 24.2 | 13057 | 24.4 | 6388 | 22.3 | 3287 | 19.3 |
| < 5 Years (Duration; corresponds to past or current use) | 6542 | 12.4 | 7118 | 13.3 | 4073 | 14.2 | 2542 | 14.9 |
| 5 – <10 Years | 3830 | 7.3 | 3939 | 7.3 | 1967 | 6.9 | 1077 | 6.3 |
| 10+ Years | 8765 | 16.7 | 8963 | 16.7 | 4105 | 14.3 | 1895 | 11.1 |
| Duration of estrogen + progesterone use | ||||||||
| None | 35080 | 66.7 | 39669 | 74.0 | 22756 | 79.3 | 14241 | 83.4 |
| Past User | 4879 | 9.3 | 4688 | 8.7 | 2177 | 7.6 | 1091 | 6.4 |
| Current User | 12638 | 24.0 | 9221 | 17.2 | 3765 | 13.1 | 1742 | 10.2 |
| < 5 Years (Duration; corresponds to past or current use) | 8404 | 16.0 | 7030 | 13.1 | 3249 | 11.3 | 1664 | 9.7 |
| 5 – <10 Years | 4939 | 9.4 | 3694 | 6.9 | 1531 | 5.3 | 731 | 4.3 |
| 10+ Years | 4192 | 8.0 | 3204 | 6.0 | 1167 | 4.1 | 441 | 2.6 |
| CT participant | 18224 | 34.6 | 24181 | 45.1 | 15153 | 52.8 | 9496 | 55.6 |
| HT randomization group | ||||||||
| CEE active | 1088 | 2.1 | 1791 | 3.3 | 1349 | 4.7 | 983 | 5.8 |
| CEE placebo | 1071 | 2.0 | 1907 | 3.6 | 1364 | 4.8 | 973 | 5.7 |
| CEE + MPA active | 2516 | 4.8 | 2983 | 5.6 | 1811 | 6.3 | 1044 | 6.1 |
| CEE + MPA placebo | 2408 | 4.6 | 2823 | 5.3 | 1648 | 5.7 | 1049 | 6.1 |
| DM randomization group | ||||||||
| Intervention | 5004 | 9.5 | 6943 | 13.0 | 4450 | 15.5 | 2862 | 16.8 |
| Comparison group | 7500 | 14.3 | 10452 | 19.5 | 6748 | 23.5 | 4226 | 24.7 |
|
| ||||||||
| Mean | (SD) | Mean | (SD) | Mean | (SD) | Mean | (SD) | |
|
| ||||||||
| Total energy expenditure/wk from physical activity (MET-hrs) | 15.8 | 15.1 | 12.4 | 13.3 | 9.4 | 11.7 | 6.9 | 10.1 |
| RAND36 Physical functioning (0 –100 best) | 87.3 | 15.7 | 82.9 | 18.0 | 76.2 | 21.0 | 65.9 | 24.4 |
| Height (cm) | 162.3 | 6.4 | 161.7 | 6.3 | 161.4 | 6.3 | 161.0 | 6.6 |
| Weight (kg) | 59.7 | 6.2 | 71.6 | 6.7 | 84.0 | 7.5 | 101.2 | 11.4 |
| Waist circumference (cm) | 74.9 | 6.8 | 85.7 | 7.6 | 96.2 | 8.3 | 108.5 | 10.5 |
| Hip circumference (cm) | 96.7 | 5.8 | 105.2 | 6.1 | 114.2 | 7.1 | 127.2 | 10.0 |
| Gail 5-year risk of breast cancer | 1.8 | 1.0 | 1.7 | 1.0 | 1.7 | 1.0 | 1.6 | 1.0 |
Median follow-up from enrollment to cancer diagnosis/censoring was 13 years for both breast (7633 cases) and colorectal cancer (2290 cases). Median follow-up from cancer diagnosis to death/censoring was 7 years for breast and 5 years for colorectal cancer.
Figure 2 shows that among all women followed from enrollment, there is a strong association of higher BMI at enrollment with increased incidence of invasive breast cancer (T1; Figure 2, Panel A): compared to women with normal-weight, Hazard Ratios (HR) were HR=1.12; 95%CI: 1.06, 1.18 for overweight, HR=1.31; 95%CI: 1.23, 1.40 for grade-1 obesity, and HR=1.48; 95%CI: 1.36, 1.61 for grade-2+3 obesity, with p-trend<0.001. With respect to breast cancer mortality among all women followed from enrollment (T3a; Figure 2, Panel A), grade-2 obesity was associated with increased incidence of breast cancer death (T3a, HR=1.99; 95%CI: 1.54, 2.56), whereas overweight had no significant associations. As expected, associations between BMI and breast cancer death were attenuated when analyses were restricted to women with a diagnosis of breast cancer followed from diagnosis (p-trend=0.33; Figure 2, Panel B). For the number of cases in each BMI category for each analysis, consult eTable 3.
Figure 2. Breast Cancer Incidence, Mortality and Survival in the Women’s Health Initiative: Multivariable Adjusted Hazard Ratios by BMI at Enrollment, compared to women of normal weight (BMI < 25).

Refer to Figure 1 for terminology definitions. Bolded summary statistics for T1, T2 & T3 were computed from the usual time-to-first-event Cox regression models with baseline normal weight (BMI < 25 kg/m2) as the referent group. The un-bolded HRs for T3 were obtained by multiplying the corresponding estimates of risk for incidence (T1) with survival (T2); HRT3 = HRT1 × HRT2 (see appendix for mathematical derivation). The p-values correspond to a 1 degree of freedom test for trend. To highlight the influence of time-scale (time from enrollment vs. time from diagnosis), all time-to-first event models were adjusted for age, race/ethnicity, education, bilateral oophorectomy, Gail 5-year risk of breast cancer, estrogen-alone use and duration, estrogen and progesterone use and duration, smoking status, diabetes mellitus, alcohol consumption, self-reported health at baseline, and stratified by baseline age group, WHI study (OS vs. CT), HT trial randomization group, dietary trial randomization group, hysterectomy status, Calcium/Vitamin D Randomized Trial randomization group (time-dependent) and extended follow-up (time-dependent).
Associations were similar when BMI was updated over follow-up to reflect BMI proximal to cancer diagnosis (Supplemental eFigure 2, Panels ~A and ~B), and when time from enrollment, instead of time from diagnosis, was used to model post-diagnosis survival (Figure 2, Panels B–C). When using time from enrollment among survivors, which better aligns women with respect to time since exposure assessment, we conducted sensitivity analyses that adjusted for time from diagnosis as a covariate (linear); these had little influence on risk estimates: compared to Figure 2, Panel C, summary statistics changed to: HR (95%CI) = 1.05 (0.85, 1.31), 1.06 (0.82, 1.38), 1.36 (1.01, 1.81) with p-trend=0.08.
Parsing breast cancer mortality from enrollment (T3a) into its component associations of T1 (cancer incidence from enrollment) and T2a (post-diagnosis survival) suggests that the overall association of higher BMI with greater breast cancer mortality can be attributed in part to the strong association between increasing BMI and incidence of invasive breast cancer (T1). Of note, the HR for T3a (time from enrollment to death from breast cancer, HR=1.99 for grade-2 obesity) can be roughly approximated by the product of HRs for T1 (time from enrollment to breast cancer diagnosis, HR=1.48 for grade-2 obesity) and T2a (time from diagnosis to death from breast cancer HR=1.25 for grade-2 obesity); see Appendix special case #3.
We conducted parallel analyses with colorectal cancer; the relationship of higher BMI to colorectal cancer incidence is also well-established, though smaller in magnitude than for post-menopausal breast cancer. Parsing colorectal cancer mortality from enrollment (Figure 3; T3a) into its component associations of T1 (cancer incidence from enrollment) and T2a (post-diagnosis survival) suggests that the overall association of BMI with colorectal cancer mortality can be in part attributed to the significant association between increasing BMI and incidence of colorectal cancer (T1). As in the breast cancer example, T3 can be approximated by the product of T1 and T2; e.g., the HR for T3a (HR=1.40 for grade-2 obesity) is approximately the product of HRs for T1 (HR=1.20 for grade-2 obesity) and T2a (HR=1.18 for grade-2 obesity). For the number of cases in each BMI category for each analysis, consult eTable 4.
Figure 3. Colorectal Cancer Incidence, Mortality and Survival in the Women’s Health Initiative: Multivariable Adjusted Hazard Ratios by BMI at Enrollment, compared to women of normal weight (BMI<25).

Refer to Figure 1 for terminology definitions. Methods correspond to those described in Figure 2 for breast cancer, but models were adjusted for age, race/ethnicity, education, estrogen-alone use and duration, estrogen and progesterone use and duration, smoking status, diabetes mellitus, alcohol consumption, self-reported health at baseline, family history of colorectal cancer, occurrence of colonoscopy/ sigmoidoscopy/flexible sigmoidoscopy ever, physical activity, total dietary energy, fiber, fat, fruits, vegetables, red meat and stratified by baseline age group, WHI study (OS vs. CT), HT trial randomization group, Calcium/Vitamin D Randomized Trial randomization group (time-dependent) and extended follow-up (time-dependent).
As in breast cancer, associations of obesity with cancer death were slighter stronger in magnitude when comparing women followed from enrollment (for the same length of time relative to exposure assessment) as opposed to comparing women by time from diagnosis: using time from enrollment, instead of time from diagnosis, slightly strengthened associations among colorectal cancer survivors (Figure 3 Panel B vs. C; eFigure 3 Panel B vs. C). In sensitivity analyses, adding time since colorectal cancer diagnosis as a covariate to these models, T2a (Panel C), did not impact summary statistics; HR (95%CI) = 1.06 (0.83, 1.36), 1.13 (0.84, 1.53), 1.20 (0.85, 1.71) with p-trend=0.26. Unlike the breast cancer example, using proximal BMI instead of BMI at enrollment attenuated associations (compare Figure 3 and eFigure 3).
DISCUSSION
In this conceptual illustration, we parsed the association of BMI with cancer mortality into its components and contrasted risk estimates for the association of BMI with cancer incidence after study enrollment among all women and the association of BMI with cancer survival following diagnosis among women with a cancer diagnosis. Our purpose is to demonstrate that these are distinct relationships, and that cancer-specific survival following diagnosis is a component of cancer mortality after study enrollment. Our results suggest the relationship of higher BMI to the burden of cancer mortality among all women is driven in part by increased cancer incidence: in our Cox regression analyses, associations with post-diagnosis survival emerged only with grade-2 obesity or higher. While specific assumptions are required to obtain a valid estimate of the association of obesity with post-diagnosis survival among women with cancer,6–12 our results are consistent with previous WHI publications. For example, breast cancer deaths were ~2-fold higher among women with grade-2+3 obesity compared with those with normal BMI.16 Similarly, for colorectal cancer, other studies find associations of higher BMI with increased colorectal cancer incidence,17 but little evidence of a relationship with death following a colorectal cancer diagnosis in analyses restricted to colorectal cancer survivors followed from diagnosis to death.18
Parsing the relationship of a risk factor to disease-specific mortality into its component associations of incidence and survival has important implications for translation and is relevant across a variety of exposures and diseases. If a risk factor is strongly associated with increased disease incidence, as in the case of higher BMI with breast and colorectal cancers, then greater disease-specific mortality is expected even when there is little influence on survival, and this can be explicitly shown mathematically (Appendix special case #2). A prior example of this in WHI is that estrogen plus progestin hormone therapy is not associated with survival after a diagnosis of breast cancer, but is associated with increased breast cancer incidence, and therefore with increased breast cancer mortality among WHI women.19 Another possible scenario is that a risk factor’s associations with disease incidence versus post-disease survival are in opposing directions, leading to overall null associations.
This methodological illustration does not answer the question of whether weight change following cancer diagnosis influences mortality outcomes. If pre-diagnosis obesity leads to more aggressive tumors with inferior survival, then reducing obesity after diagnosis may have little impact on prognosis. Alternatively, if a risk factor’s association with survival is due to promoting disease progression, then intervention to mitigate that risk factor would likely benefit a patient’s prognosis. Analysis of BMI at diagnosis among cancer patients followed from diagnosis (T2) is relevant to the clinician counseling a newly diagnosed patient and thus has been the subject of various narrative reviews20,21 and meta-analyses.22,23 Of note, such analyses restricted to cancer survivors are subject to additional methodological concerns, including selection bias. Unless all possible common causes of cancer incidence and post-cancer mortality can be adjusted for, this form of bias will likely result in attenuated risk estimates. Our results are consistent with and shed light on this possibility: higher BMI at enrollment is strongly associated with incident cancer in the full cohort but associations with post-diagnosis survival among women with cancer emerge only with grade-2 obesity and above. There is also the possibility that women with a high BMI at enrollment develop and die from other conditions such as cardiovascular disease prior receiving to a cancer diagnosis. These important sources of bias and tools to address them (e.g., simulations, inverse probability weighting, and marginal structural models) have been discussed in detail by others.5–12
In analyses examining BMI and death after diagnosis among women diagnosed with cancer (T2), we first assumed BMI was approximately constant over time and used enrollment BMI as a proxy for at-diagnosis BMI. We subsequently updated BMI over follow-up until cancer diagnosis. Both analyses yielded similar results because enrollment BMI and BMI proximal to diagnosis were highly correlated (r=0.9) and few women migrated down one or more BMI categories over the period from enrollment to breast cancer diagnosis (7%) or from enrollment to colorectal cancer diagnosis (8%), some of which could be due to measurement error. This suggests a minimal impact of reverse causation (sub-clinical disease leading to weight loss) on the risk estimates in Figures 2 and 3. This was further examined in a sensitivity analysis; the inclusion of time dependent BMI (eFigures 2–3) yields similar conclusions to the main analysis using baseline BMI.
Strengths and Limitations
This study aids in the interpretation of evidence and resulting translation into clinical practice of cancer mortality studies by explicitly contrasting risk estimates for different time scales (from enrollment or from diagnosis) and different cohorts (all enrolled participants, or only those with a cancer diagnosis). Prior WHI publications on cancer mortality have taken a variety of approaches,16,19 but none has taken a purely conceptual focus as we have here.
The methodological issues addressed here (choice of time-scale and cohort) are far from the only concerns in studies of cancer mortality. It is also important to consider various aspects of exposure assessment. These include whether BMI is a valid measure of excess adiposity in post-menopausal women given age-related changes in body composition, possible threshold effects for different risk factors (which may vary by cancer site), and the time at which BMI was assessed in relation to diagnosis. For simplicity and comparability across models, this exercise emphasized BMI measured at cohort entry and used primarily covariates assessed at enrollment. We did adjust for time from cancer diagnosis in sensitivity analysis, consider richer models which updated BMI (Supplemental eFigures 2–3), and stratify by tumor grade, stage and age at diagnosis, but this did not provide compelling evidence of an association between enrollment BMI and breast cancer death among survivors followed from diagnosis (T2a; p-trend changed from 0.02 to 0.47 for ~C in eFigure 2).
Conclusion
Often, data is available on the timing of death from cancer, but not on the timing of diagnosis of cancer; researchers then follow all cohort members (rather than a survivor cohort) from study entry to cancer death.24–26 Such studies can highlight strategies to improve the health and longevity of the population, likely through primary prevention of cancer because interventions that reduce cancer incidence will reduce cancer mortality even if they have no effect on post-diagnosis survival. However, research on a pre-diagnosis exposure’s association with cancer mortality cannot distinguish the extent to which associations are driven by exposure’s association with cancer incidence versus with survival after cancer onset. To answer the clinical and public health questions of what can be done to improve survival once a cancer has been diagnosed, the most relevant observational analysis would be to examine changes in the risk factor (e.g., changes in weight after cancer diagnosis)7 with consideration given to potential biases.
Supplementary Material
NOVELTY AND IMPACT.
Question
If a risk factor increases disease incidence then greater disease-specific mortality is expected even with no influence on survival.
Findings
We parsed obesity’s association with cancer mortality into its components: obesity strongly increased cancer risk, but associations with post-diagnosis survival were apparent only with grade-2+ obesity.
Meaning
While obesity prevention might reduce cancer incidence and therefore cancer mortality, this analysis cannot determine how interventions to manage obesity in cancer patients influence survival.
Acknowledgments
National Cancer Institute Grants UM1CA173642-04, R01CA184953-02 and R01CA175011-01. WHI is funded by the National Heart, Lung, and Blood Institute, National Institutes of Health, U.S. Department of Health and Human Services through contracts HHSN268201100046C, HHSN268201100001C, HHSN268201100002C, HHSN268201100003C, HHSN268201100004C, and HHSN271201100004C.
References
- 1.Desai P, Lehman A, Chlebowski RT, et al. Statins and breast cancer stage and mortality in the Women's Health Initiative. Cancer Causes Control. 2015;26(4):529–539. doi: 10.1007/s10552-015-0530-7. [DOI] [PMC free article] [PubMed] [Google Scholar]
- 2.Taghizadeh N, Boezen HM, Schouten JP, Schroder CP, Elisabeth de Vries EG, Vonk JM. BMI and lifetime changes in BMI and cancer mortality risk. PLoS One. 2015;10(4):e0125261. doi: 10.1371/journal.pone.0125261. [DOI] [PMC free article] [PubMed] [Google Scholar]
- 3.Martin L, Birdsell L, MacDonald N, et al. Cancer cachexia in the age of obesity: skeletal muscle depletion is a powerful prognostic factor, independent of body mass index. Journal of clinical oncology. 2013 doi: 10.1200/JCO.2012.45.2722. JCO. 2012.2045. 2722. [DOI] [PubMed] [Google Scholar]
- 4.Eheman C, Henley SJ, Ballard-Barbash R, et al. Annual Report to the Nation on the status of cancer, 1975–2008, featuring cancers associated with excess weight and lack of sufficient physical activity. Cancer. 2012;118(9):2338–2366. doi: 10.1002/cncr.27514. [DOI] [PMC free article] [PubMed] [Google Scholar]
- 5.Hernan MA, Hernandez-Diaz S, Robins JM. A structural approach to selection bias. Epidemiology (Cambridge, Mass.) 2004;15(5):615–625. doi: 10.1097/01.ede.0000135174.63482.43. [DOI] [PubMed] [Google Scholar]
- 6.Banack HR, Stokes A. The 'obesity paradox' may not be a paradox at all. International journal of obesity (2005) 2017 doi: 10.1038/ijo.2017.99. [DOI] [PubMed] [Google Scholar]
- 7.Vansteelandt S. Asking too much of epidemiologic studies: the problem of collider bias and the obesity paradox. Epidemiology (Cambridge, Mass.) 2017 doi: 10.1097/EDE.0000000000000693. [DOI] [PubMed] [Google Scholar]
- 8.Viallon V, Dufournet M Re. Collider bias is only a partial explanation for the obesity paradox. Epidemiology (Cambridge, Mass.) 2017 doi: 10.1097/EDE.0000000000000691. [DOI] [PubMed] [Google Scholar]
- 9.Banack HR, Kaufman JS. From bad to worse: collider stratification amplifies confounding bias in the "obesity paradox". European journal of epidemiology. 2015;30(10):1111–1114. doi: 10.1007/s10654-015-0069-7. [DOI] [PubMed] [Google Scholar]
- 10.Sperrin M, Candlish J, Badrick E, Renehan A, Buchan I. Collider Bias Is Only a Partial Explanation for the Obesity Paradox. Epidemiology (Cambridge, Mass.) 2016;27(4):525–530. doi: 10.1097/EDE.0000000000000493. [DOI] [PMC free article] [PubMed] [Google Scholar]
- 11.Lennon H, Sperrin M, Badrick E, Renehan AG. The obesity paradox in cancer: a review. Current Oncology Reports. 2016;18(9):56. doi: 10.1007/s11912-016-0539-4. [DOI] [PMC free article] [PubMed] [Google Scholar]
- 12.Kroenke CH, Neugebauer R, Meyerhardt J, et al. Analysis of body mass index and mortality in patients with colorectal cancer using causal diagrams. JAMA oncology. 2016;2(9):1137–1145. doi: 10.1001/jamaoncol.2016.0732. [DOI] [PMC free article] [PubMed] [Google Scholar]
- 13.Study TWsHI. Design of the women’s health initiative clinical trial and observational study. Controlled clinical trials. 1998;19(1):61–109. doi: 10.1016/s0197-2456(97)00078-0. [DOI] [PubMed] [Google Scholar]
- 14.Curb JD, Mctiernan A, Heckbert SR, et al. Outcomes ascertainment and adjudication methods in the Women's Health Initiative. Annals of epidemiology. 2003;13(9):S122–S128. doi: 10.1016/s1047-2797(03)00048-6. [DOI] [PubMed] [Google Scholar]
- 15.Andersen PK, Esbjerg S, Sørensen TI. Multi-state models for bleeding episodes and mortality in liver cirrhosis. Statistics in medicine. 2000;19(4):587–599. doi: 10.1002/(sici)1097-0258(20000229)19:4<587::aid-sim358>3.0.co;2-0. [DOI] [PubMed] [Google Scholar]
- 16.Neuhouser ML, Aragaki AK, Prentice RL, et al. Overweight, obesity, and postmenopausal invasive breast cancer risk: A secondary analysis of the Women’s Health Initiative randomized clinical trials. JAMA oncology. 2015;1(5):611–621. doi: 10.1001/jamaoncol.2015.1546. [DOI] [PMC free article] [PubMed] [Google Scholar]
- 17.Heo M, Kabat GC, Strickler HD, et al. Optimal cutoffs of obesity measures in relation to cancer risk in postmenopausal women in the Women's Health Initiative Study. Journal of Women's Health. 2015;24(3):218–227. doi: 10.1089/jwh.2014.4977. [DOI] [PMC free article] [PubMed] [Google Scholar]
- 18.Kuiper JG, Phipps AI, Neuhouser ML, et al. Recreational physical activity, body mass index, and survival in women with colorectal cancer. Cancer Causes Control. 2012;23(12):1939–1948. doi: 10.1007/s10552-012-0071-2. [DOI] [PMC free article] [PubMed] [Google Scholar]
- 19.Chlebowski RT, Manson JE, Anderson GL, et al. Estrogen plus progestin and breast cancer incidence and mortality in the Women’s Health Initiative Observational Study. Journal of the National Cancer Institute. 2013;105(8):526–535. doi: 10.1093/jnci/djt043. [DOI] [PMC free article] [PubMed] [Google Scholar]
- 20.Jiralerspong S, Goodwin PJ. Obesity and Breast Cancer Prognosis: Evidence, Challenges, and Opportunities. Journal of Clinical Oncology. 2016 doi: 10.1200/JCO.2016.68.4480. JCO. 2016.2068. 4480. [DOI] [PubMed] [Google Scholar]
- 21.Parekh N, Chandran U, Bandera EV. Obesity in cancer survival. Annual review of nutrition. 2012;32 doi: 10.1146/annurev-nutr-071811-150713. [DOI] [PMC free article] [PubMed] [Google Scholar]
- 22.Chan DS, Vieira AR, Aune D, et al. Body mass index and survival in women with breast cancer-systematic literature review and meta-analysis of 82 follow-up studies. Ann Oncol. 2014;25(10):1901–1914. doi: 10.1093/annonc/mdu042. [DOI] [PMC free article] [PubMed] [Google Scholar]
- 23.Protani M, Coory M, Martin JH. Effect of obesity on survival of women with breast cancer: systematic review and meta-analysis. Breast cancer research and treatment. 2010;123(3):627–635. doi: 10.1007/s10549-010-0990-0. [DOI] [PubMed] [Google Scholar]
- 24.Akinyemiju T, Moore JX, Pisu M, et al. A prospective study of dietary patterns and cancer mortality among Blacks and Whites in the REGARDS cohort. Int J Cancer. 2016 doi: 10.1002/ijc.30287. [DOI] [PMC free article] [PubMed] [Google Scholar]
- 25.Hong JS, Yi SW, Yi JJ, Hong S, Ohrr H. Body Mass Index and Cancer Mortality Among Korean Older Middle-Aged Men: A Prospective Cohort Study. Medicine (Baltimore) 2016;95(21):e3684. doi: 10.1097/MD.0000000000003684. [DOI] [PMC free article] [PubMed] [Google Scholar]
- 26.Mok Y, Jeon C, Lee GJ, Jee SH. Physical Activity Level and Colorectal Cancer Mortality: The Korean Metabolic Syndrome Mortality Study. Asia Pac J Public Health. 2016 doi: 10.1177/1010539516661761. [DOI] [PubMed] [Google Scholar]
Associated Data
This section collects any data citations, data availability statements, or supplementary materials included in this article.