

Abstract
The fruits of Piper cubeba have been used in Ayurvedic system of medicine for pain, tastelessness, painful urination and mouth diseases. Among its various chemical constituents, (-)-hinokinin, a trypanosomicidal dibenzylbutyrolactone lignan, is found in significant quantities. For quality evaluation of P. cubeba fruit and its commercial formulations, there is an urgent need to develop an analytical method based on (-)-hinokinin. For this purpose, an HPLC method was developed using photo diode array detector and Waters HR C18 column with gradient elution consisting of water and acetonitrile. The developed method was validated as per ICH-Q2B guidelines and found to be accurate, precise and linear over a wide range of concentrations (5–300 µg/mL). (-)-Hinokinin contents were found to be in the range of 0.005–0.109% (m/m) in various P. cubeba samples. The developed method was extended to LC–MS for further identification and characterization of (-)-hinokinin in samples. The developed method is simple, rapid and specific, and can be used as a tool for quality control of P. cubeba fruits and its commercial formulations.
Keywords: Piper cubeba, (-)-Hinokinin, HPLC, Quality control, Herbal formulations
1. Introduction
Piper cubeba (Fam.: Piperaceae), commonly known as cubeb or tailed pepper, is a woody, climbing, perennial herb grown in Indonesia mostly in Java and Sumatra islands. It is cultivated to some extent in southern India [1]. Economically, P. cubeba is important as a source of pepper (the dried berries) for the worldwide spice market [2], [3]. Its mature and dried fruits are the official plant parts mentioned in the Indian Ayurvedic Pharmacopoeia under the name ‘Kankola’ and recommended for a variety of ailments such as pain, tastelessness, painful urination and diseases [4]. In Indonesian traditional medicine the berries of P. cubeba, known as ‘kamukus’, are used to treat gonorrhea, dysentery, syphilis, abdominal pain, diarrhea, enteritis and asthma [5], [6]. Biological investigations have been carried out on various extracts of P. cubeba in order to prove its traditional use [6]. The methanol and water extracts of P. cubeba berries have been shown to display an inhibitory effect against the hepatitis C virus [7]. Anti-inflammatory, antioxidant, antiallergic and analgesic activities of P. cubeba have been studied using chemically induced edema and arthritis in vivo [8], [9]. Phytochemically P. cubeba has received less attention in comparison to other species of the Piper genus. Only three classes of secondary metabolites have been reported from the berries of P. cubeba, i.e., alkaloids, lignans and terpenoids (essential oil). The lignans and the essential oil have been more intensively investigated, since P. cubeba accumulates both groups of compounds in relatively high amounts. Twenty-four lignans have so far been reported from P. cubeba [10], [11], [12], [13], [14], [15]. Among these, (-)-hinokinin, a dibenzylbutyrolactone lignan, is found to accumulate in significant quantities. Furthermore, (-)-hinokinin was reported to exhibit potent biological activities such as trypanosomicidal, anti-inflammatory and analgesic effects [8], [9]. Owing to its significant accumulation and potent biological activities, (-)-hinokinin can be considered as the bio-active marker compound of P. cubeba. For quality evaluation of P. cubeba fruits and their commercial formulations, there is an urgent need to develop a rapid, reliable and reproducible analytical method based on the bio-active marker, (-)-hinokinin. High performance liquid chromatography–tandem mass spectrometry (HPLC–MS) has been used successfully in recent years for the identification and quantitation of several herbal formulations [16], [17]. HPLC provides specific, selective and sensitive quantitative results, often with reduced sample preparation and analysis time when compared to other techniques commonly employed. With this background, we have now developed and validated a simple, rapid and sensitive HPLC-PDA method for quantitative estimation of (-)-hinokinin and ESI-MS was used for its identification in single and multi-herbal formulations containing P. cubeba.
2. Experimental
2.1. Plant extract and commercial formulations
P. cubeba fruits were procured from local market (PCFI-1) and from two reputed Ayurvedic pharmacies viz. M/s Shree Dhootapapeshwar Pvt. Ltd., Mumbai, India (PCFI-2) and M/s IMIS Pharmaceuticals Pvt. Ltd., Vijayawada, India (PCFI-3). The commercial formulations of P. cubeba such as Khadiradi gutika bulk powder (Batch no.: P 120800187) (PCFF-1) and Khadiradi gutika tablet (Batch no.: P120600152) (PCFF-2) from M/s Shree Dhootapapeshwar Pvt. Ltd., Mumbai, Ganaprabha tablet (PCFF-3), Manasamitra gutika (PCFF-4) and Dhanwantari Gutika (PCFF-5) from M/s IMIS Pharmaceuticals Pvt. Ltd., Vijayawada, India, were procured.
2.2. Chemicals and solvents
HPLC grade acetonitrile was purchased from Fischer Scientific (Thermo Electron LLS India Pvt. Ltd., Mumbai, India). Ultrapure water was obtained from a MilliQ system (Millipore Corp., Bedford, MA, USA). Membrane filters F-450 (0.45 μm) were obtained from Pall Gelman Laboratory Ltd. (Portsmouth, UK). Sample tubes were obtained from Tarsons (Kolkata, India). A centrifuge (model 2-16P) supplied by Sigma (Zurich, Switzerland) was used.
2.3. Isolation of (-)-hinokinin
The fruits of P. cubeba were powdered in a pulverizer and the powdered material (285 g) was extracted with methanol (1000 mL) in a soxhlet extractor under hot conditions for 12 h. The resultant methanol solubles on concentration under reduced pressure afforded the methanol extract (33 g). Column chromatographic purification of the methanol extract (10 g) on the silica gel column using the gradient elution of hexane and ethyl acetate resulted in several fractions. Based on thin layer chromatography, one of the fractions (hexane:ethyl acetate: 70:30) was taken up for further chromatographic purification and a colorless semi-solid isolated (250 mg), Rf 0.45 (hexane:ethyl acetate: 70:30), ESI-MS (+ve mode): 355.1, IR (KBr, √max): 1780 (lactone), 1H NMR (400 MHz, CDCl3): 2.45 (m, 1H, H-3), 2.60 (m, 1H, H-2), 2.48 and 2.80 (2×m, each 1H, α′-H2), 2.84 and 3.0 (2×m, each 1H, α-H2), 3.86 and 4.12 (2×m, each 1H, H-1), 5.94 (s, 4H, 2× CH2O2), 6.44 6.76 (m, 6H, 2×Ar–H), 13C NMR (400 MHz, CDCl3): 178.33 (C1), 147.88 (C3′, C3″), 146.49 (C4′, C4″), 131.56 (C1′), 131.28 (C1″), 122.20 (C6′), 121.51 (C6″), 109.40 (C2″), 108.78 (C2′), 108.33 (C5′), 108.25 (C5″), 101.00 (–CH2O2), 71.13 (C4), 46.47 (C2), 41.26 (C3), 38.34 (α′), 34.81 (α″). Based on the above spectral data and comparison with reported values [18], the compound was identified as (-)-hinokinin {(2R, 3R)-2,3-di-(3,4-methylenedioxybenzyl)-butyrolactone} (Fig. 1).
Fig. 1.
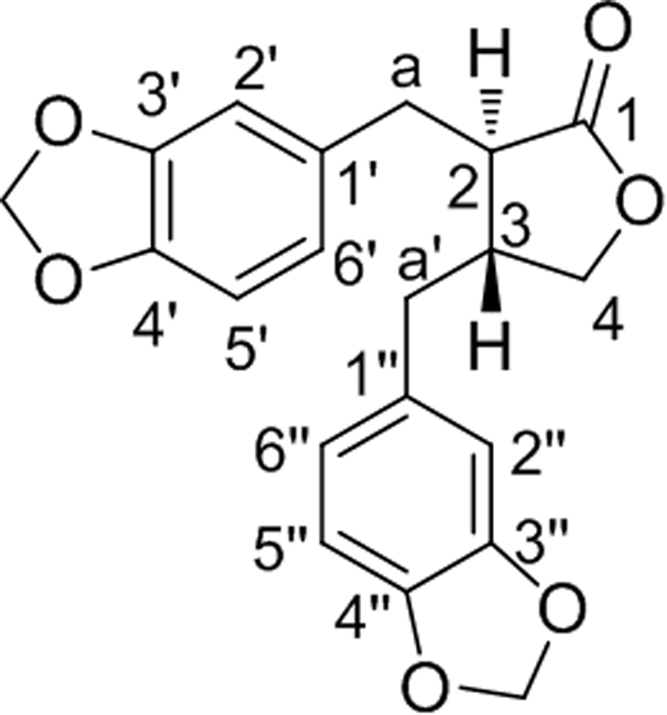
Chemical structure of (-)-hinokinin.
2.4. Preparation of reference standard
Reference standard solution of marker compound, (-)-hinokinin, was prepared by dissolving 5 mg in 5 mL of acetonitrile. Calibration standards ranging from 5 to 300 µg/mL were subsequently prepared by diluting with water:acetonitrile (50:50).
2.5. Preparation of samples
The methanolic extracts of P. cubeba fruit ingredient ((PCFI-1, PCFI-2 and PCFI-3) and the commercial formulations (PCFF-1 to PCFF-5) were prepared for the quantification of (-)-hinokinin. The test samples (5.0 g) were extracted with methanol (5×20 mL) in a sonicator bath at 3500 rpm for 30 min following the optimized protocols. The supernatants were collected, filtered and evaporated to dryness under reduced pressure and the samples were reconstituted using mobile phase (water:acetonitrile: 50:50, v/v) and then filtered using membrane filters of 0.45 μm pore size.
2.6. HPLC conditions
Chromatographic separation was achieved by reverse-phase chromatography using the gradient elution. Chromatography was performed on Waters HRC18 (300 mm×3.9 mm i.d., 6 μm particle size) (Waters, India) column. The mobile phase consisted of water as component A and acetonitrile as component B. A gradient elution program was used: from 0 min: 40%, B; 25.0 min: 60% B; 40.0 min: 70% B; 45 min: 70% B; 46.0 min: 40% B; 60.0 min stop time: 40% B; flow rate 1.0 mL/min was used. The chromatogram was monitored at 288 nm and UV spectra of individual peaks were recorded in the range of 200–400 nm. Chromatographic separation was performed using HPLC equipped with a degasser (G1379A), binary pump (G1312A), autosampler (G1329A), autosampler thermostat (G1329B) and diode array detector (G1315B) of Agilent Technologies 1100 series (Germany). The sample injection volume was 20 μL and the column temperature was maintained at ambient conditions (23±1 °C). The data were acquired and processed using Chemstation.
2.7. MS conditions
Identification of the markers was carried out using ion trap mass spectrometer and MS analysis was carried out in positive mode using electrospray ionization (ESI). Nitrogen was used as the nebulizer and curtain gas. The ion source conditions were set as follows: temperature, 335 °C; nebulizer gas, 220.6 kPa; dry gas, 10.0 L/min; ion spray voltage, 5000 V; collision energy, 33.0 V; electron multiplier voltage, 2100 V; declusturing potential, 54 V; focusing potential, 400 V; entrance potential, 10 V; collision exit potential, 27 V; and dwell time, 200 ms. LC/MSD trap software 4.2 (Bruker, Waldbronn, Germany) was used for mass spectrometer.
2.8. Method validation
Method validation including system suitability, specificity, linearity, LOD, LOQ, precision, accuracy, recovery and stability was carried out as per ICH-Q2B guidance [19].
2.8.1. System suitability
The system suitability parameters including capacity factor (K′), resolution (Rs), theoretical plates (N), height equivalent to theoretical plates (HETP) and asymmetry (As) were evaluated for the developed method.
2.8.2. Specificity
The peak purity results obtained from the diode array detector under the optimized chromagraphic conditions confirmed that peaks corresponding to markers were homogenous and not co-eluting with peaks that correspond to any other compound.
2.8.3. Linearity and calibration curve
Linearity of (-)-hinokinin was determined with seven concentration levels over the range of 5–300 μg/mL. The calibration curve was established by plotting the peak area (Y-axis) against concentration (X-axis) of the calibration solutions with linear regression analysis. Calibration curves showed that there was a linear correlation between peak area and concentration of standard solution. Linear regression analysis was followed and the correlation of coefficient (r2) was used as a measure of linearity.
2.8.4. LOD and LOQ
The limits of detection and quantification for each compound were determined by the signal-to-noise (S/N) ratio for (-)-hinokinin. LOD was calculated as the amount of the injected sample given a signal to noise ratio of 3, and LOQ was determined when the S/N ratio was 10.
2.8.5. Precision and accuracy
Precision (intra- and inter-day) and repeatability were carried out on the P. cubeba samples. Percentage relative standard deviation (% RSD) was considered as a measure of precision and repeatability. The P. cubeba samples were prepared and analyzed for (-)-hinokinin concentration on the same day (n=15) and on three consecutive days (n=5) for intra- and inter-day precision, respectively. For repeatability, the P. cubeba samples were prepared on three different days and analyzed for (-)-hinokinin content (n=5). The accuracy of the method was determined by % accuracy of (-)-hinokinin obtained from the P. cubeba samples.
2.8.6. Recovery
Recovery of the method was studied using a standard addition method. (-)-Hinokinin (at 100% concentration level) was added to PCFI-1 and the sample was processed as per sample preparation method described in Section 2. Mean percentage (%) recovery of PCFI-1 was used as a measure of accuracy and was calculated using the following formula: percentage recovery=(amount detected×100/theoretical amount).
2.8.7. Stability
The stability of the analyte was tested for 24 h at room temperature (25±1 °C) and refrigerator temperature (4 °C). The peak area of the freshly prepared (-)-hinokinin standard solution (100 μg/mL) was compared with the stability samples at different temperatures collected at different time intervals.
3. Results and discussion
It has been realized internationally that marker compound based on standardization of herbal drugs is the most reliable quality control tool for providing consistent and efficacious herbal formulations [20], [21], [22], [23], [24]. In the present study, a similar approach was used to standardize the traditionally important herbal medicine, P. cubeba, using the HPLC method. The chromatographic conditions with respect to mobile phase, gradient elution and column were optimized based on peak shape, response and peak resolution of (-)-hinokinin. The gradient elution of the mobile phase was used for the best resolution in the crude extracts and herbal formulations (Fig. 2).
Fig. 2.

HPLC-DAD profiles of (A) (-)-hinokinin; (B) PCFI-1; (C) PCFI-2; (D) PCFI- 3; (E) PCFF-1; (F) PCFF-2; (G) PCFF-3; (H) PCFF-4; (I) PCFF-5.
The mass spectrometer with an electrospray ion source (ESI) interface was used for MS analysis. The MS spectra of (-)-hinokinin exhibited the ions m/z 377[M+Na]+, 355 [M+H]+, 337, 319, 173, 135. The possible fragmentation pattern of (-)-hinokinin is illustrated in Fig. 3. Similar mass fragmentation pattern was observed in samples for (-)-hinokinin (Fig. 4).
Fig. 3.

Possible MS fragmentation pattern of (-)-hinokinin.
Fig. 4.

Mass spectra of (A) (-)-hinokinin; (B) PCFI-1; (C) PCFI-2; (D) PCFI-3; (E) PCFF-1; (F) PCFF-2; (G) PCFF-3; (H) PCFF-4; (I) PCFF-5.
3.1. Method validation
The analytical method was validated to meet the acceptance criteria as per International Conference on Harmonization of technical requirements for registration of pharmaceuticals for human use (ICH) guidelines.
System suitability tests were used to verify whether the system is adequate for the analysis to be performed, and the parameters for (-)-hinokinin were evaluated. The suitability parameters of chromatographic system are given in Table 1.
Table 1.
System suitability parameters.
| Parameter | Values |
|---|---|
| Resolution (R) | 2.27 |
| Capacity factor (K′) | 2.13 |
| Theoretical plates (N) | 4527 |
| HETP (H) | 0.091 |
| Asymmetry (As) | 1.02 |
The retention time of (-)-hinokinin (17.60±0.10 min) in the standard and samples was the same and the UV spectra of (-)-hinokinin in samples were similar to those in standard (-)-hinokinin (Fig. 5). This emphasizes that the developed method was specifically for (-)-hinokinin.
Fig. 5.

Overlaid UV spectra of standard (-)-hinokinin and samples.
Seven different concentrations ranging from 5 to 300 μg/mL were used for the calibration plot. The method showed excellent linearity (r2, 0.999) with the regression equation y=66.718x−57.958 in the above concentration range.
The LOD and LOQ for (-)-hinokinin were found to be 0.8 µg/mL and 2.5 µg/mL, respectively.
The P. cubeba sample was used for the determination of intra- and inter-day precision and accuracy. The % RSD values for precision of (-)-hinokinin were found to be in the range of 0.058–0.593% and 0.094–1.005%, respectively (Table 2). The intra- and inter-day accuracy of (-)-hinokinin was found to be in the range of 99.86–100.04% and 99.71–100.00%, respectively (Table 2)
Table 2.
Results of precision and accuracy (n=5).
| Sample no. | Concentration (μg/mL) | Intra-day |
Inter-day |
||
|---|---|---|---|---|---|
| Accuracy (%) | RSD (%) | Accuracy (%) | RSD (%) | ||
| 1 | 10 | 99.86 | 0.593 | 99.71 | 1.005 |
| 2 | 50 | 100.04 | 0.235 | 100.00 | 0.244 |
| 3 | 100 | 100.00 | 0.058 | 99.96 | 0.094 |
The data on recovery were obtained by spiking known concentrations of standard (-)-hinokinin in the low, medium and higher ranges (5, 15, 30 μg/mL, respectively) of the P. cubeba. Mean recovery for (-)-hinokinin was found to be 97.21–99.43% (Table 3).
Table 3.
The recovery of hinokinin from spiked samples (n=6).
| Sample code | Initial amount | Added amount | Detected amount | Recovery (%) | Mean recovery |
|---|---|---|---|---|---|
| (μg) | (μg) | (μg) | ±RSD (%) | ||
| PCFI-1 | 84.98 | 30 | 112.95 | 98.24 | 97.21±1.22 |
| 84.98 | 15 | 97.49 | 97.51 | ||
| 84.98 | 5 | 86.29 | 95.91 | ||
| PCFI-2 | 109.00 | 30 | 138.98 | 99.99 | 98.86±1.08 |
| 109.00 | 15 | 121.33 | 97.85 | ||
| 109.00 | 5 | 112.57 | 98.75 | ||
| PCFI-3 | 7.80 | 30 | 38.49 | 101.85 | 99.43±2.12 |
| 7.80 | 15 | 22.45 | 98.50 | ||
| 7.80 | 5 | 12.53 | 97.95 | ||
(-)-Hinokinin was found to be stable for 24 h at room temperature and refrigerator temperature against the freshly prepared (-)-hinokinin standard solution (100 μg/mL).
3.2. Method applicability
The validated method was applied for quantitative determination of (-)-hinokinin in various traditional Ayurvedic and herbal commercial formulations (Table 4). The (-)-hinokinin content was found to be in the range of 0.005–0.109% (m/m) with the high- and low-yielding samples being PCFI-2 and PCFF-4, respectively. The (-)- hinokinin content in the ingredients PCFI-1 and PCFI-2 is almost comparable, whereas it is tenfold less in the ingredient PCFI-3. It could be mentioned here that the first two samples used are raw fruits, while the third one is a processed fruit powder. It is a general observation that the fresh raw plant ingredients yield more extractives than the stored powdered materials. This may be the reason for the low yield of (-)-hinokinin in the third ingredient. In case of Khadiradi gutika formulation, the powder form (PCFF-1) gave more (-)-hinokinin content (0.040%) than the tablet form (PCFF-2) (0.006%). In case of tablets, the ingredients are adhered strongly to binders and excipients, for which the (-)-hinokinin content in tablets was found to be low. In case of other formulations, the (-)-hinokinin content is proportional to the number of ingredients used in each formulation. In conclusion, a new, simple, rapid and sensitive HPLC–MS method has been developed and validated for quantitative estimation of (-)-hinokinin in P. cubeba fruit and its commercial formulations. The developed method can be used as a quality control tool for maintaining the quality of raw plant material, which is very essential for maintaining the claimed therapeutic activity of the P. cubeba formulations.
Table 4.
Accumulation of hinokinin in various P. cubeba samples.
| Sample no. | Sample ID | Retention time (min) | Quantity (m/m, %) (RSD) |
|---|---|---|---|
| 1 | PCFI-1 | 17.60 | 0.084 (1.224) |
| 2 | PCFI-2 | 17.60 | 0.109 (1.082) |
| 3 | PCFI-3 | 17.60 | 0.008 (2.122) |
| 4 | PCFF-1 | 17.70 | 0.040 (0.245) |
| 5 | PCFF-2 | 17.64 | 0.006 (1.250) |
| 6 | PCFF-3 | 17.50 | 0.020 (0.445) |
| 7 | PCFF-4 | 17.70 | 0.005 (1.105) |
| 8 | PCFF-5 | 17.60 | 0.011 (0.532) |
Acknowledgments
The authors wish to thank the Director of CSIR-IICT for support and constant encouragement. We are also thankful to Dr. V. Nagalakshmi, IMIS Pharmaceuticals Pvt. Ltd., Vijayawada, India, and M/s Shree Dhootapapeshwar Pvt. Ltd., Mumbai, India, for providing P. cubeba samples.
Footnotes
Peer review under responsibility of Xi׳an Jiaotong University.
References
- 1.Lim T.K. Springer; New York: 2012. Edible Medicinal and Non-Medicinal Plants, Volume 4, Fruits. pp. 311–321. [Google Scholar]
- 2.Usia T., Watabe T., Kadota S. Potent CYP3A4 inhibitory constituents of Piper cubeba. J. Nat. Prod. 2005;68:64–68. doi: 10.1021/np0401765. [DOI] [PubMed] [Google Scholar]
- 3.Usia T., Watabe T., Kadota S. Metabolite cytochrome P450 complex formation by methylene dioxyphenyl lignans of Piper cubeba mechanism based inhibition. Life Sci. 2005;76:2381–2391. doi: 10.1016/j.lfs.2004.12.005. [DOI] [PubMed] [Google Scholar]
- 4.Khare C.P. Springer-Verlag; Berlin: 2004. Indian Herbal Remedies, Rational Western Therapy, Ayurvedic and Other Traditional Usage, Botany. p. 366. [Google Scholar]
- 5.Satroamidjojo S. Dian Rakyat; Jakarta: 2001. Obat Asli Indonesia. p. 149. [Google Scholar]
- 6.Bos R., Woerdenbag H.J., Kayser O. Essential oil constituents of Piper cubeba L. fils. from Indonesia. J. Essent. Oil Res. 2007;19:14–17. [Google Scholar]
- 7.Hussein G., Miyashiro H., Nakamura N. Inhibitory effects of Sudanese medicinal plant extracts on hepatitis C virus (HCV) protease. Phytother. Res. 2000;14:510–516. doi: 10.1002/1099-1573(200011)14:7<510::aid-ptr646>3.0.co;2-b. [DOI] [PubMed] [Google Scholar]
- 8.Choi E.M., Hwang J.K. Investigations of anti-inflammatory and antinociceptive activities of Piper cubeba, Physalis angulata and Rosa hybrida. J. Ethanopharmacol. 2003;89:171–175. doi: 10.1016/s0378-8741(03)00280-0. [DOI] [PubMed] [Google Scholar]
- 9.Choi E.M., Hwang J.K. Effect of some medicinal plants on plasma antioxidant system and lipids levels in rats. Phytother. Res. 2005;19(5):382–386. doi: 10.1002/ptr.1464. [DOI] [PubMed] [Google Scholar]
- 10.Prabhu B.R., Mulchandani N.B. Lignans from Piper cubeba. Phytochemistry. 1985;24:329–331. [Google Scholar]
- 11.Badheka L.P., Prabhu B.R., Mulchandani N.B. Dibenzylbutyrolactone lignans from Piper cubeba. Phytochemistry. 1986;25:487–489. [Google Scholar]
- 12.Badheka L.P., Prabhu B.R., Mulchandani N.B. Lignans of Piper cubeba. Phytochemistry. 1987;26:2033–2036. [Google Scholar]
- 13.Koul J.L., Koul S.K., Taneja S.C. Oxygenated cyclohexanes from Piper cubeba. Phytochemistry. 1996;41:1097–1099. [Google Scholar]
- 14.Parmar V.S., Jain S.C., Bishit K.S. Phytochemistry of genus Piper. Phytochemistry. 1997;46:597–673. [Google Scholar]
- 15.Saraiva L.R., Korsching S.I. A novel olfactory receptor gene family in Teleost fish. Genome Res. 2007;17:1448–1457. doi: 10.1101/gr.6553207. [DOI] [PMC free article] [PubMed] [Google Scholar]
- 16.Mallvadhani U.V., Panigrahi R., Banitha P. A rapid and highly sensitive UPLC-Q TOF MS method for quantitrative evaluation of Nardostachys jatamansi using nardin as the marker. Biomed. Chromatogr. 2011;25:902–907. doi: 10.1002/bmc.1540. [DOI] [PubMed] [Google Scholar]
- 17.Bhagyashree K., Gupta A., Patil D. Quantitative estimation of gymnemagenin in Gymnema sylvestraeextract and its marketed formulations using the HPLC–ESI-MS/MS method. Phytochem. Anal. 2012;24:135–140. doi: 10.1002/pca.2392. [DOI] [PubMed] [Google Scholar]
- 18.Lopes L.M.X., Yoshida M., Gottlieb O.R. Dibenzylbutyrolactone lignans from Virola sebifera. Phytochemistry. 1983;22:1516–1518. [Google Scholar]
- 19.ICH-Q2B Validation of Analytical Procedure: Methodology, International Conference on Hormonisation, Geneva, 1996, pp. 1–11.
- 20.Warude D., Patwardhan B. Botanicals quality and regulatory issues. J. Sci. Ind. Res. 2005;64:83–92. [Google Scholar]
- 21.WHO . WHO Press, World Health Organization; Geneva, Switzerland: 2011. Quality Control Methods for Medicinal Plant Materials-Revised Draft Update. pp. 1–173. [Google Scholar]
- 22.Chitlange S.S., Kulkarni P.S., Patil D. High performance liquid chromatographic fingerprint for quality control of Terminalia arjuna containing Ayurvedic churna formulations. J. AOAC Int. 2009;92:1016–1020. [PubMed] [Google Scholar]
- 23.Patil D., Gautam M., Mishra S. Phytochemical stability and biological activity of Withania somnifera extract on real time and accelated storage conditions. Planta Med. 2010;76:481–488. doi: 10.1055/s-0029-1186220. [DOI] [PubMed] [Google Scholar]
- 24.Patil D., Gautam M., Mishra S. Estimation of Protoberberine alkaloids in Tinospora cordifolia stem crude powder, processed extracts and marketed formulation using HPLC-DAD method. Chromatographia. 2010;71:341–345. [Google Scholar]