

Abstract
Proper organization and dynamics of the actin and microtubule (MT) cytoskeleton are essential for growth cone behaviors during axon growth and guidance. The MT-associated protein tau is known to mediate actin/MT interactions in cell-free systems but the role of tau in regulating cytoskeletal dynamics in living neurons is unknown. We used cultures of cortical neurons from postnatal day (P)0–P2 golden Syrian hamsters (Mesocricetus auratus) of either sex to study the role of tau in the organization and dynamics of the axonal growth cone cytoskeleton. Here, using super resolution microscopy of fixed growth cones, we found that tau colocalizes with MTs and actin filaments and is also located at the interface between actin filament bundles and dynamic MTs in filopodia, suggesting that tau links these two cytoskeletons. Live cell imaging in concert with shRNA tau knockdown revealed that reducing tau expression disrupts MT bundling in the growth cone central domain, misdirects trajectories of MTs in the transition region and prevents single dynamic MTs from extending into growth cone filopodia along actin filament bundles. Rescue experiments with human tau expression restored MT bundling, MT penetration into the growth cone periphery and close MT apposition to actin filaments in filopodia. Importantly, we found that tau knockdown reduced axon outgrowth and growth cone turning in Wnt5a gradients, likely due to disorganized MTs that failed to extend into the peripheral domain and enter filopodia. These results suggest an important role for tau in regulating cytoskeletal organization and dynamics during growth cone behaviors.
SIGNIFICANCE STATEMENT Growth cones are the motile tips of growing axons whose guidance behaviors require interaction of the dynamic actin and microtubule cytoskeleton. Tau is a microtubule-associated protein that stabilizes microtubules in neurons and in cell-free systems regulates actin–microtubule interaction. Here, using super resolution microscopy, live-cell imaging, and tau knockdown, we show for the first time in living axonal growth cones that tau is important for microtubule bundling and microtubule exploration of the actin-rich growth cone periphery. Importantly tau knockdown reduced axon outgrowth and growth cone turning, due to disorganized microtubules that fail to enter filopodia and co-align with actin filaments. Understanding normal tau functions will be important for identifying mechanisms of tau in neurodegenerative diseases such as Alzheimer's.
Keywords: growth cone, microtubule, tau
Introduction
Growth cones are the motile tips of growing axons that extend toward targets during neural development. In the central region stable bundled acetylated microtubules (MTs) predominate and form loops in paused growth cones (Tanaka and Kirschner, 1991; Szebenyi et al., 1998; Dent et al., 1999; Dent and Kalil, 2001). Dynamic tyrosinated MTs, capable of growth and shortening in dynamic instability (Mitchison and Kirschner, 1984), extend from the central to the peripheral region. In the transition zone between the central and the peripheral domains MTs explore the growth cone lamellipodium and colocalize with the actin cytoskeletal meshwork of branched actin filaments (Dent et al., 2011). The crosstalk between actin and MTs is essential for growth cone extension and steering (Lowery and Van Vactor, 2009; Vitriol and Zheng, 2012; Coles and Bradke, 2015). Filopodia at the growth-cone leading edge are an important region of actin–MT interaction where MT polymerization is guided along actin filament bundles (Dent and Kalil, 2001; Schaefer et al., 2002; Zhou et al., 2002). Although a number of cross linker proteins such as MT plus end tracking proteins (+TIPS) and other MT-associated proteins (MAPs) has been identified, the mechanisms that regulate actin/MT interactions in cells are not completely understood (Coles and Bradke, 2015). These mechanisms are important for understanding how growth cones respond to guidance cues and elongate toward appropriate targets.
Tau is a MT-associated protein found predominantly in neurons (Morris et al., 2011). Tau primarily distributes in axons where it stabilizes MTs upon binding, promotes their assembly, and regulates MT dynamic instability (Wang and Mandelkow, 2016). Consistent with a developmental role of tau, tau colocalizes with MTs in the distal axons of cultured hippocampal neurons (Kempf et al., 1996) and is found in axonal growth cones (Mandell and Banker, 1995, 1996; Black et al., 1996; Zmuda and Rivas, 2000; Li et al., 2014). This suggests that tau is not only a MT stabilizer but also associates with dynamic MTs. However the function of tau in living growth cones has not been studied. The rapidly changing association of tau with MTs has recently been imaged at the single molecule level in axons of living cortical neurons to show that even brief association of tau with MTs is sufficient to promote MT assembly (Janning et al., 2014). Tau has also been shown to bind actin filaments in cell-free systems (Henríquez et al., 1995; Farias et al., 2002; Fulga et al., 2007; He et al., 2009) in neuronal cell lines (Yu and Rasenick, 2006; Sharma et al., 2007) and, during synaptic activation, in the dendrites of mature cortical neurons (Frandemiche et al., 2014). However, the association of tau with actin filaments has received relatively little attention (Gallo, 2007). Recently tau was identified as a molecular linker between MTs and actin filaments in a cell-free system (Elie et al., 2015). In this study of isolated MTs and actin filaments live-cell imaging showed that tau binds to MTs and actin filaments and promotes co-organization and coupled growth of both cytoskeletal networks by mediating co-alignment of dynamic MTs and actin filaments. However the role of tau in mediating actin/MT interactions has not been studied in living neurons. Given the central role of tau in neurodegenerative diseases (Ferrer et al., 2005; Ballatore et al., 2007; Noble et al., 2013; Arendt et al., 2016; Guo et al., 2017), such as Alzheimer's, it is important to understand the normal interactions of tau with the cytoskeleton to determine how tau pathologies may lead to cytoskeletal alterations and disruption of synaptic plasticity.
In the present study we therefore sought to identify the role of tau in mediating the organization and dynamics of MTs in neuronal growth cones. Using high-resolution live-cell imaging and super resolution microscopy, we show for the first time that in axonal growth cones tau regulates MT organization and mediates the ability of MTs to explore the actin-rich growth cone periphery. Accordingly, we found that disruption of the growth cone cytoskeleton with tau knockdown led to defects in cortical axon outgrowth and guidance.
Materials and Methods
Plasmids and reagents.
To knockdown all the isoforms of hamster tau we designed two shRNA oligonucleotides targeting the 5′ end of tau transcript. The 62mer sequences are as follows:
shRNA1: 5′-GATCCCCGCCAGGAGTTTGACACAGTTTCAAGAGAACTGTGTCAAACTCCTGGCTTTTTA-3′ and shRNA2: 5′-GATCCCCGATCATGCTGAGGGCTATGTTCAAGAGACATAGCCCTCAGCATGATCTTTTTA-3′. The shRNA sense and reverse complement sequences are underlined and separated by a 9 bp linker. These oligonucleotides were cloned into commercially available pSUPER.neo + GFP mammalian expression vector (Oligoengine) and pSUPER.neo + pmTurquoise (McVicker et al., 2016). Human tau isoforms tau4RL/4R2N were PCR amplified from tau/pET29b plasmid (gift from Peter Klein, School of medicine at University of Pennsylvania; Addgene, plasmid #16316) and cloned into eukaryotic expression plasmid pCAX with N-terminal fused GFP or tdTomato between restriction sites Not1 and BglII. Three 3R tau isoforms, 3RS/3R0N, 3R1N, and 3R2N, were generated by deleting the second MT binding domain and either one of or two of the N-terminal inserts of tau4RL/4R2N isoform by overlap extension PCR. These constructs were tagged with GFP or tdTomato in the N-terminus cloned into pCAX vector between restriction sites Not1 and BglI. We also used pCMV-EB3 (end-binding protein 3)-tdTomato (gift from Erik Dent, University of Wisconsin-Madison; Addgene, plasmid #50708), pCMV-F-tractin-tdTomato (gift from Michael Schell, Uniformed Services University), and mRuby-lifeact (Saengsawang et al., 2013) to label cytoskeletal components.
Dissociated cell culture and transfection.
All animal procedures were approved by the University of Wisconsin Committee on Animal care and were in accordance with the NIH guidelines. Dissociated cultures were prepared as previously described (Li et al., 2009). Briefly, cultures were prepared from sensorimotor cortex obtained from postnatal day (P)0–P2 golden Syrian hamsters (Mesocricetus auratus) of either sex, as described previously (Dent et al., 2003). Neuronal transfection was performed with a Nucleofector (Amaxa, Lonza) and Mouse Neurons Kit (Amaxa, Lonza) according to the recommended protocol. Dissociated primary cortical neurons nucleofected with hamster tau shRNA and human tau4RL or tau3RS were cultured for 48–72 h in plastic dishes coated with 0.01 mg/ml poly-d-lysine (Sigma-Aldrich) and were incubated in 5% CO2 and 9% O2 at 37°C. Neurons were plated in neurobasal media with 5% fetal bovine serum, B27 supplement, 2 mm glutamine, 0.3% glucose, and 37.5 mm NaCl. To allow sufficient time for the expression of shRNA constructs and at the same time follow early axonal development we replated neurons 48–72 h later. For replating, neurons were first washed with prewarmed PBS, detached from plastic dishes with Accutase cell dissociating reagent (ThermoFisher Scientific), pelleted at 500 rpm for 7 min and plated at a density of 5000 cells/cm2 on no. 1.5 German glass coverslips or glass bottom imaging chambers coated 0.1 mg/ml poly-d-lysine (Sigma-Aldrich). Cortical neurons were maintained in culture for additional 24 h before imaging and Western blot assays.
Western blots.
To verify the efficacy of the two hamster tau shRNA constructs, P0 hamster cortical neurons were nucleofected with either pSUPER-GFP control or tau shRNA-GFP plasmids. A transfection efficiency of 40–60% was achieved by nucleofection. To allow for sufficient expression of shRNA the transfected neurons were plated for 48–72 h and then lysed in RIPA buffer (ThermoFisher Scientific) with protease inhibitor (complete protease inhibitor, Roche) and phosphatase inhibitor tablets (PhosSTOP, Roche). To verify the specificity of hamster tau shRNA constructs, lysates were also obtained from HEK cells transfected (Lipofectamine 3000, ThermoFisher Scientific) with either pSUPER-GFP control or tau shRNA-GFP plasmids. Total protein concentration in the lysates was measured using BCA protein assay (ThermoFisher Scientific). Ten to 15 μg of protein was subjected to SDS-PAGE electrophoresis, transferred to PVDF membranes, and blocked in 10% bovine serum albumin (BSA). Blots were probed with polyclonal rabbit anti-tau (1:10,000; Dako, A0024) and polyclonal rabbit anti-GAPDH (1:500; Abcam, 9485) followed by goat anti-rabbit-HRP (1:5000; ThermoFisher Scientific). The presence of three repeat tau and four-repeat tau isoforms in hamster neuronal lysates was probed with monoclonal anti-3RTau (1:1000; clone 8E6/C11, Millipore, 05-803) and polyclonal rabbit anti 4R-Tau (1:2000; Cosmo Bio, TIP-4RT-P01) primary antibodies and goat anti-mouse HRP (1:5000; ThermoFisher Scientific) and goat anti-rabbit-HRP (1:5000; ThermoFisher Scientific) secondary antibodies, respectively. Band densities were determined by Image Studio Lite software (LI-COR Biosciences).
Immunocytochemistry.
Cortical neurons were pre-extracted for 90 s in 0.4% Glutaraldehyde (Electron Microscopy Sciences) and 0.2% Triton X-100 (Sigma-Aldrich) in PHEM buffer (60 mm PIPES, 27 mm HEPES, 10 mm EGTA, 8 mm MgSO4 pH 7.0) and postfixed in 3% Glutaraldehyde in PHEM buffer for 15 min at 37°C. After fixation samples were washed in PBS with 0.5% BSA and permeabilized in 0.5% Triton X-100. Free aldehydes were quenched with 5 mg/ml sodium borohydride (Sigma-Aldrich) for 5 min. Samples were washed for 5 min in PBS three times and incubated with blocking solution (10% BSA in PBS) for 1 h. Microtubules were probed with monoclonal rat anti-tyrosinated tubulin (clone YL1/2; Abcam, 6160) and monoclonal mouse anti-acetylated tubulin (clone 6-11B-1; Sigma-Aldrich, T745) antibodies. The expression of pSUPER-GFP and tau shRNA-GFP in neurons was verified with polyclonal rabbit anti-GFP (Abcam, 6556) and polyclonal chicken anti-GFP (Abcam, 13970) antibodies. Endogenous hamster tau expression was detected with polyclonal rabbit anti-tau (KJ9A; Dako, A0024). Secondary antibodies used were as follows: anti-mouse AlexaFluor 594 (ThermoFisher Scientific), anti-rabbit AlexaFluor 594 (ThermoFisher Scientific), and anti-rat Alex Fluor 647 (ThermoFisher Scientific). F-actin was visualized with phalloidin conjugated to AlexaFluor 555 (ThermoFisher Scientific). For wide-field microscopy coverslips were mounted in Fluoromount G (Southern Biotech) and for stimulation emission depletion (STED) microscopy coverslips were mounted in ProLong diamond antifade reagent (ThermoFisher Scientific).
Imaging of fixed cells with STED microscopy.
Growth cones were imaged with a 100×, NA 1.4 oil objective on a Leica TCS SP8 STED microscope. AlexaFluor 488-labeled probes were excited with the 488 nm wavelength of a pulsed white light (WL) laser and depleted with a continuous wave (CW) 592 nm STED laser, AlexaFluor 555-labeled probes were excited with the 555 nm wavelength of a WL laser and depleted with a CW 660 nm STED laser, AlexaFluor 647-labeled probes were excited with the 647 nm wavelength of a WL laser and depleted with a CW 775 nm STED laser, AlexaFluor 594-labeled probes were excited with the 594 wavelength of a WL laser and depleted with a CW 775 nm STED laser. Leica HyD detector with a time gate of 0.5 ≤ tg ≤ 6 ns. Image frames (1024 × 1024) were acquired sequentially line-by-line at scan speed of 400 lines/s with a pixel size of 25 nm. Deconvolution of STED data was performed using the calculated default deconvolution settings in Huygens Professional Deconvolution software v14.10 (Scientific Volume Imaging) that were estimated from the metadata.
Measurements of MT bundling.
Growth cones with MT loops and a diameter >10 μm were categorized as paused growth cones and growth cones with a diameter of 5–10 μm were categorized as extending. The intensity across a 200 pixel width of the growth cone was normalized to the highest intensity value in a given growth cone. The average fluorescence intensity values (n = 20 growth cones for each group) were plotted against the growth cone diameter.
Measurement of tau immunofluorescence intensity.
To verify the efficacy of tau knockdown, hamster tau-shRNA-Turq constructs were nucleofected into dissociated P0 hamster cortical neurons and plated for 36 h, then fixed with 4% paraformaldehyde-KREB-sucrose buffer at 37°C and stained for rat anti-tyrosinated tubulin (clone YL1/2; Abcam, 6160) and polyclonal rabbit anti-tau (KJ9A; Dako, A0024). Wide-field images were acquired with a 40× 1.3 NA Plan Fluor objective mounted on a Nikon TE2000E Quantum inverted microscope equipped with an Evolve EMCCD. The background fluorescence intensity was subtracted and tau fluorescence intensities in three different regions of interest along axons were measured and averaged for each neuron.
Measurements of axon outgrowth.
Neurons expressing hamster tau shRNA-GFP or control pSUPER-GFP were fixed 24–48 h after replating, and stained for GFP and tyrosinated tubulin. Wide-field images were acquired with a 10× 0.3 NA Plan Fluor objective mounted on a Nikon TE300 Quantum inverted microscope equipped with a Photometrics Cascade II: 512. 3 independent experiments were performed for each group. Axon lengths were measured in Fiji open-source image processing software (NIH) and axon lengths >50 μm were used for analysis.
Live-cell imaging with TIRF microscopy.
The total internal reflection fluorescence (TIRF) microscope consisted of a Nikon TE2000E base with TIRF illuminator, a Nikon 100×/1.49 NA Plan Apo TIRF objective, a Nikon perfect focus system for continuous automatic focusing of the sample during time-lapse imaging, a motorized x–y stage (Prior Scientific), a Lumen Pro200 fluorescent illumination system consisting of a 200 W metal halide lamp and six-position excitation filter wheel and fiber optic illuminator (Prior Scientific), and a 10-position emission filter wheel. Images were recorded using an Evolve EMCCD or Coolsnap HQ-cooled interline charge-coupled device camera (Photometrics). For TIRF illumination two lasers were used: a 40 mW argon laser for EGFP illumination and a 10 mW solid-state 561 nm laser for tdTomato illumination (both Melles–Griot). During time-lapse microscopy neurons were kept with in a 37°C incubation chamber (Solent) custom fitted to the microscope. To record dynamics of EB3-tdT comets, fluorescent images of live cells were acquired in a single channel at the rate of one frame per 3 s (0.33 Hz) over a period of 5–10 min. To record dynamics of EB3-tdT and mRuby-Lifeact, fluorescent images of live cells were acquired in a dual channel at the rate of one frame per 3 s (0.33 Hz) over a period of 5 min. A wide-field image of the pSUPER-Turquoise or tau shRNA-Turquoise was acquired to identify the neurons expressing the control or the knockdown construct. All images were collected and compiled in MetaMorph imaging software (Molecular Devices). For presentation, images were processed with the following filters unsharp mask (filter width 3 pixel, scaling factor 0.9), low-pass spatial filter (filter width 3 pixel) and Gaussian blur filter function (width 0.5 pixel) in the Fiji software.
EB3 comet tracking and data analysis.
Images of EB3-tdT acquired from the TIRF microscope were exported as multidimensional TIFF files. EB3 comets from these raw unprocessed images were tracked automatically using the plusTipTracker software (Matov et al., 2010; Applegate et al., 2011; Stout et al., 2014). To measure displacement, lifetime and velocities of EB3 comets, the following parameters were set in the program: search radius range, 5–12 pixel; minimum subtrack length, 3 frames; maximum gap length, 8 frames; maximum shrinkage factor, 0.8; maximum angle forward, 50; maximum angle backward, 10; and fluctuation radius, 2.5 (Stout et al., 2014). To visualize comet tracks in individual growth cones, the plusTipSeeTracks function was used. For statistical analysis, the plusTipGroupAnalysis function was used to compare the dynamic parameters among groups. MT dynamics parameters were compiled from multiple individual experiments.
Actin retrograde flow measurements.
Unprocessed images were compiled in Fiji and KymographClear macro (Prevo et al., 2015) was used to measure actin flow rates and EB3 velocities in the same filopodium.
Dunn chamber guidance assay.
For axon guidance assays in Dunn chambers (Yam et al., 2009), dissociated P0 hamster neurons were nucleofected with control pSUPER-Turq vector or hamster tau shRNA or hamster tau shRNA and human tau3RS. Neurons were plated and cultured for 48 h in 6 well plastic dishes (see Dissociated cell culture and transfection). For imaging in the chambers, neurons were replated on 0.1 mg/ml poly-d-Lysine (Sigma-Aldrich) coated 22 mm square no. 1.5 German coverslips (Corning) at a low-density (10,000 cells/well). Assembly of the Dunn chamber (Hawksley) was similar to published protocols (Yam et al., 2009). Briefly, Dunn chambers were rinsed once and then filled with serum-free medium. A coverslip with neurons was inverted over the Dunn chamber leaving a narrow slit at the edge without the sealant paraffin wax (3:1). Media in the outer well was removed carefully and then medium with 400 ng/ml Wnt5a (R&D Systems) was added to the outer well. The narrow slit was sealed with paraffin wax. All dissociated neurons in the bridge region of the Dunn chamber expressing turquoise fluorescence were selected and wide-field images of those neurons acquired every 10 min for 2 h with a 10× 0.3 NA Plan Fluor objective mounted on a Nikon TE2000E inverted microscope equipped with a Coolsnap HQ-cooled interline charge-coupled device camera (Photometrics). Dunn chambers were kept at 37°C during imaging. The turning angles and axon outgrowth rates were measured in Fiji. The initial and final directions of axon outgrowth were defined by the direction of the 5 μm distal axon segment. The initial angle (α) is defined by the original direction of axon outgrowth and a line through the Wnt5a gradient. The final angle (β) was calculated as the angle between the final direction of axon outgrowth and a line through the Wnt5a gradient. Mean turning angles were calculated by subtracting the final angle from the initial angle. Axon outgrowth was measured by tracing axons from the original position of the growth cones to their final position. When axons turned toward the gradient, the turning angle was positive and when axons turned away from the gradient, the turning angle was negative.
Experimental design and statistical analysis.
All graphing and statistical tests were performed in GraphPad Prism 6. D'Agostino and Pearson omnibus test was used to assess whether the data were accurately modeled by a normal distribution. At least three independent experiments were performed for each condition. When comparing more than two groups with normal distribution one-way ANOVA with Dunnett's post hoc test was performed. To measure the extent of MT bundling in growth cones two-way ANOVA with Tukey's multiple-comparison tests was performed. Kruskal–Wallis with Dunn's multiple-comparison tests (nonparametric tests) were used on the data distributions that did not pass the D'Agostino and Pearson omnibus normality test with α = 0.05. When comparing only two conditions unpaired two-tailed Student's t test was performed. Linear regression models were fitted using least-square approach. For all of the statistical tests, the α value was set at 0.05. For all graphs p values are represented as follows: *p < 0.05, **p < 0.01, ***p < 0.001, ****p < 0.0001. Data in the text are represented as mean ± SEM.
Results
Tau associates with stable and dynamic microtubules and actin filaments
We first labeled fixed cortical neurons with markers for actin filaments (phalloidin), MTs (tubulin), and tau, using an antibody to total tau that recognizes all tau isoforms (Biernat et al., 2002; Frandemiche et al., 2014; Petry et al., 2014). As shown in Fig 1A at 1 DIV the neuron from P0 cortex is already polarized into shorter dendritic processes and a single long axon tipped by a growth cone. We defined the axon as the single process that was at least twice the average length of the multiple shorter processes. We localized tau in growth cones (schematized in Fig. 1A) of fixed P0 hamster cortical neurons that were extracted to remove unbound tau. As expected tau colocalized with MTs in the central region of the growth cone (Fig. 1B,C) where stable (acetylated) and dynamic (tyrosinated) MTs form prominent loops in pausing growth cones. Super resolution STED also revealed that individual dynamic MTs extend into the transition region of the growth cone between the central MT loops and the periphery where tau also colocalizes with actin. Higher-magnification images of this transition region (Fig. 1C, and insets) showed that tau labeling coincides strikingly with F-actin staining in the transition region and that individual dynamic MTs are speckled with tau labeling (Fig. 1C, and insets). Within filopodia extending from the peripheral growth cone tau also colocalized with bundled actin filaments. Remarkably, in several cases we found that tau was localized to the interface between a single dynamic MT and an actin filament bundle colabeled with phalloidin and tau (Fig. 1C, and insets, bottom row). This suggests that tau may link dynamic MTs to actin filaments.
Figure 1.
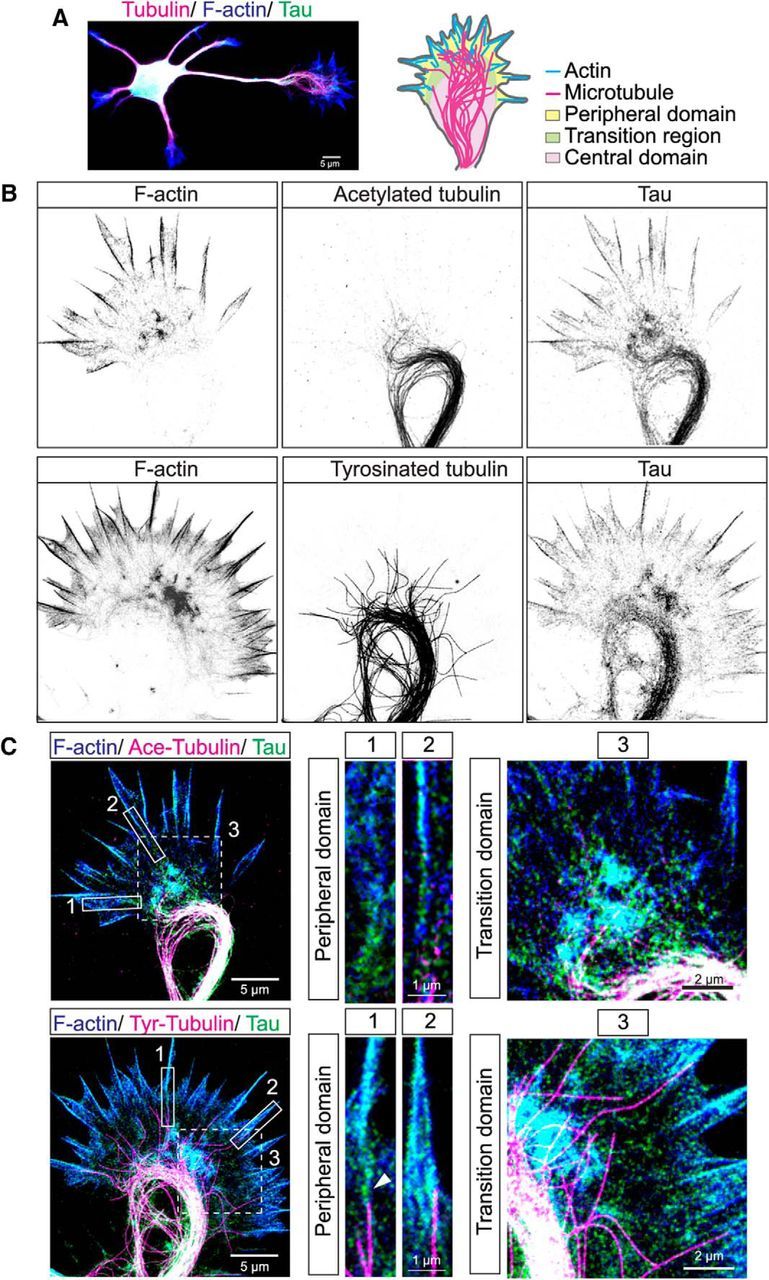
Tau colocalizes with actin filaments as well as with stable and dynamic MTs in central, transition and peripheral regions of hamster cortical growth cones. STED microscopic image of a cortical neuron stained for tau (green), tubulin (magenta), and F-actin (blue) showing multiple dendrites and a single long axon tipped by a growth cone (A). Schematic of the growth cone indicates different domains and positions of the actin and MT cytoskeleton. Two examples of fixed cortical growth cones shown in inverted gray scale (B) and three-color overlay images (C). F-actin (blue) is heavily concentrated in filopodia as well as the transition region between the growth cone center and the periphery. Acetylated stable MTs (magenta) form a prominent bundled loop in the growth cone center. Tyrosinated dynamic MTs also form bundled loops from which individual MTs extend into the transition region and enter filopodia. Tau colocalizes with both F-actin (cyan) and stable and dynamic MTs (white) in all three regions of the growth cone. Three-color insets from boxed regions are higher-magnification images of individual filopodia and of the transition regions. In filopodia tau colocalizes with F-actin and is also positioned at the interface (arrowhead) between a single dynamic MT and an actin filament bundle. Note that acetylated MTs do not extend into filopodia. Insets of the transition region show colocalization of tau and F-actin (cyan) and extension of individual dynamic MTs into this region.
The association of tau with dynamic MTs and actin filaments was also shown in live-cell imaging with TIRF (Movies 1 and 2). To verify the association of tau with dynamic MTs in live growth cones we transfected P0 cortical neurons (Fig. 2A) with GFP-tau constructs as well as EB3-tdTomato (Fig. 2B) to label dynamic polymerizing MT plus ends (Hoogenraad and Bradke, 2009; Galjart, 2010; Akhmanova and Steinmetz, 2015; Kapitein and Hoogenraad, 2015). To localize tau in relation to actin filaments, we nucleofected cortical neurons with GFP-tau and tractin-tdTomato. As shown in Movie 1 and the image sequences (Fig. 2A, top) tau heavily labeled looped MTs in the growth cone central domain and formed aligned speckles that moved through the transition region. The image sequences of a single filopodium from Movie 1 (Fig. 2A, bottom) show tau associated with dynamic actin filaments extending and retracting within the filopodium. As shown in Movie 2 and image sequences (Fig. 2B) tau is associated with MTs whose dynamic plus ends are labeled with EB3. These results together with the STED images of fixed growth cones show that tau associates with stable and dynamic MTs as well as with actin filaments.
Figure 2.
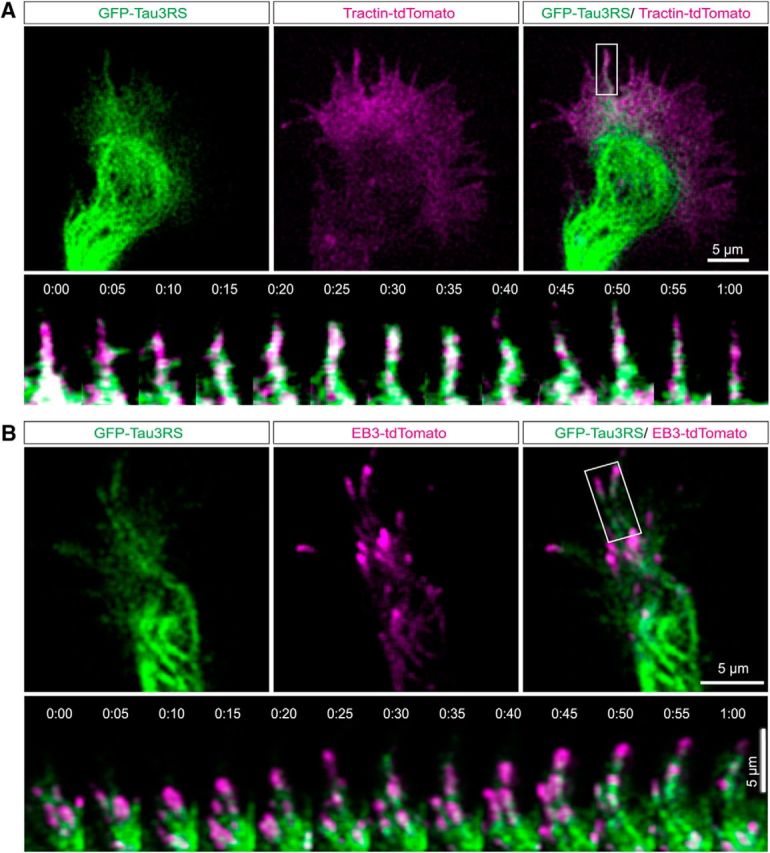
Tau associates with dynamic MTs and actin filaments. Live cell imaging with TIRF shows association of tau with actin filaments and dynamic MT tips. In a growth cone (Movie 1) expressing GFP tau (green) and Tractin-td tomato (magenta) actin and tau colocalize in filopodia (A). Image sequence of the filopodium in boxed area shows consistent association of tau with dynamic actin filaments extending and retracting in the filopodium. A growth cone expressing GFP tau (green) and EB3 tdTomato (magenta; Movie 2; B) showing tau associating with EB3 comets. Image sequence of boxed region shows colocalization of tau and EB3. Scale bar, 5 μm.
Tau associates with actin filaments in a cortical growth cone. Cortical neurons were transfected with GFP-human tau (green) and Tractin-tdTomato (magenta). Areas of colocalization in the growth cone periphery are shown in white (arrows). Dual-channel TIRF acquisition rate is one frame per 5 s (0.2 Hz) over 10 min. Image processing was performed with MetaMorph software. Video rate is increased 35×. Movie corresponds to data in Figure 2A. Scale bar, 5 μm.
Tau associates with dynamic MTs in a cortical growth cone. Cortical neurons were cotransfected with GFP-human tau (green) and EB3-tdT (magenta). Tau labels dynamic MTs tipped with EB3. Dual-channel TIRF acquisition rate is one frame per 5 s (0.2 Hz) over 10 min. Image processing was performed with MetaMorph software. Video rate is increased 35×. Movie corresponds to data in Figure 2B. Scale bar, 5 μm.
Tau knockdown disrupts MT organization, which is rescued by 3R tau
To gain further insight into the MT-associated functions of tau, we investigated effects of tau knockdown on the organization of MTs in growth cones. We made two different shRNA tau constructs against the N-terminus of hamster tau (Fig. 3) to knock down all endogenous hamster tau isoforms. We nucleofected tau knockdown constructs into P0 hamster cortical neurons (nucleofection efficiency 60–80%) and after 3 DIV we replated the neurons to allow sufficient time for the expression of shRNA constructs and at the same time follow axonal development (shRNA expression efficiency 30–40%). We then allowed 1 d for axons to form (Fig. 4A). In control neurons MTs are bundled in prominent loops in growth cones. This looped MT organization has generally been associated with growth cones pausing in their forward advance (Fig. 4B; Tanaka and Kirschner, 1991; Szebenyi et al., 1998; Dent et al., 1999; Dent and Kalil, 2001). In extending growth cones MTs are typically organized in relatively straight bundles in growing axons and their growth cones (Fig. 4C). However, these associations are not absolute and we show these as examples of different MT organization. Tau knockdown changed MTs in both configurations from a bundled to a splayed array. Although tau knockdown was only partial (Fig. 4) MTs became unbundled and had individual disorganized trajectories clearly visible with STED microscopy. Importantly these MTs no longer oriented in the direction of axon outgrowth. However, tau knockdown had no overall effects on growth cone morphology or actin filament organization.
Figure 3.

Endogenous hamster tau expression is knocked down with shRNA. Cultured cortical neurons (A) showing nucleofection with pSUPER-mTurquoise (control; left), hamster tau shRNA construct-1 (center), and hamster tau shRNA construct-2 (right). Arrows indicate neurons nucleofected with the control or tau knockdown constructs and stained with tubulin antibodies. Fluorescence intensity measurements of tau (B) showing reduced tau levels in the knockdown neurons. Western blots of hamster cortical neuronal lysates (C) comparing reduction of tau after knockdown with tau shRNA-1 and shRNA-2 constructs, quantified in (E). Western blots of cortical neuronal lysates showing reduced hamster tau after tau shRNA-2 knockdown and overexpression of human 3RS tau (D) and quantified in (E). Western blots of lysates of HEK cells nucleofected with human 3RS tau (F) showing that tau shRNA-1 and shRNA-2 do not affect levels of human tau. Western blots (G) showing specificity of the antibodies to 3RS tau (left), which recognizes endogenous hamster tau in control cell lysates. This antibody also recognizes specifically human GFP-3RS but not 4RL tau nucleofected into cortical neurons with shRNA-2 to reduce endogenous tau. In the Western blot (right) antibodies to 4RL tau recognize human GRP-4RL specifically but not GFP-3RS tau or endogenous hamster 4RL tau, which is not present in P0 cortical neurons. ***p < 0.001. Scale bar, 50 μm.
Figure 4.

Tau knockdown disrupts microtubule bundling, which is restored with human tau expression. P0 hamster cortical neurons were dissociated and nucleofected with a tau sh2 knockdown construct tagged with mTurquoise and replated after 3 DIV (A). In STED images of control growth cones (B, top row) tyrosinated MTs (magenta) are tightly bundled and form a characteristic loop in the central region of pausing growth cones. Antibodies to total tau (green) follow the organization of the bundled MTs. In the merged image tau colocalizes with the bundled MTs (white) and individual dynamic MTs extend into the growth cone periphery labeled with phalloidin to stain actin filaments (blue). In extending growth cones (C, top row) tyrosinated MTs (magenta) are also bundled but extend in straight trajectories and do not form loops. Tau (green) colocalizes (white) with bundled MTs. Following tau knockdown (B, C, middle row) tyrosinated MTs (magenta) in the growth cone center become unbundled and disorganized. Following rescue with tau expression (B, C, bottom row) MTs (magenta) are restored to bundles. Exogenous tau is shown in green. Fluorescence intensities across line scans of the growth cone center in control versus tau knockdown neurons measure the degree of MT bundling (D, E). Paused control growth cones (n = 20 growth cones) show two peaks of fluorescence (blue line) reflecting MT bundles in the left and right sides of the MT loop. In contrast following tau knockdown fluorescence is evenly distributed (magenta line) reflecting the lack of MT bundling (D). Fluorescence measurements of extending growth cones (n = 20) also show bundled MTs in controls versus splayed MTs following tau knockdown (E). In both graphs restoration of MT bundling with tau expression are indicated by the green line. ns - not significant, **p < 0.01, ***p < 0.001. Scale bar, 5 μm.
To determine whether tau is required for the bundled organization of MTs we transfected human tau into neurons in which endogenous tau was knocked down (Fig. 4B,C). Tau has been classified according to the number of N-terminal inserts (0N, 1N, 2N) and the number of MT binding repeat sequences (3R and 4R). Combinations of these domains result in the expression of six tau isoforms in the adult human brain (Arendt et al., 2016). Expression of different tau isoforms is developmentally regulated in both human and rodent brains in early development (Goedert et al., 1989; Kosik et al., 1989; Goedert and Jakes, 1990; Kampers et al., 1999; Takuma et al., 2003). Only the isoform containing 3 repeats (3RS) is expressed in P0 hamster cortex. For rescue experiments we constructed GFP-tagged human tau 3RS that was designed to be resistant to the hamster shRNA (Fig. 3). Levels of total human and hamster tau were maintained at levels of endogenous hamster tau in control neurons to avoid overexpression (Fig. 3). Rescue experiments showed that tau 3RS restored bundled MT organization in the center of extending and pausing growth cones (Fig. 4B,C). The degree of MT bundling in control, knockdown and rescue experiments was quantified by measuring fluorescence intensities of MTs across line scans of the growth cone center (Fig. 4D, two-way ANOVA: F(2,46) = 8.403, p = 0.0008 for paused GC; and E, two-way ANOVA: F(2,39) = 5.013, p = 0.0057 for extending GC). These results demonstrate the role of the developmentally expressed 3RS tau in mediating bundled MT organization.
Tau knockdown misorients dynamic MT trajectories, which are rescued by human tau
Given the morphological disorganization of MTs following tau knockdown, we investigated whether tau reduction altered the trajectories of dynamic MTs as they explored the growth cone periphery. To follow dynamic MTs in live-cell imaging we nucleofected P0 cortical neurons with EB3-tdTomato to label dynamic polymerizing MT plus ends along with a control vector or with hamster tau shRNA-mTurquoise to knock down endogenous tau (Fig. 5A). In growth cones of control neurons (Fig. 5B; Movie 3) EB3 comets moved in relatively straight trajectories toward the leading edge. When overlaid in the maximum projection, the comet tracks suggested a bundled MT organization as shown in the measurements of relative angular displacement from the vertical in the rose plots. In contrast, after tau knockdown comet tracks did not follow one another and their trajectories failed to orient toward the leading edge (Movie 3). Even in the neck of the growth cone at the distal axon EB3 comets were misoriented and did not form straight parallel arrays. Maximum intensity projection overlays of the movie sequences and the rose plots illustrate these disorganized trajectories and the disruption of MT bundling. In rescue experiments we transfected human GFP-3RS tau into neurons with knockdown of endogenous hamster tau along with EB3-tdTomato. We found that EB3 comets were restored to straight trajectories (Movie 3) similar to those in control growth cones. Analysis of EB3 comet tracks in maximum projection overlay from the movie sequences and in rose plots show that MT bundling was rescued. Measurements of EB3 comet growth velocities (Fig. 5C; 10.92 ± 0.65 μm/min, n = 23 growth cones) calculated from individual comet displacements (3.16 ± 0.15 μm, n = 23) and lifetimes (18.43 ± 0.52 s, n = 23) showed faster comet velocities (14.47 ± 0.39 μm/min, n = 19), increased comet displacements (3.94 ± 010 μm, n = 19), and decreased comet lifetimes (16.77 ± 0.45 s, n = 19) after tau knockdown suggesting increased MT dynamics and reduced stability. Expression of human tau GFP-3RS rescued comet velocities (10.46 ± 0.5 μm/min, n = 13), displacement (3.14 ± 0.11 μm, n = 13), and lifetime (19.16 ± 0.6 s, n = 13) levels similar to controls (Fig. 5C; one-way ANOVA: F(2,52) = 14.60, p < 0.0001 for comet velocities; F(2,52) = 12.41, p < 0.0001 for comet displacement; and F(2,52) = 5.032, p = 0.010 for comet lifetimes). Further measurements of MT dynamicity were made with the plus tip tracker program (Matov et al., 2010; Applegate et al., 2011; Stout et al., 2014), which calculates the collective displacement of EB3 comets in each stage of dynamic instability i.e., growth, shrinkage, and pausing over their collective lifetimes (Fig. 5-1). In the crowded environment of the growth cone where EB3 comets follow each other in quick succession it was difficult to distinguish the disappearance of EB3 comets due to a shrinkage event (catastrophe) from the nucleation of a new EB3 comet immediately following it in the same trajectory. Thus the rate of catastrophe was not included in measurements of dynamicity. Results, as shown in the scatterplots, demonstrate that according to these measurements tau knockdown (KD) significantly increased MT dynamics (Fig. 5C; 8.57 ± 0.53 μm/min for control, 11.56 ± 0.29 μm/min for tau KD, 8.1 ± 0.36 μm/min for tau KD+ tau GFP-3RS; one-way ANOVA: F(2,50) = 17.69 p < 0.0001). Several recent studies have shown that tau regulates EBs at MT ends by EB tracking (Sayas et al., 2015; Ramírez-Ríos et al., 2016), raising the possibility that effects of tau knockdown on increasing MT dynamics may be indirect through changes in EB/MT interaction. However, in our knockdown experiments we found no changes in the number of EB3 comets on MT ends (0.33 ± 0.03 number of comets/min/μm2 growth cone area for control and 0.28 ± 0.03 number of comets/min/μm2 growth cone area for tau KD; t = 1.22, df = 39, p = 0.229). Together, these results demonstrate the importance of tau for bundling of MTs and the orientation of dynamic MTs in growth cones.
Figure 5.

Tau knockdown misorients dynamic MT trajectories, which are rescued by human tau expression. Neurons nucleofected with control shRNA or tau shRNA and cotransfected with EB3td tomato to label the dynamic plus ends of MTs at P0 (A) were replated and imaged live with TIRF microscopy (B). Image sequences at 3 s intervals from a control growth cone (B, top row; Movie 3) show relatively straight EB3 comet tracks in parallel arrays. This was confirmed in the maximum projection image (right) where EB3 comets were pseudocolored yellow and in measurements of EB3 comet track angular displacements (rose plot, far right). Following tau knockdown (B, middle row) EB3 comets were disorganized (Movie 3) as shown in the maximum projection image (right) and in rose plots (far right). Image sequence of a growth cone (Movie 3) after tau knockdown and transfection with human tau (B, bottom row) shows that human tau rescues straight EB3 comet trajectories similar to those in control growth cones as shown in the maximum projection image (right) and rose plot (far right). Scatter plots (C) of EB3 comets obtained from movies (10 min duration with 3 s acquisition intervals) of control, tau knockdown and tau rescue growth cones (n = 20 for each condition) show that tau knockdown increases EB3 comet velocity, displacement, and dynamicity (see Materials and Methods) but not comet lifetime. All EB3 comet parameters were rescued with human tau. ns - not significant, *p < 0.05, ***p < 0.001, ****p < 0.0001. Scale bar, 5 μm. Comparisons of dynamic parameters of EB3 comets under different conditions shown in Figure 5-1.
Comparisons of dynamic parameters of EB3 comets under different conditions. Plus tip tracker program (Matov et al., 2010; Applegate et al., 2011; Stout et al., 2014) was used to calculate the growth frequency (one-way ANOVA F(2, 50) = 4.10, p = 0.022), pause frequency (F(2, 50) = 8.378, p = 0.0007), percent time spent in growth (F(2, 50) = 10.21, p = 0.0002), percent time spent in pause (F(2, 50) = 12.34, p < 0.0001) and dynamicity (F(2, 50) = 17.69 p <0.0001). Download Figure 5-1, DOCX file (54KB, docx)
Tau knockdown misorients dynamic MT trajectories, which are rescued by human tau. Left video, Dynamic MTs in a control growth cone move in straight parallel trajectories oriented toward the leading edge. Nucleofection was with control pSUPER-turq vector and EB3-tdT. Middle video, Dynamic MTs in a growth cone after knockdown of endogenous tau move in disorganized trajectories misoriented away from the leading edge. Nucleofection was with hamster tau shRNA-turq and EB3-tdT. Right video, Dynamic MTs in a growth cone after knockdown of endogenous tau are rescued with human tau, which restores movement of dynamic MTs in straight parallel trajectories oriented toward the leading edge similar to controls. Nucleofection was with hamster tau shRNA-turq, human GFP tau, and EB3-tdT. In all three videos EB3 comets appear white. Single-channel TIRF acquisition rate in all three videos is 1 frame/3 s (0.33 Hz) over 5 min. Image processing was performed with MetaMorph software. Video rate was increased 35×. Movies correspond to data shown in Figure 4B. Scale bar, 5 μm.
Tau knockdown prevents MT protrusion into the growth cone periphery and MT entry into filopodia, defects which are rescued by human tau
The localization of tau at the interface between dynamic MTs and actin filaments in filopodia of fixed growth cones as shown in Figure 1 suggested that tau was positioned where it could mediate the interaction between these two cytoskeletons. To observe the morphological relationship between MTs and actin filaments we used STED microscopy of fixed growth cones stained with phalloidin to label actin filaments and antibodies to tyrosinated tubulin to label dynamic MTs. As shown in Figure 6A (left), MTs in control growth cones form bundled loops in the growth cone central domain from which individual dynamic MTs protrude into the actin rich transition region and co-align (arrows) with actin filament bundles in filopodia (Fig. 6F: 27.41 ± 2.5% filopodia invaded by MTs; G: 1.35 ± 0.1 μm length of MTs aligned with filopodia, n = 40 growth cones). Following tau knockdown (Fig. 6A, center) MTs in the growth cone center became disorganized and individual MTs protruded only short distances into the transition region and were thus unable to enter filopodia (Fig. 6G; 0.85 ± 0.1 μm length of MTs within filopodia, n = 36) and co-align with actin filament bundles (Fig. 6F; 18.36 ± 1.58% filopodia invaded by MTs, n = 36). The percentage of MTs invading filopodia was also reduced (Fig. 6E; 20.66 ± 2.082% for control, n = 42 growth cones and 13.47 ± 1.12% for tau KD, n = 37). Thus when tau is knocked down MTs fail to protrude into the growth cone periphery and orient in the direction of axon outgrowth. Importantly, tau knockdown did not change the localization of actin in the lamellipodium. In rescue experiments (Fig. 6A, right) we found that 3RS tau restored bundled MT organization in the growth cone central domain, protrusion of dynamic MTs into the growth cone periphery and alignment of MTs with actin filaments in filopodia. This resulted in an increase in percentage of MTs invading filopodia (Fig. 6E; 21.18 ± 2.1, n = 39 growth cones in rescue condition; one-way ANOVA: F(2,115) = 5.17, p = 0.0071), increase in percentage of filopodia invaded by MTs (Fig. 6F; 27.15 ± 2.9% MTs in filopodia n = 30 growth cones in rescue condition: F(2,112) = 4.221, p = 0.017), and increase in length of MTs in filopodia (Fig. 6G; 1.34 ± 0.1 μm MT length, n = 30 growth cones in rescue condition: F(2,363) = 15.57, p < 0.0001). There were no changes in growth cone area (Fig. 6B; 265.8 ± 30.10, n = 41 for control; 315.6 ± 29.61, n = 30 for tau KD; 229 ± 25.93, n = 38 for rescue; one-way ANOVA: F(2,106) = 2.08, p = 0.1294), filopodia density (Fig. 6C; 3.78 ± 0.18, n = 40 for control; 3.26 ± 0.19, n = 32 for tau KD; and 3.8 ± 0.17, n = 39 for rescue; F(2,108) = 2.64, p = 0.0761) and the number of MT tips per growth cone (Fig. 6D; 19.95 ± 1.26, n = 42 for control; 20.65 ± 1.14, n = 37 for tau KD; and 17.79 ± 1.05, n = 39 for rescue; F(2,115) = 1.611, p = 0.2042). These results demonstrate that in growth cones tau is essential for mediating MT entry into filopodia and colocalization with actin filaments. However tau does not mediate the organization of actin filaments.
Figure 6.

Tau knockdown prevents MT protrusion into the growth cone periphery. To obtain images of dynamic MTs in relation to actin we labeled fixed growth cones with an antibody to tyrosinated tubulin and with phalloidin, respectively, and imaged growth cones with STED microscopy (A). In a representative control growth cone MTs form a prominent loop in the central region from which individual MTs extend into the transition region. MTs reorient to enter filopodia in apposition to actin filament bundles, as shown by overlap of tubulin (green) and actin (magenta) labeling in filopodia (arrows). Following tau knockdown the MT loop becomes disorganized and individual MTs (green) only penetrate partially into the growth cone transition region containing actin labeling (magenta). These MTs fail to enter filopodia or align with actin filament bundles. Rescue experiments with human tau expression show restoration of MT bundling, MT penetration into the growth cone peripheral domain, and close MT apposition (arrow) to actin filaments in filopodia. Growth cone area (B), density of filopodia in the peripheral domain (C), and MT tips in the transition region (D) are similar between tau knockdown and control growth cones. In tau knockdown growth cones a smaller percentage of MTs in the transition region invaded the peripheral domain (E). Quantification (F, G) of filopodia invaded by MTs showed that after tau knockdown fewer filopodia contained MTs and these MTs were significantly shorter than those entering filopodia in control growth cones. Rescue with human tau restored numbers and lengths of MTs entering filopodia to control levels. ns - not significant, *p < 0.05, **p < 0.01, ***p < 0.001, ****p < 0.0001. Scale bar, 5 μm.
We have found that tau knockdown has profound effects on the organization and dynamics of MTs. In images of fixed cells (Fig. 6) following tau knockdown, dynamic MTs were confined to the growth cone center and were not found in the actin rich periphery. It was therefore important to investigate these effects of tau depletion with live-cell imaging. We nucleofected P0 neurons with mRuby-Lifeact to label F-actin and EB3-GFP to label dynamic MT plus ends. In control neurons EB3 comets traversed the central and peripheral growth cone in straight bundled trajectories as shown in the maximum intensity projection images from image sequences of two different growth cones (Fig. 7A, top left). As shown in Movie 4 EB3 comet tracks clearly extend into the actin rich growth cone periphery. In image sequences of individual filopodia from Movie 4 (Fig. 7A, right) EB3 comets tracked along actin filament bundles from the base to the tip of the filopodium. In contrast, after tau knockdown EB3 comets were confined largely to the central and transition regions of the growth cone, as shown in the maximum intensity projection images of two different growth cones (Fig. 7B, left). As shown in Movie 4, very few EB3 comets extended into filopodia (Fig. 7B, right).
Figure 7.

Tau knockdown disrupts MT organization and dynamic exploration of the growth cone periphery without affecting retrograde flow rate. In growth cones nucleofected with the control vector, the actin marker mRuby-Lifecact (magenta) and EB3-GFP (green; n = 12 growth cones) live-cell imaging over 5 min at 3 s intervals with TIRF (Movie 4) showed that EB3 comets track one another in straight trajectories through all regions of the growth cone and are oriented in the direction of axon outgrowth. The maximum projection images of the movie frames for two controls emphasize the bundled MT arrays in the growth cone center and show EB3 comets extending into the growth cone periphery and invading individual filopodia (A). Image sequences of a single filopodium (boxed region) show an EB3 comet reaching the filopodial tip (arrows). Following tau knockdown (B; n = 12 growth cones), EB3 comets remained in the center of the two growth cones where MTs fail to form bundles. Only a few EB3 comets reached the periphery and in the single filopodium (boxed region) EB3 comets remained in the transition region at the base of the filopodium (arrows). In the tau knockdown growth cones the movements of comets were random; their tracks were disorganized and did not follow one another in the direction of outgrowth (Movie 4). Tau knockdown does not disrupt actin retrograde flow (C, D). Maximum projection images of the same growth cones shown above and in Movie 4 nucleofected with mRuby-Lifeact to label actin filaments were used to create kymographs of retrograde actin flow rates. In filopodia line scans were made from the base to the tip of filopodia (indicated by blue lines in controls and magenta lines after tau knockdown) in which dynamic MTs associate with actin filament bundles. Insets show kymographs of retrograde flow in individual filopodia (n = 45 filopodia from 15 control and 15 tau knockdown growth cones). Scatter plots show that rates of actin retrograde flow (E) are unchanged by tau knockdown. Plots of EB3 comet velocity in relation to retrograde actin flow rates (F) in 45 filopodia show that increased retrograde flow is accompanied by an increase in EB3 comet velocity. In contrast in filopodia after tau knockdown EB3 comet velocity is unrelated to retrograde actin flow rate. Scale bars: growth cones, 5 μm; image series in A and B, 2 μm.
Tau knockdown disrupts dynamic exploration of MTs in the growth cone periphery. Left video, Dynamic MTs in a control growth cone extend into the actin rich periphery where EB3 comets track along actin filament bundles to the tips of filopodia. Nucleofection was with the pSUPER-Turq vector, mRuby-Lifeact (magenta) and EB3-GFP (green). Right video, Dynamic MTs in a growth cone after tau knockdown remain in the growth cone center and fail to invade the F-actin rich periphery or filopodia. Nucleofection was with tau shRNA-Turq, mRuby-Lifeact (magenta) and EB3-GFP (green). Dual-channel TIRF acquisition rate is 1 frame/3 s (0.33 Hz) over 5 min. Image processing was performed with MetaMorph software. Video rate is increased 35×. Movies correspond to data in Figure 6. Scale bar, 5 μm.
However, one possibility is that tau knockdown could be altering actin retrograde flow. Retrograde flow is one major aspect of actin dynamics in growth cones and it is well established that MT exploration of the growth cone periphery is inversely related to the rate of actin retrograde flow, which pulls MTs centripetally toward the growth cone center (Schaefer et al., 2002, 2008). Therefore in these same growth cones we used kymographs to measure rates of retrograde actin flow in the transition region and in individual filopodia that contained EB3 comets (Fig. 7C,D). We found that the retrograde actin flow rate did not change after tau knockdown (Fig. 7E; average 2.7 ± 0.1 μm/min, n = 36 for controls and 2.65 ± 0.07 μm/min, n = 45 for tau knockdown; t = 0.42, df = 78, p = 0.69). In control filopodia exhibiting retrograde flow EB3 comets were able to invade the growth cone periphery and extend along filopodia to their tips. Further, a direct correlation between speed of EB3 comets and retrograde actin flow suggests faster rates of MT polymerization (Fig. 7F, top; Pearson's correlation r = 0.57, R2 = 0.33, p = 0.0003). In contrast, in tau knock down, EB3 comet speed i.e., rates of MT polymerization were unrelated to rates of actin retrograde flow (Fig. 7F, bottom; Pearson's correlation r = 0.036, R2 = 0.001, p = 0.81). Thus the inability of dynamic MTs to invade the growth cone periphery after tau knockdown is not due to alterations in retrograde actin flow.
Tau knockdown reduces neurite outgrowth
Given the disruption of MT organization and dynamics following tau knockdown, we asked whether these defects affected neurite outgrowth. As shown in Figure 8, A and B, tau knockdown in P0 neurons with the tau shRNA construct resulted in significantly shorter neurites as measured 1 d after replating (114.4 ± 3.75 μm for control neurons, n = 391 and 87.06 ± 2.8 μm for tau KD neurons, n = 325). Expression of the shortest 3R isoform (3RS) only partially rescued neurite length (95.42 ± 3.57 μm, n = 192). Because all three 3R tau isoforms are expressed early in development in human and rodent species (Takuma et al., 2003) we used all three human tau 3R isoforms in rescue experiments and found that the 3R isoforms restored neurites to control lengths (114.3 ± 5.68 μm, n = 145). These results (Fig. 8B; Kruskal–Wallis test F(3,1049) = 41.17, p < 0.0001) show that the 3R tau isoforms are involved in neurite outgrowth consistent with the expression of these isoforms during neural development.
Figure 8.
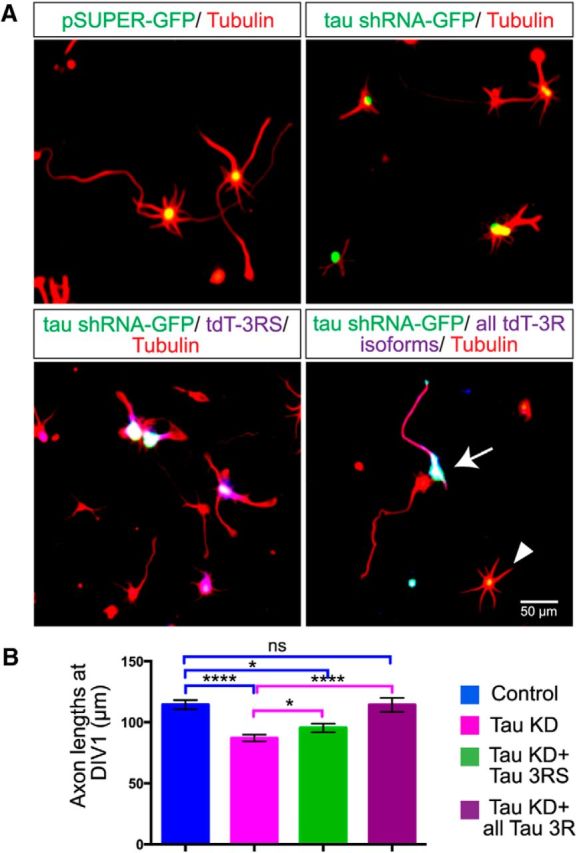
Tau knockdown reduces axon outgrowth, which is rescued with human tau Fluorescence images of fixed cultured cortical neurons (A) nucleofected with a control GFP-vector, hamster tau shRNA, hamster tau shRNA coexpressed with a single human tau isoform and hamster tau shRNA coexpressed with all 3R human tau isoforms. Neurons were nucleofected, replated, and allowed to extend axons for 24 h. Fixed cultures were labeled with antibodies to tubulin to show cortical axons. The arrow indicates a neuron that contains both the hamster shRNA tau knockdown construct and all 3R human tau isoforms. This neuron has an axon similar in length to a wild-type neuron in close proximity. The arrowhead indicates a neuron containing only the knockdown construct and has very little neurite outgrowth. As shown in the histograms (B), tau knockdown reduced axon length by ∼30%. Rescue with a single 3Rtau isoform only partially rescued axon outgrowth whereas all three human 3R tau isoforms restored axons to control lengths. *p < 0.05, ****p < 0.0001. Scale bar, 50 μm.
Tau knockdown reduces Wnt5a-evoked growth cone turning
Previously we found that cortical growth cones exhibited repulsive turning behaviors in gradients of the Wnt5a morphogen (Li et al., 2009, 2014) and that interfering with Wnt5a signaling caused misguidance of cortical axons across the corpus callosum (Hutchins et al., 2011). Because appropriate axon guidance depends on the ability of MTs to reorganize in the growth cone and interact with actin filaments, we asked whether tau knockdown interferes with axon guidance. Using Dunn chambers (Fig. 9A) as previously described (Li et al., 2014) we established gradients of Wnt5a and measured the ability of cortical axons to grow and turn toward or away from the Wnt5a gradient in the bridge region of the chamber. Neurons in the presence of Wnt5a extended axons more rapidly that those exposed to control BSA (Fig. 9B; 0.080 ± 0.007 μm/min, n = 125 neurons for BSA and 0.102 ± 0.004 μm/min, n = 238 neurons for Wnt5a, Mann–Whitney U = 11,732, p = 0.0009,). Tau knockdown reduced the rate of growth in Wnt5a to control levels (0.10 ± 0.004 μm/min, n = 238 for control and 0.081 ± 0.004 μm/min, n = 257 for tau KD, Mann–Whitney U = 24,921, p = 0.0004). However, in these 2 h acute experiments tau knockdown did not reduce baseline rates of axon outgrowth in the absence of Wnt5a as we had observed at 24 h (0.84 ± 0.007 μm/min, n = 96). Axon guidance in Wnt5a gradients was measured as the angular displacement from a line drawn parallel to the Wnt5a gradient and through the axon and the growth cone. Measurements showed that the mean turning angles were reduced following tau knockdown in Wnt5a gradients and rescued following expression of a single 3R isoform (3RS; Fig. 9C; mean attractive turning angle reduced from 28.03 to 18.26 and rescued to 29.22, Kruskal–Wallis test: F(2,323) = 13.19, p = 0.0014; mean repulsive turning angle reduced from −29.93 to −20.0 and rescued to −34.50, Kruskal–Wallis test: F(2,270) = 7.86, p = 0.0196). Following tau knockdown, the decrease in variance of turning angles in response to Wnt5a was confirmed for individual growth cones in scatter plots (Fig. 9D). Rescue experiments with a single 3R isoform (3RS) showed that variance in axon turning angles in Wnt5a gradients reverted to controls, which was also shown by overlay of linear regression lines (Fig. 9D; Pearson's correlation r = 0.36, R2 = 0.13, p < 0.0001 for control; r = 0.20, R2 = 0.039, p = 0.0014 for tau KD; and r = 0.33, R2 = 0.11, p < 0.0001). Together, these results show that tau plays a central role in axon outgrowth and guidance in response to Wnt5A.
Figure 9.

Tau knockdown reduces axon outgrowth and growth cone turning in Wnt5a gradients. Schematic of a Dunn chamber (A) showing a cortical neuron growing in the Wnt5a gradient in the bridge region of the chamber. High to low Wnt5a gradient is indicated by the shading. The initial and final direction of axon outgrowth was defined by the direction of the 5 μm distal axon segment. The initial angle (α) is defined by the original direction of axon outgrowth and a line through the Wnt5a gradient. The final angle (β) was calculated as the angle between the final direction of axon outgrowth and a line through the Wnt5a gradient. Histograms (B) show rates of axon outgrowth of neurons in Dunn chamber Wnt5a gradients over 2 h. Wnt5a increases the rate of axon outgrowth by 20% but following tau knockdown Wnt5a fails to accelerate axon outgrowth. Rescue with a single 3RS human tau construct fails to rescue the rate of axon outgrowth. Histograms of mean turning angles (C) of control versus tau knockdown axons (N = 100 axons for each condition) in BSA and Wnt5a gradients during live-cell imaging for 2 h at 10 min intervals. Growth cones in BSA show equal amounts of attractive and repulsive turning, which is not significantly changed by tau knockdown. In Wnt5a gradients growth cones show slightly more repulsion than attraction to the gradient and tau knockdown significantly reduces turning angles in either direction. Rescue with a single 3RS human tau isoform is sufficient to restore turning angles to control levels. Scatter plots (D) of mean turning angles of individual growth cones measured in the histograms. The x-axis represents the initial angle of the growth cone (α) in relation to the Wnt5a gradient. Mean turning angles (the initial angle minus the final angle) are indicated by dots for each growth cone. Colored lines represent the best-fit linear regression of mean turning angles. *p < 0.05, ***p < 0.001.
Discussion
In the present study we addressed the role of tau in the organization and dynamics of the growth cone cytoskeleton, in axon outgrowth and in guidance behaviors of the growth cone. Using super resolution STED microscopy on fixed growth cones we found that tau colocalized with both stable and dynamic MTs as well as with actin filaments. Live cell imaging with TIRF microscopy confirmed that over time tau remained closely associated with actin filaments and dynamic MTs. Tau knockdown showed that reducing tau expression caused MTs in the central region of the growth cone to become unbundled and disorganized. Consequently dynamic MTs that had straight trajectories in the growth cone periphery in control neurons became disorganized after tau knockdown and failed to enter the growth cone periphery and orient in the direction of axon outgrowth. In rescue experiments tau expression restored bundled MT organization and MT exploration of the growth cone periphery. Disorganized trajectories of dynamic MTs following tau knockdown could be due to defects in actin/MT colocalization. In support of this view we found that in filopodia at the leading edge of control growth cones tau was present at the interface between single dynamic MTs and actin filament bundles but that tau knockdown prevented dynamic MTs from entering filopodia and aligning with actin filaments. Consistent with a role for tau in mediating cytoskeletal dynamics, we found that tau was important for axon outgrowth and growth cone turning behaviors.
Tau associates with MTs and actin filaments and mediates MT organization
We found that tau is strongly associated with stable bundled microtubules in the distal axon and central region of the growth cone, consistent with the well established role of tau in stabilizing MTs. The function of tau in bundling MTs was previously shown ultrastructurally in cerebellar axons of tau knock-out mice (Harada et al., 1994) in which parallel MTs had reduced numbers of short filamentous cross bridges. Findings from a cell-free system of MTs demonstrated that tau mediates interactions among MTs by bundling them through crossbridges (Al-Bassam et al., 2002). This may be through an attractive (Chung et al., 2015) rather than a repulsive mechanism (Brandt and Lee, 1993; Gustke et al., 1994). We found that depleting tau disrupted bundled MT organization in the growth cone center and misoriented peripheral dynamic MTs thereby preventing their productive exploration of the growth cone lamellipodium. We also show that tau colocalizes with actin filaments in both the transition region of the growth cone and in filopodia. Previously tau was shown to interact with F-actin (Fulga et al., 2007) by bundling and stabilizing actin filaments in a cell-free system and, when tau was abnormally phosphorylated, in formation of actin rich rods in the brains of Drosophila and mice. Tau binding to actin filaments has also been observed in PC12 cells (Yu and Rasenick, 2006). Although tau associates with actin filaments in axonal growth cones, our results show that tau does not appear to mediate actin bundling or affect the number of filopodia.
Tau mediates dynamic MT exploration of the growth cone periphery
The interactions between the MT and actin cytoskeleton are essential for the growth and guidance of axonal growth cones (Dent and Kalil, 2001; Schaefer et al., 2002; Rodriguez et al., 2003; Geraldo and Gordon-Weeks, 2009; Dent et al., 2011; Coles and Bradke, 2015). For example, MTs extend along actin filaments that guide dynamic MTs exploring growth cone lamellipodia and filopodia (Lowery and Van Vactor, 2009; Dent et al., 2011) and retrograde actin flow restricts MT protrusion into the growth cone periphery (Schaefer et al., 2002, 2008). Recently in a cell-free system (Elie et al., 2015) tau was shown to bind directly to both purified F-actin and MTs. In high-resolution TIRF imaging Elie et al. (2015) showed that tau promoted co-organization and coupled growth of both networks through the guided polymerization of actin filaments along MT tracks and the growth of single MTs along actin filament bundles. We show here that in growth cones tau associates with stable and dynamic MTs as well as with actin filaments and that tau plays a role in entry of MTs into filopodia. In tau knockdown experiments we found that dynamic MTs remained in the central and transition regions of the growth cone and that misdirected dynamic EB3 comets did not align in straight trajectories and were unable to orient in the direction of axon outgrowth. These defects were not caused by effects of tau knockdown on retrograde actin flow. Thus for the first time in living cells we show that in axonal growth cones tau mediates MT organization and dynamics.
Although the present findings suggest that tau plays a role in cytoskeletal organization, a number of other actin-microtubule crosslinking proteins such as MAP2 and the EB-associated +TIP proteins has been identified (Coles and Bradke, 2015). For example, the MT end-binding cytoplasmic linker proteins (CLIPs) were found necessary for axon formation through their regulation of MT stability and MT interactions with the actin network (Neukirchen and Bradke, 2011). These authors proposed that neurite consolidation involves MT bundling in the growth cone center and that CLIPs, by stabilizing MTs, allow them to protrude to the growth cone tip and interact with actin filaments. When CLIPs are depleted from MTs the MTs are splayed apart and axons fail to extend. MAP2c, a classical structural MAP that binds MTs and actin filaments, has been shown (Dehmelt et al., 2003) to initiate neurite formation in neuroblastoma cells and in hippocampal neurons by mediating MT bundling during reorganization of lamellipodia into neurites. It was proposed that neurite formation involved MAP2c in stabilization of MTs and in alteration of actin organization. Because such MT-associated proteins appear to have effects similar to those of tau on MT organization and stability, it is not clear why they are unable to compensate for the loss of tau. Recently several studies have also shown that tau colocalizes with the plus TIP protein EB1 in the distal axon and in the growth cones of hippocampal neurons. Neurons from tau knock-out mice showed reduced EB1 comets in axons and growth cones, suggesting that tau regulates EB3 in developing neurons (Sayas et al., 2015). EB3 has been shown to modulate actin dynamics within dendritic spines (Jaworski et al., 2009) raising the possibility that tau, by regulating EB3, could thereby affect actin/microtubule interactions.
The role of tau in axon outgrowth and guidance
The role of tau in regulating axon outgrowth has been studied after tau deletion in vivo and in vitro with varying results that either refuted (Harada et al., 1994) or supported (Dawson et al., 2001) a requirement for tau in axon elongation. Failure to observe a phenotype in tau knock-out mice has been attributed to the overlap in functions between tau and MAP1B although it is unclear whether reduced axon outgrowth following tau ablation relates to the MT binding function of tau (Morris et al., 2011). We found that tau knockdown significantly reduced axon length and that rescue of axon elongation was most effective after transfection with all three versus a single early expressed 3R isoform, supporting the importance of tau expression for axon outgrowth. Reduced migration of cortical neurons in vivo in tau knock-out mice (Sapir et al., 2012) and an increase in microtubule dynamics in cultured cortical neurons from these mice are consistent with our results showing decreased axon elongation and increased MT dynamics in growth cones after tau knockdown.
We also find that tau plays a role in the guidance of cortical axons in gradients of the morphogen Wnt5a. Previously, we found that cortical growth cones respond to Wnt5a with increased rates of axon outgrowth and with repulsive turning behaviors (Li et al., 2009). Neurons transfected with a tau mutant, which is non-phosphorylatable at serine 262, made cortical growth cones insensitive to the growth promoting and guidance effects of Wnt5a (Li et al., 2014) because their MTs remained splayed apart and unable to reorganize into stable MT bundles. In the present study we also found that tau knockdown reduced growth and guidance of cortical growth cones in response to Wnt5a, consistent with MT debundling, loss of MT directionality, and defects in MT entry into filopodia that we observed after tau knockdown.
In summary (Fig. 10) we have shown for the first time in living growth cones that tau associates strongly with stable and dynamic MTs and colocalizes with actin filaments. Although tau is recognized as a stabilizer of MTs we show here with knockdown approaches that tau also organizes MTs into bundles and regulates the ability of dynamic MTs to explore the growth cone periphery. Importantly, the use of super resolution microscopy reveals for the first time that tau could be positioned at the interface between single dynamic MTs and actin filament bundles. Thus by participating in MT organization and dynamics in growth cones tau plays a role in axon growth and guidance. Although defects in tau have been studied extensively in neurodegenerative diseases involving loss of synaptic plasticity in adult neurons, our findings reveal an important role for tau in neural development.
Figure 10.

Schematic summary of results. In a control growth cone (left) tau associates with stable bundled MTs in the center and with dynamic MTs extending into the actin-rich periphery. Tau is also located at the interface between dynamic MTs and actin filaments in filopodia. MT organization and dynamic exploration of the periphery mediated by tau allows growth cones to extend and turn. In a growth cone following tau knockdown (right) MTs fail to form bundles in the center and penetrate only partially into the transition region in disorganized trajectories resulting in defects in axon outgrowth and turning behaviors.
Footnotes
This work was supported by the National Institutes of Health Grant NS 014428 to K.K. We thank Logan Goral for help with data analysis, Dr. Erik Dent and Dr. Timothy Gomez for use of the TIRF microscope, Lance Rodenkirch at the University of Wisconsin Optical imaging core for help with STED microscopy, Dr. Erik Dent and Dr. Robert Nichol for helpful comments on the paper, and members of the Dent and Gomez labs for useful discussions.
The authors declare no competing financial interests.
References
- Akhmanova A, Steinmetz MO (2015) Control of microtubule organization and dynamics: two ends in the limelight. Nat Rev Mol Cell Biol 16:711–726. 10.1038/nrm4084 [DOI] [PubMed] [Google Scholar]
- Al-Bassam J, Ozer RS, Safer D, Halpain S, Milligan RA (2002) MAP2 and tau bind longitudinally along the outer ridges of microtubule protofilaments. J Cell Biol 157:1187–1196. 10.1083/jcb.200201048 [DOI] [PMC free article] [PubMed] [Google Scholar]
- Applegate KT, Besson S, Matov A, Bagonis MH, Jaqaman K, Danuser G (2011) plusTipTracker: quantitative image analysis software for the measurement of microtubule dynamics. J Struct Biol 176:168–184. 10.1016/j.jsb.2011.07.009 [DOI] [PMC free article] [PubMed] [Google Scholar]
- Arendt T, Stieler JT, Holzer M (2016) Tau and tauopathies. Brain Res Bull 126:238–292. 10.1016/j.brainresbull.2016.08.018 [DOI] [PubMed] [Google Scholar]
- Ballatore C, Lee VM, Trojanowski JQ (2007) Tau-mediated neurodegeneration in Alzheimer's disease and related disorders. Nat Rev Neurosci 8:663–672. 10.1038/nrn2194 [DOI] [PubMed] [Google Scholar]
- Biernat J, Wu YZ, Timm T, Zheng-Fischhöfer Q, Mandelkow E, Meijer L, Mandelkow EM (2002) Protein kinase MARK/PAR-1 is required for neurite outgrowth and establishment of neuronal polarity. Mol Biol Cell 13:4013–4028. 10.1091/mbc.02-03-0046 [DOI] [PMC free article] [PubMed] [Google Scholar]
- Black MM, Slaughter T, Moshiach S, Obrocka M, Fischer I (1996) Tau is enriched on dynamic microtubules in the distal region of growing axons. J Neurosci 16:3601–3619. [DOI] [PMC free article] [PubMed] [Google Scholar]
- Brandt R, Lee G (1993) The balance between tau protein's microtubule growth and nucleation activities: implications for the formation of axonal microtubules. J Neurochem 61:997–1005. 10.1111/j.1471-4159.1993.tb03613.x [DOI] [PubMed] [Google Scholar]
- Chung PJ, Choi MC, Miller HP, Feinstein HE, Raviv U, Li Y, Wilson L, Feinstein SC, Safinya CR (2015) Direct force measurements reveal that protein Tau confers short-range attractions and isoform-dependent steric stabilization to microtubules. Proc Natl Acad Sci U S A 112:E6416–25. 10.1073/pnas.1513172112 [DOI] [PMC free article] [PubMed] [Google Scholar]
- Coles CH, Bradke F (2015) Coordinating neuronal actin-microtubule dynamics. Curr Biol 25:R677–R691. 10.1016/j.cub.2015.06.020 [DOI] [PubMed] [Google Scholar]
- Dawson HN, Ferreira A, Eyster MV, Ghoshal N, Binder LI, Vitek MP (2001) Inhibition of neuronal maturation in primary hippocampal neurons from τ deficient mice. J Cell Sci 114:1179–1187. [DOI] [PubMed] [Google Scholar]
- Dehmelt L, Smart FM, Ozer RS, Halpain S (2003) The role of microtubule-associated protein 2c in the reorganization of microtubules and lamellipodia during neurite initiation. J Neurosci 23:9479–9490. [DOI] [PMC free article] [PubMed] [Google Scholar]
- Dent EW, Kalil K (2001) Axon branching requires interactions between dynamic microtubules and actin filaments. J Neurosci 21:9757–9769. [DOI] [PMC free article] [PubMed] [Google Scholar]
- Dent EW, Callaway JL, Szebenyi G, Baas PW, Kalil K (1999) Reorganization and movement of microtubules in axonal growth cones and developing interstitial branches. J Neurosci 19:8894–8908. [DOI] [PMC free article] [PubMed] [Google Scholar]
- Dent EW, Tang F, Kalil K (2003) Axon guidance by growth cones and branches: common cytoskeletal and signaling mechanisms. Neuroscientist 9:343–353. 10.1177/1073858403252683 [DOI] [PubMed] [Google Scholar]
- Dent EW, Gupton SL, Gertler FB (2011) The growth cone cytoskeleton in axon outgrowth and guidance. Cold Spring Harb Perspect Biol 3:a001800. 10.1101/cshperspect.a001800 [DOI] [PMC free article] [PubMed] [Google Scholar]
- Elie A, Prezel E, Guérin C, Denarier E, Ramírez-Ríos S, Serre L, Andrieux A, Fourest-Lieuvin A, Blanchoin L, Arnal I (2015) Tau co-organizes dynamic microtubule and actin networks. Sci Rep 5:9964. 10.1038/srep09964 [DOI] [PMC free article] [PubMed] [Google Scholar]
- Farias GA, Muñoz JP, Garrido J, Maccioni RB (2002) Tubulin, actin, and tau protein interactions and the study of their macromolecular assemblies. J Cell Biochem 85:315–324. 10.1002/jcb.10133 [DOI] [PubMed] [Google Scholar]
- Ferrer I, Gomez-Isla T, Puig B, Freixes M, Ribé E, Dalfó E, Avila J (2005) Current advances on different kinases involved in tau phosphorylation, and implications in Alzheimer's disease and tauopathies. Curr Alzheimer Res 2:3–18. 10.2174/1567205052772713 [DOI] [PubMed] [Google Scholar]
- Frandemiche ML, De Seranno S, Rush T, Borel E, Elie A, Arnal I, Lanté F, Buisson A (2014) Activity-dependent tau protein translocation to excitatory synapse is disrupted by exposure to amyloid-beta oligomers. J Neurosci 34:6084–6097. 10.1523/JNEUROSCI.4261-13.2014 [DOI] [PMC free article] [PubMed] [Google Scholar]
- Fulga TA, Elson-Schwab I, Khurana V, Steinhilb ML, Spires TL, Hyman BT, Feany MB (2007) Abnormal bundling and accumulation of F-actin mediates tau-induced neuronal degeneration in vivo. Nat Cell Biol 9:139–148. 10.1038/ncb1528 [DOI] [PubMed] [Google Scholar]
- Galjart N. (2010) Plus-end-tracking proteins and their interactions at microtubule ends. Curr Biol 20:R528–R537. 10.1016/j.cub.2010.05.022 [DOI] [PubMed] [Google Scholar]
- Gallo G. (2007) Tau is actin up in Alzheimer's disease. Nat Cell Biol 9:133–134. 10.1038/ncb0207-133 [DOI] [PubMed] [Google Scholar]
- Geraldo S, Gordon-Weeks PR (2009) Cytoskeletal dynamics in growth-cone steering. J Cell Sci 122:3595–3604. 10.1242/jcs.042309 [DOI] [PMC free article] [PubMed] [Google Scholar]
- Goedert M, Jakes R (1990) Expression of separate isoforms of human tau protein: correlation with the tau pattern in brain and effects on tubulin polymerization. EMBO J 9:4225–4230. [DOI] [PMC free article] [PubMed] [Google Scholar]
- Goedert M, Spillantini MG, Jakes R, Rutherford D, Crowther RA (1989) Multiple isoforms of human microtubule-associated protein tau: sequences and localization in neurofibrillary tangles of Alzheimer's disease. Neuron 3:519–526. 10.1016/0896-6273(89)90210-9 [DOI] [PubMed] [Google Scholar]
- Guo T, Noble W, Hanger DP (2017) Roles of tau protein in health and disease. Acta Neuropathol 133:665–704. 10.1007/s00401-017-1707-9 [DOI] [PMC free article] [PubMed] [Google Scholar]
- Gustke N, Trinczek B, Biernat J, Mandelkow EM, Mandelkow E (1994) Domains of tau protein and interactions with microtubules. Biochemistry 33:9511–9522. 10.1021/bi00198a017 [DOI] [PubMed] [Google Scholar]
- Harada A, Oguchi K, Okabe S, Kuno J, Terada S, Ohshima T, Sato-Yoshitake R, Takei Y, Noda T, Hirokawa N (1994) Altered microtubule organization in small-calibre axons of mice lacking tau protein. Nature 369:488–491. 10.1038/369488a0 [DOI] [PubMed] [Google Scholar]
- He HJ, Wang XS, Pan R, Wang DL, Liu MN, He RQ (2009) The proline-rich domain of tau plays a role in interactions with actin. BMC Cell Biol 10:81. 10.1186/1471-2121-10-81 [DOI] [PMC free article] [PubMed] [Google Scholar]
- Henríquez JP, Cross D, Vial C, Maccioni RB (1995) Subpopulations of tau interact with microtubules and actin filaments in various cell types. Cell Biochem Funct 13:239–250. 10.1002/cbf.290130404 [DOI] [PubMed] [Google Scholar]
- Hoogenraad CC, Bradke F (2009) Control of neuronal polarity and plasticity: a renaissance for microtubules? Trends Cell Biol 19:669–676. 10.1016/j.tcb.2009.08.006 [DOI] [PubMed] [Google Scholar]
- Hutchins BI, Li L, Kalil K (2011) Wnt/calcium signaling mediates axon growth and guidance in the developing corpus callosum. Dev Neurobiol 71:269–283. 10.1002/dneu.20846 [DOI] [PMC free article] [PubMed] [Google Scholar]
- Janning D, Igaev M, Sündermann F, Brühmann J, Beutel O, Heinisch JJ, Bakota L, Piehler J, Junge W, Brandt R (2014) Single-molecule tracking of tau reveals fast kiss-and-hop interaction with microtubules in living neurons. Mol Biol Cell 25:3541–3551. 10.1091/mbc.E14-06-1099 [DOI] [PMC free article] [PubMed] [Google Scholar]
- Jaworski J, Kapitein LC, Gouveia SM, Dortland BR, Wulf PS, Grigoriev I, Camera P, Spangler SA, Di Stefano P, Demmers J, Krugers H, Defilippi P, Akhmanova A, Hoogenraad CC (2009) Dynamic microtubules regulate dendritic spine morphology and synaptic plasticity. Neuron 61:85–100. 10.1016/j.neuron.2008.11.013 [DOI] [PubMed] [Google Scholar]
- Kampers T, Pangalos M, Geerts H, Wiech H, Mandelkow E (1999) Assembly of paired helical filaments from mouse tau: implications for the neurofibrillary pathology in transgenic mouse models for Alzheimer's disease. FEBS Lett 451:39–44. 10.1016/S0014-5793(99)00522-0 [DOI] [PubMed] [Google Scholar]
- Kapitein LC, Hoogenraad CC (2015) Building the neuronal microtubule cytoskeleton. Neuron 87:492–506. 10.1016/j.neuron.2015.05.046 [DOI] [PubMed] [Google Scholar]
- Kempf M, Clement A, Faissner A, Lee G, Brandt R (1996) Tau binds to the distal axon early in development of polarity in a microtubule- and microfilament-dependent manner. J Neurosci 16:5583–5592. [DOI] [PMC free article] [PubMed] [Google Scholar]
- Kosik KS, Orecchio LD, Bakalis S, Neve RL (1989) Developmentally regulated expression of specific tau sequences. Neuron 2:1389–1397. 10.1016/0896-6273(89)90077-9 [DOI] [PubMed] [Google Scholar]
- Li L, Hutchins BI, Kalil K (2009) Wnt5a induces simultaneous cortical axon outgrowth and repulsive axon guidance through distinct signaling mechanisms. J Neurosci 29:5873–5883. 10.1523/JNEUROSCI.0183-09.2009 [DOI] [PMC free article] [PubMed] [Google Scholar]
- Li L, Fothergill T, Hutchins BI, Dent EW, Kalil K (2014) Wnt5a evokes cortical axon outgrowth and repulsive guidance by tau mediated reorganization of dynamic microtubules. Dev Neurobiol 74:797–817. 10.1002/dneu.22102 [DOI] [PMC free article] [PubMed] [Google Scholar]
- Lowery LA, Van Vactor D (2009) The trip of the tip: understanding the growth cone machinery. Nat Rev Mol Cell Biol 10:332–343. 10.1038/nrm2679 [DOI] [PMC free article] [PubMed] [Google Scholar]
- Mandell JW, Banker GA (1995) The microtubule cytoskeleton and the development of neuronal polarity. Neurobiol Aging 16:229–237; discussion 238. 10.1016/0197-4580(94)00164-V [DOI] [PubMed] [Google Scholar]
- Mandell JW, Banker GA (1996) A spatial gradient of tau protein phosphorylation in nascent axons. J Neurosci 16:5727–5740. [DOI] [PMC free article] [PubMed] [Google Scholar]
- Matov A, Applegate K, Kumar P, Thoma C, Krek W, Danuser G, Wittmann T (2010) Analysis of microtubule dynamic instability using a plus-end growth marker. Nat Methods 7:761–768. 10.1038/nmeth.1493 [DOI] [PMC free article] [PubMed] [Google Scholar]
- McVicker DP, Awe AM, Richters KE, Wilson RL, Cowdrey DA, Hu X, Chapman ER, Dent EW (2016) Transport of a kinesin-cargo pair along microtubules into dendritic spines undergoing synaptic plasticity. Nat Commun 7:12741. 10.1038/ncomms12741 [DOI] [PMC free article] [PubMed] [Google Scholar]
- Mitchison T, Kirschner M (1984) Dynamic instability of microtubule growth. Nature 312:237–242. 10.1038/312237a0 [DOI] [PubMed] [Google Scholar]
- Morris M, Maeda S, Vossel K, Mucke L (2011) The many faces of tau. Neuron 70:410–426. 10.1016/j.neuron.2011.04.009 [DOI] [PMC free article] [PubMed] [Google Scholar]
- Neukirchen D, Bradke F (2011) Cytoplasmic linker proteins regulate neuronal polarization through microtubule and growth cone dynamics. J Neurosci 31:1528–1538. 10.1523/JNEUROSCI.3983-10.2011 [DOI] [PMC free article] [PubMed] [Google Scholar]
- Noble W, Hanger DP, Miller CC, Lovestone S (2013) The importance of tau phosphorylation for neurodegenerative diseases. Front Neurol 4:83. 10.3389/fneur.2013.00083 [DOI] [PMC free article] [PubMed] [Google Scholar]
- Petry FR, Pelletier J, Bretteville A, Morin F, Calon F, Hébert SS, Whittington RA, Planel E (2014) Specificity of anti-tau antibodies when analyzing mice models of Alzheimer's disease: problems and solutions. PLoS One 9:e94251. 10.1371/journal.pone.0094251 [DOI] [PMC free article] [PubMed] [Google Scholar]
- Prevo B, Mangeol P, Oswald F, Scholey JM, Peterman EJ (2015) Functional differentiation of cooperating kinesin-2 motors orchestrates cargo import and transport in C. elegans cilia. Nat Cell Biol 17:1536–1545. 10.1038/ncb3263 [DOI] [PubMed] [Google Scholar]
- Ramírez-Ríos S, Denarier E, Prezel E, Vinit A, Stoppin-Mellet V, Devred F, Barbier P, Peyrot V, Sayas CL, Avila J, Peris L, Andrieux A, Serre L, Fourest-Lieuvin A, Arnal I (2016) Tau antagonizes EB tracking at microtubule ends through a phosphorylation-dependent mechanism. Mol Biol Cell 27:2924–2934. 10.1091/mbc.E16-01-0029 [DOI] [PMC free article] [PubMed] [Google Scholar]
- Rodriguez OC, Schaefer AW, Mandato CA, Forscher P, Bement WM, Waterman-Storer CM (2003) Conserved microtubule-actin interactions in cell movement and morphogenesis. Nat Cell Biol 5:599–609. 10.1038/ncb0703-599 [DOI] [PubMed] [Google Scholar]
- Saengsawang W, Taylor KL, Lumbard DC, Mitok K, Price A, Pietila L, Gomez TM, Dent EW (2013) CIP4 coordinates with phospholipids and actin-associated proteins to localize to the protruding edge and produce actin ribs and veils. J Cell Sci 126:2411–2423. 10.1242/jcs.117473 [DOI] [PMC free article] [PubMed] [Google Scholar]
- Sapir T, Frotscher M, Levy T, Mandelkow EM, Reiner O (2012) Tau's role in the developing brain: implications for intellectual disability. Hum Mol Genet 21:1681–1692. 10.1093/hmg/ddr603 [DOI] [PubMed] [Google Scholar]
- Sayas CL, Tortosa E, Bollati F, Ramírez-Ríos S, Arnal I, Avila J (2015) Tau regulates the localization and function of end-binding proteins 1 and 3 (EB1/3) in developing neuronal cells. J Neurochem J Neurochem 133:653–667. 10.1111/jnc.13091 [DOI] [PubMed] [Google Scholar]
- Schaefer AW, Kabir N, Forscher P (2002) Filopodia and actin arcs guide the assembly and transport of two populations of microtubules with unique dynamic parameters in neuronal growth cones. J Cell Biol 158:139–152. 10.1083/jcb.200203038 [DOI] [PMC free article] [PubMed] [Google Scholar]
- Schaefer AW, Schoonderwoert VT, Ji L, Mederios N, Danuser G, Forscher P (2008) Coordination of actin filament and microtubule dynamics during neurite outgrowth. Dev Cell 15:146–162. 10.1016/j.devcel.2008.05.003 [DOI] [PMC free article] [PubMed] [Google Scholar]
- Sharma VM, Litersky JM, Bhaskar K, Lee G (2007) Tau impacts on growth-factor-stimulated actin remodeling. J Cell Sci 120:748–757. 10.1242/jcs.03378 [DOI] [PubMed] [Google Scholar]
- Stout A, D'Amico S, Enzenbacher T, Ebbert P, Lowery LA (2014) Using plusTipTracker software to measure microtubule dynamics in Xenopus laevis growth cones. J Vis Exp 91:e52138. 10.3791/52138 [DOI] [PMC free article] [PubMed] [Google Scholar]
- Szebenyi G, Callaway JL, Dent EW, Kalil K (1998) Interstitial branches develop from active regions of the axon demarcated by the primary growth cone during pausing behaviors. J Neurosci 18:7930–7940. [DOI] [PMC free article] [PubMed] [Google Scholar]
- Takuma H, Arawaka S, Mori H (2003) Isoforms changes of tau protein during development in various species. Brain Res Dev Brain Res 142:121–127. 10.1016/S0165-3806(03)00056-7 [DOI] [PubMed] [Google Scholar]
- Tanaka EM, Kirschner MW (1991) Microtubule behavior in the growth cones of living neurons during axon elongation. J Cell Biol 115:345–363. 10.1083/jcb.115.2.345 [DOI] [PMC free article] [PubMed] [Google Scholar]
- Vitriol EA, Zheng JQ (2012) Growth cone travel in space and time: the cellular ensemble of cytoskeleton, adhesion, and membrane. Neuron 73:1068–1081. 10.1016/j.neuron.2012.03.005 [DOI] [PMC free article] [PubMed] [Google Scholar]
- Wang Y, Mandelkow E (2016) Tau in physiology and pathology. Nat Rev Neurosci 17:5–21. 10.1038/nrc.2016.112 [DOI] [PubMed] [Google Scholar]
- Yam PT, Langlois SD, Morin S, Charron F (2009) Sonic hedgehog guides axons through a noncanonical, Src-family-kinase-dependent signaling pathway. Neuron 62:349–362. 10.1016/j.neuron.2009.03.022 [DOI] [PubMed] [Google Scholar]
- Yu JZ, Rasenick MM (2006) Tau associates with actin in differentiating PC12 cells. FASEB J 20:1452–1461. 10.1096/fj.05-5206com [DOI] [PubMed] [Google Scholar]
- Zhou FQ, Waterman-Storer CM, Cohan CS (2002) Focal loss of actin bundles causes microtubule redistribution and growth cone turning. J Cell Biol 157:839–849. 10.1083/jcb.200112014 [DOI] [PMC free article] [PubMed] [Google Scholar]
- Zmuda JF, Rivas RJ (2000) Actin disruption alters the localization of tau in the growth cones of cerebellar granule neurons. J Cell Sci 113:2797–2809. [DOI] [PubMed] [Google Scholar]
Associated Data
This section collects any data citations, data availability statements, or supplementary materials included in this article.
Supplementary Materials
Tau associates with actin filaments in a cortical growth cone. Cortical neurons were transfected with GFP-human tau (green) and Tractin-tdTomato (magenta). Areas of colocalization in the growth cone periphery are shown in white (arrows). Dual-channel TIRF acquisition rate is one frame per 5 s (0.2 Hz) over 10 min. Image processing was performed with MetaMorph software. Video rate is increased 35×. Movie corresponds to data in Figure 2A. Scale bar, 5 μm.
Tau associates with dynamic MTs in a cortical growth cone. Cortical neurons were cotransfected with GFP-human tau (green) and EB3-tdT (magenta). Tau labels dynamic MTs tipped with EB3. Dual-channel TIRF acquisition rate is one frame per 5 s (0.2 Hz) over 10 min. Image processing was performed with MetaMorph software. Video rate is increased 35×. Movie corresponds to data in Figure 2B. Scale bar, 5 μm.
Comparisons of dynamic parameters of EB3 comets under different conditions. Plus tip tracker program (Matov et al., 2010; Applegate et al., 2011; Stout et al., 2014) was used to calculate the growth frequency (one-way ANOVA F(2, 50) = 4.10, p = 0.022), pause frequency (F(2, 50) = 8.378, p = 0.0007), percent time spent in growth (F(2, 50) = 10.21, p = 0.0002), percent time spent in pause (F(2, 50) = 12.34, p < 0.0001) and dynamicity (F(2, 50) = 17.69 p <0.0001). Download Figure 5-1, DOCX file (54KB, docx)
Tau knockdown misorients dynamic MT trajectories, which are rescued by human tau. Left video, Dynamic MTs in a control growth cone move in straight parallel trajectories oriented toward the leading edge. Nucleofection was with control pSUPER-turq vector and EB3-tdT. Middle video, Dynamic MTs in a growth cone after knockdown of endogenous tau move in disorganized trajectories misoriented away from the leading edge. Nucleofection was with hamster tau shRNA-turq and EB3-tdT. Right video, Dynamic MTs in a growth cone after knockdown of endogenous tau are rescued with human tau, which restores movement of dynamic MTs in straight parallel trajectories oriented toward the leading edge similar to controls. Nucleofection was with hamster tau shRNA-turq, human GFP tau, and EB3-tdT. In all three videos EB3 comets appear white. Single-channel TIRF acquisition rate in all three videos is 1 frame/3 s (0.33 Hz) over 5 min. Image processing was performed with MetaMorph software. Video rate was increased 35×. Movies correspond to data shown in Figure 4B. Scale bar, 5 μm.
Tau knockdown disrupts dynamic exploration of MTs in the growth cone periphery. Left video, Dynamic MTs in a control growth cone extend into the actin rich periphery where EB3 comets track along actin filament bundles to the tips of filopodia. Nucleofection was with the pSUPER-Turq vector, mRuby-Lifeact (magenta) and EB3-GFP (green). Right video, Dynamic MTs in a growth cone after tau knockdown remain in the growth cone center and fail to invade the F-actin rich periphery or filopodia. Nucleofection was with tau shRNA-Turq, mRuby-Lifeact (magenta) and EB3-GFP (green). Dual-channel TIRF acquisition rate is 1 frame/3 s (0.33 Hz) over 5 min. Image processing was performed with MetaMorph software. Video rate is increased 35×. Movies correspond to data in Figure 6. Scale bar, 5 μm.