

Abstract
Recent literature suggests an increase in the incidence of acute kidney injury (AKI). We evaluated population-based trends of AKI over the course of nine years, using a validated electronic health record tool to detect AKI. All adult residents (18 years of age and older) of Olmsted County, Minnesota (MN) admitted to the Mayo Clinic Hospital between 2006 and 2014. The incidence rate of AKI was calculated and temporal trends in the annual AKI incident rates assessed. During the nine-year study period, 10,283, and 41,847 patients were admitted to the intensive care unit or general ward, with 1,740 and 2,811 developing AKI, respectively. The unadjusted incidence rates were 186 and 287 per 100,000 person years in 2006 and reached 179, and 317 per 100,000 person years in 2014. Following adjustment for age and sex, there was no significant change in the annual AKI incidence rate during the study period with a Relative Risk of 0.99 per year (95%confidence interval 0.97-1.01), for intensive care unit patients and 0.993 per year (0.98-1.01), for the general ward patients. Similar results were obtained when the ICD 9 codes or administrative data for dialysis-requiring AKI was utilized to determine incident cases. Thus, despite the current literature which suggests an epidemic of AKI, we found that after adjusting for age and sex the incidence of AKI in the general population remained relatively stable over the last decade.
Keywords: Acute kidney injury, epidemiology, population base, incidence, intensive care unit
Introduction
Acute kidney injury (AKI) is a common complication among hospitalized, acutely ill patients. The consequences to patients affected by this syndrome are significant, and regardless of etiology, AKI is associated with increased mortality and morbidity. The impact of AKI on patient outcomes and healthcare systems is tremendous. It is estimated that AKI in high-income countries costs $1 billion USD, claims 300,000 lives, results in 170,000 end-stage kidney disease diagnoses, and contributes to the development of 300,000 advanced chronic kidney disease (CKD) cases on an annual basis. The impact of AKI's societal burden in low to middle-income countries is increasingly prevalent.1
In a recent multinational cross-sectional study, the rate of AKI in the intensive care unit (ICU) was reported at 58%.2 The incidence of AKI in the general ward has been reported at 6.4% (4.3% community, and 2.1% hospital-acquired).3 It also has been reported that the rate of AKI among hospitalized patients has consistently increased over the past two decades. Hsu et al. found the incidence rate of community-based AKI increased from 323 cases per 100,000 person-years in 1996 to 522 cases per 100,000 person-years in 2003.4 A similar percentage increase was observed among patients who required renal replacement therapy (RRT) following AKI. In the first decade of the 21st century, the incidence of dialysis-requiring AKI in hospitalized patients has risen.5 This observation is attributed to several factors including an aging population with a growing number of comorbidities, increased utilization of invasive interventions in high-risk groups, greater use of potentially toxic medications and sensitive criteria to better define AKI. To add to the complexity of the issue, the incidence of AKI also varies between different populations. Srisawat et al. reported that the incidence of AKI differed from 15% to 44% and RRT-requiring AKI from 5% to 12% between six different medical centers.6
Published studies regarding the temporal trends of AKI incidence among hospitalized patients over time have critical limitations. Prior studies implementing administrative data for the identification of patients with AKI are limited by the significantly low sensitivity (17-29%) of administrative codes for AKI.7 Other investigations that have studied biochemical definitions for AKI have back calculated baseline serum creatinine from an assumed eGFR (typically 75 ml/min/1.73m2) when not available, or used the first serum creatinine at the index admission. It is known that these strategies inflate or deflate the incidence of AKI, respectively. Furthermore, studies to date rarely use the urine output criterion component of a standard AKI definition. Articles citing administrative data to identify dialysis-requiring AKI are the most reliable, as the administrative codes for dialysis are generally highly sensitive and specific.8 Another important consideration is that epidemiology studies have exclusively identified the inpatient population as the “at risk group” to calculate incidence rates, rather than the whole population.9 As inpatients have generally become older and sicker over time, hospitalization is associated with an increased rate of AKI in and of itself.
The use of electronic health records (EHR) to improve the quality of care, mandated by the American Recovery and Reinvestment Act, and the Health Information Technology for Economic and Clinical Health Act in 2009, is a high priority in the United States.10, 11 Based on recent advances in the field, clinicians are now able to use EHR for the surveillance of clinical syndromes including AKI.12, 13 Although EHR surveillance tools have been developed to analyze data at the hospital level, they have never been used to evaluate the AKI temporal trends in a population-based study. Utilizing an unbiased computer algorithm for AKI detection avoids shortcomings associated with other methodologies of AKI adjudication, which evaluate administrative codes, biochemical data, and/or manual chart review. Thus, in the current study, we utilized a validated electronic surveillance tool (AKI Sniffer) to assess changes in AKI incidence rates over the span of nine years among a well-defined population.14
Results
Based on the U.S. Census Bureau data, Olmsted County contained 144,067 residents on July 1st, 2010, of which 112,875 were ≥18 years old. Among adult residents, 14% were ≥65 years old, 51% female, 85.7% of the White race, 94% were high school graduates or pursued some higher education, 40.2% had a bachelor's degree or higher education, and 92.1% were medically insured. Supplementary Table 1 shows the estimated adult Olmsted County population.
During the study period, among 111,556 Mayo Clinic Hospital admissions (52,130 unique patients), 10,283 unique Olmsted County residents were admitted to the ICUs and 41,847 residents to the general ward. Over the study period, the average age of the population increased slightly with the 18-54 cohort falling from 79,000 to 77,070, while the 55-64 years old cohort increased from 13,639 to 17,720. Patients 65-74 years old increased from 8,441 to 11,125 and patients greater than 75 years old rose from 7,974 to 9,631. Table 1 summarizes the demographics, exposures, and outcomes of all ICU and general ward patients along with those who developed AKI. Among all ICU and general ward patients, respectively, median (IQR) age was 65 (49-79) and 67 (51-79) years, Charlson Comorbidity Index (CCI) was 4 (2-6) and 2 (0-5), and hospital length of stay was 4 (2-8) and 2 (1-4) days. Furthermore, the percentage of male sex was 50% and 39%, high-risk surgery was 11% and 3%, nephrotoxin exposure was 54% and 46%, AKI was 17% and 7%, and hospital mortality was 9% and 1% in the ICU and general ward, respectively.
Table 1.
Baseline characteristics of all ICU and general ward patients and patients who developed AKI admitted from the beginning of 2006 through the end of 2014.
| Variable Characteristic | ICU | General ward | ||
|---|---|---|---|---|
| Total (n=10,283) | AKI (n=1,740) | Total (n=41,847) | AKI (n=2,811) | |
| Age | 65 (49-79) | 73 (60-84) | 67 (51-79) | 75 (63-83) |
| Male gender | 5,508 (50%) | 912 (52%) | 16,192 (39%) | 1,339 (48%) |
| Caucasian race | 9,235 (90%) | 1,567 (90%) | 36,984 (88%) | 2,595 (92%) |
| BMI | 28 (24-32) | 28 (24-34) | 27 (24-32) | 27 (23-32) |
| CCI | 4 (2-6) | 6 (4-8) | 2 (0-5) | 6 (4-8) |
| DM | 2,005 (19%) | 532 (31%) | 4,742 (11%) | 804 (29%) |
| HTN | 5,079 (49%) | 1,169 (67%) | 13,813 (33%) | 1,902 (68%) |
| CKD | 1,010 (10%) | 391 (22%) | 1,931 (5%) | 599 (21%) |
| Chronic liver disease | 201 (2%) | 61 (4%) | 368 (0.9%) | 64 (2%) |
| CHF | 646 (6%) | 226 (13%) | 1,168 (3%) | 312 (11%) |
| PVD | 405 (4%) | 122 (7%) | 688 (2%) | 189 (7%) |
| CVA | 939 (9%) | 239 (14%) | 2,035 (5%) | 362 (13%) |
| Cancer | 2,180 (21%) | 453 (26%) | 6,651 (16%) | 746 (27%) |
| COPD | 1,018 (10%) | 245 (14%) | 1,942 (5%) | 335 (12%) |
| CAD | 2,216 (22%) | 545 (31%) | 4,611 (11%) | 783 (28%) |
| High risk surgery | 1,080 (11%) | 182 (10%) | 1,221 (3%) | 177 (6%) |
| Any nephrotoxin | 5,601 (54%) | 1,155 (66%) | 19,112 (46%) | 1,457 (52%) |
| ≥3 nephrotoxins | 2,677 (26%) | 543 (31%) | 8,444 (20%) | 692 (25%) |
| APACHE III | 53 (38-70) | 73 (60-91) | -- | -- |
| SOFA day 1 | 3 (1-5) | 6 (4-9) | -- | -- |
| AKI stage 1 | 1,426 (14%) | 2,483 (6%) | ||
| AKI stage 2 | 492 (5%) | 499 (1%) | ||
| AKI stage 3 | 340 (3%) | 351 (0.9%) | ||
| AKI requiring dialysis | 322 (3%) | 210 (0.5%) | ||
| AKI by ICD-9 | 782 (8%) | 3,503 (8%) | ||
| ICU mortality | 515 (5%) | 260 (15%) | -- | -- |
| Hospital mortality | 888 (9%) | 414 (24%) | 421 (1%) | 146 (5%) |
| ICU LOS | 1 (0.8-2) | 2 (1-4) | -- | -- |
| Hospital LOS | 4 (2-8) | 7 (4-11) | 2 (1-4) | 4 (2-6) |
Abbreviations: AKI, acute kidney injury; APACHE, Acute Physiology and Chronic Health Evaluation; BMI, body mass index; CAD, coronary artery disease; CCI, Charlson comorbidity index; CHF, congestive heart failure; CKD, chronic kidney disease; COPD, chronic obstructive pulmonary disease; CVA, cerebrovascular accident ; DM, diabetes mellitus; HTN, hypertension; ICD-9, International Classification of Diseases, Ninth Revision; LOS, length of stay; PVD, peripheral vascular disease; SOFA, Sequential Organ Failure Assessment.
Sniffer-diagnosed AKI incidence trends
In an unadjusted analysis, during the study period among all Olmsted County residents, the annual temporal trend of AKI incidence did not change among ICU patients. The trend was also flat for AKI stages I and II among general ward patients. However, the AKI Stage III incidence rate increased significantly among general ward patients [relative risk (RR) 1.055 per year; 95% CI 1.012-1.099] (Table 2; Supplementary Fig. 1A and Supplementary Fig. 2A, B, and C). Within the same time period, when the results were adjusted for the age and sex of the population, there was no significant change in the incidence of AKI among any of the categories. The only two exceptions were, a downward trajectory of AKI Stage II trends (∼3% per year) among ICU patients [RR 0.969 per year, 95% CI 0.946-0.993, P=.011], and an increase of AKI stage III (∼4% per year) among general ward patients [RR 1.039 per year, 95% CI 1.015-1.064, P=.001] (Table 2; Fig. 1; Supplementary Fig. 1B, 1C, and 1D).
Table 2.
Unadjusted and adjusted (age and sex) temporal annual trends of AKI incidence among all Olmsted County residents. Data is represented based on the location of admission (ICU, general ward, and all) and the methodology of AKI adjudication (AKI sniffer when not mentioned otherwise, ICD-9 codes for AKI, and administrative codes for dialysis-requiring AKI).
| Unadjusted | Adjusted for Age and Sex | |||||
|---|---|---|---|---|---|---|
|
| ||||||
| Location | Relative risk | 95% CI | Relative risk | 95% CI | P-Value | |
|
| ||||||
| ICU | All AKI Stages | 0.990 | 0.972 - 1.008 | .294 | ||
| AKI stage 1 | 1.010 | 0.990 - 1.031 | 0.993 | 0.973 - 1.013 | .507 | |
| AKI stage 2 | 0.985 | 0.952 - 1.019 | 0.969 | 0.946 - 0.993 | .011 | |
| AKI stage 3 | 1.003 | 0.962 - 1.045 | 0.989 | 0.965 - 1.012 | .365 | |
|
| ||||||
| General ward | All AKI Stages | 0.993 | 0.979 - 1.007 | .371 | ||
| AKI stage 1 | 1.002 | 0.987 - 1.018 | 0.986 | 0.971 - 1.002 | .089 | |
| AKI stage 2 | 1.022 | 0.987 - 1.057 | 1.006 | 0.982 - 1.031 | .58 | |
| AKI stage 3 | 1.055 | 1.012 - 1.099 | 1.039 | 1.015 - 1.064 | .001 | |
|
| ||||||
| ICU and general ward | All AKI Stages | 0.992 | 0.981 - 1.003 | .176 | ||
| AKI stage 1 | 1.005 | 0.993 - 1.017 | 0.989 | 0.977 - 1.001 | .078 | |
| AKI stage 2 | 1.003 | 0.979 - 1.028 | 0.988 | 0.971 - 1.005 | .165 | |
| AKI stage 3 | 1.029 | 0.999 - 1.059 | 1.014 | 0.997 - 1.031 | .097 | |
|
| ||||||
| ICU | AKI based on ICD-9 | 1.031 | 1.003 - 1.059 | 1.013 | 0.986 - 1.041 | .321 |
| Ward | AKI based on ICD-9 | 1.021 | 1.008 - 1.035 | 1.009 | 0.965 - 1.022 | .148 |
|
| ||||||
| ICU | AKI requiring dialysis | 1.007 | 0.966 - 1.051 | 0.993 | 0.951 - 1.036 | .746 |
| General ward | AKI requiring dialysis | 1.065 | 1.010 - 1.123 | 1.048 | 0.994 - 1.105 | .077 |
| ICU and general ward | AKI requiring dialysis | 1.030 | 0.996 - 1.064 | 1.014 | 0.981 - 1.048 | 0.392 |
Abbreviations: AKI; acute kidney injury, CI; confidence interval, ICU; intensive care unit, ICD-9; International classification of Diseases, Ninth Revision
Figure 1.
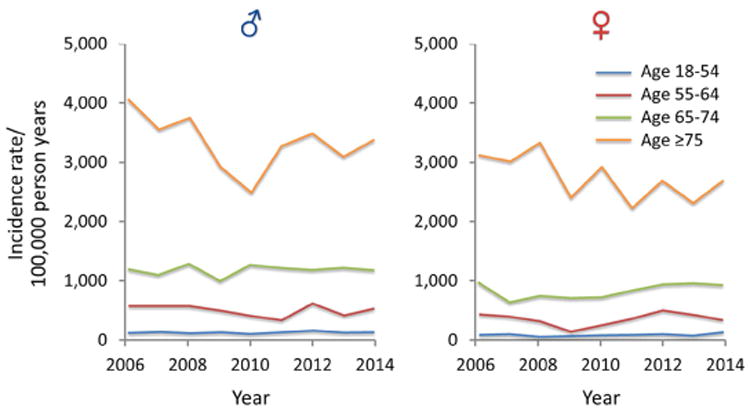
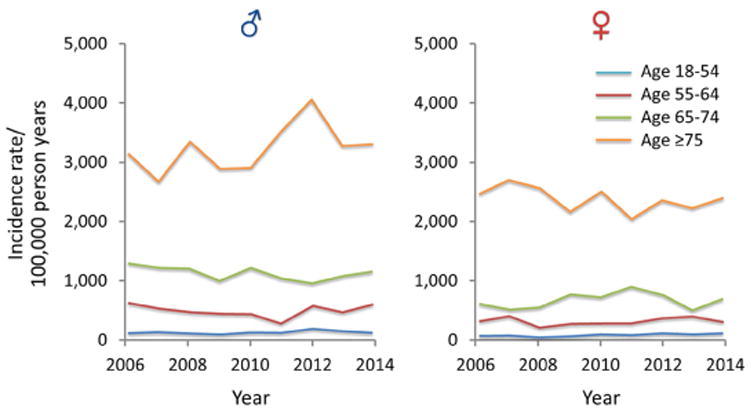
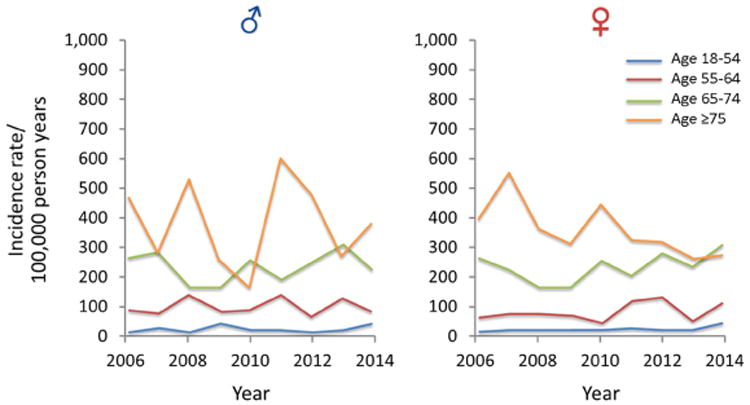
A) Trends of AKI among all ICU and ward admission detected by AKI Sniffer and stratified by age and sex from 2006 to 2014; B) Trends of AKI among all ICU and ward admission detected by ICD-9 codes and stratified by age and sex from 2006 to 2014; C) Trends of dialysis requiring AKI among all ICU and hospital admission detected by administrative data and stratified by age and sex from 2006 to 2014 (note different Y-axis scale in comparison with A and B)
ICD-9 diagnosed AKI incidence trends
In the unadjusted analysis, there was a significant increase in the RR of AKI by ICD-9 codes among ICU and general ward patients [RR 1.031 per year, 95% CI 1.003-1.059 for ICU admissions; RR 1.021, 95% CI 1.008-1.035 for the general ward admissions; RR 1.023 per year, 95% CI 1.01-1.035 for all admissions] (Table 2; Supplementary Fig. 1A and Supplementary Fig. 2A, B, and C). When the trend of AKI incidence adjudicated by ICD-9 codes was evaluated, in an age and sex-adjusted analysis there was no significant change in the incidence of AKI regardless of the location of admission (ICU vs. general ward) (Table 2; Fig. 1; Supplementary Fig. 1B, 1C, and 1D).
Dialysis-requiring AKI incidence trends
In an unadjusted analysis, the incidence of AKI requiring dialysis increased among general ward patients [RR 1.065 per year; 95% CI 1.010-1.123], but not in ICU patients (Table 2; Supplementary Fig. 1A and Supplementary Fig. 2A, B, and C). Following age and sex adjustment, there was no significant change in the incidence of dialysis-requiring AKI among any of the locations (Table 2; Fig. 1; Supplementary Fig. 1B, 1C, and 1D).
Sensitivity analysis
Among the ICU cohort some patients were adjudicated to the AKI category based upon the urine output criterion alone. In addition, a subset of patients in both the ICU and general ward groups did not have baseline serum creatinine values available for study. In order to detect any bias that may have been introduced by these missing data elements we conducted two sensitivity analyses. In the first sensitivity analysis in the ICU cohort, after excluding patients diagnosed with AKI based upon urine output alone the flat temporal trend of AKI incidence did not change. In the second sensitivity analysis, after all patients who did not have a measured baseline serum creatinine were excluded the temporal trend of AKI incidence also remained flat, except when patients were adjudicated to AKI category by ICD-9 codes (Supplementary Table 2).
Acute kidney injury risk factors and their trends
Among Olmsted County residents admitted to the ICU or general ward between 2006 and 2014 (n=52,130), the risk of AKI was higher in males and older individuals (Supplementary Table 3). Between 2006 and 2014, for AKI patients admitted to Mayo Clinic ICUs (n=1,704), annual trends of body mass index (BMI) significantly increased (P=.009) while Acute Physiology and Chronic Health Evaluation (APACHE) III scores (P=.005), and CCI (P<.001) significantly decreased. In the same time period, the annual rate of exposure to any nephrotoxin [odds ratio (OR) 0.92 per year; 95% CI 0.89-0.96; P<.001] or ≥3 nephrotoxic drugs [OR 0.94 per year; 95% CI 0.90-0.97; P=.001] decreased, while the annual rate of high-risk surgeries increased [OR 1.7 per year; 95% CI 1.12-1.27; P<.001]. Among general ward patients who developed AKI (n=2,811) a significant annual trend towards decreased CCI (P<.001) and an increase in high-risk surgeries [OR 1.189 per year; 95% CI 1.12-1.27; P<.001] was observed (Supplementary Table 4). Age and sex mix of the AKI cohort did not significantly change, but patient comorbidities, as reflected by the CCI, declined slightly.
Discussion
Sniffer-diagnosed AKI incidence trends
Following adjustment for age and sex, the overall trend of Sniffer-diagnosed AKI incidence in Olmsted County was flat in all categories, except for an increase in AKI stage III incidence among the general ward patients and a decrease in AKI stage II among ICU patients. Factors which may contribute to a slight increase in AKI in general ward patients include changing demographics, as well as a prevalence of higher risk surgery among hospitalized patients.
Nearly all of the studies that reviewed administrative data or biochemical criteria for AKI detection have reported a dramatic increase in AKI incidence rates over time.4, 5, 15, 16 There are several methodological differences in our study compared to previously published research. First, unlike most studies which identify hospitalized patients as the denominator in order to calculate incidence rates, we used the Olmsted County adult population as the “at risk” group. Looked at in this population-based manner, the increase in overall AKI stage III cases observed in the unadjusted analysis among the ward patients disappeared following adjustments for age and sex. This highlights the likelihood that the increasing age of the United States population, including Olmsted County, may explain observed changes in AKI incidence in unadjusted analyses. In addition, we detected improved processes of care in our medical center, including a decrease in the use of nephrotoxins during the course of the study. We also utilized a validated AKI electronic Sniffer to identify patients using the Acute Kidney Injury Network criteria with high reliability and precision.17 The AKI Sniffer used serum creatinine and urine output criteria to identify AKI in the ICU, and serum creatinine alone to identify AKI among the general ward patients. The AKI Sniffer is unbiased and reliable. In prior epidemiological studies which used biochemical definitions for AKI detection, two strategies were chosen to determine any missing baseline serum creatinine values for individual patients. The first group of studies back calculated the baseline serum creatinine by using the MDRD formula back-calculation of serum creatinine with a baseline estimate GFR of 75 ml/min/1.73m2.18 Given the prevalence of CKD in the community, assuming an eGFR of 75 ml/min1.73m2 as the baseline kidney function will generally inflate AKI incidence, since many CKD patients will be misclassified as new AKI patients.9 In the second group of studies which use the biochemical definition of AKI for the evaluation of trends in AKI incidence rates, back calculation of baseline serum creatinine is done by reviewing the first or lowest post hospital admission serum creatinine level. This potentially deflates the AKI cases since community-acquired AKI is now misclassified as non-AKI. In our study, 16,035 (38.3%) of the general ward and 5,608 (54.5%) of ICU patients had at least one serum creatinine recorded in their EHR. For the rest of the patients, we used the back calculation technique described by Ahmed et al.14 To enhance the specificity of the AKI Sniffer, we developed an MDRD formula back calculation with an eGFR of 60 ml/min/1.73m2. And finally, most studies in the biochemical diagnosis of AKI category did not measure urine output criterion to identify AKI patients. The AKI Sniffer uses both serum creatinine and urine output criteria for all ICU patients.
ICD-9 diagnosed AKI incidence trends
When ICD-9 codes were used in the unadjusted analysis, an increase in the incidence rate of AKI was noted among ICU and general ward patients. This could, in part, be interpreted as an improved documentation of AKI within this timeline. Mayo Clinic conducted several quality improvement projects for EHR documentation which may have resulted in an observed increase in AKI incidence via ICD-9 codes.
Furthermore, following age and sex adjustments, AKI incidence rates based on ICD-9 coding did not show any increase among the population residents, suggesting that changing demographics (i.e., age) is also a factor. In a recent study of Medicare beneficiaries, the authors observed an 11% per year increase in the standardized rates of AKI from 1992 and 2001.19 In a similar design, Waikar et al. reported an upward trend of AKI from 1988 to 2002, using the Nationwide Inpatient Sample (NIS) database. This study also demonstrated that hospital mortality among patients with AKI decreased.7 Increased awareness, financial, and administrative clarity, and the use of additional sensitive definition criteria may have impacted the observed higher AKI incidence which was replicated in our unadjusted analysis.9 As we were not able to reproduce results from the above-mentioned studies following selection of the whole population as the “at risk” group and adjustment for age and sex, it seems likely that the findings of previous studies were confounded by using hospitalized patients with increasing comorbidities and severity of illness as the “at-risk group.” In summary, our results suggest that the observed rise in the incidence of AKI among the whole population is likely explained by the overall aging population.
Dialysis-requiring AKI incidence trends
We did not find a significant increase in dialysis-requiring AKI following age and sex adjustments. The current literature unanimously describes an increase in the incidence of dialysis-requiring AKI.4, 5, 7, 20-27 Improving dialysis availability, a liberal, earlier initiation of dialysis in acute and chronic kidney diseases, increasing comorbidities and severity of acute illnesses, greater use of high-risk procedures and nephrotoxins are some of the factors that may support such findings.9 In our study, we observed a statistically significant decline in CCI and the use of nephrotoxins, particularly in the ICU setting which per sé can explain our observed flat incidence rate.
Clinical implications
Our study as the first population-based epidemiological study of temporal changes in AKI incidence provides valuable insights into the epidemiology of AKI and contrasts and complements previously published data. When the whole population was considered as an at-risk group, prior to adjustments, AKI incidence had an upward trajectory. After adjusting for age and sex, this trend was attenuated. This indicates that the recently reported epidemics of acute kidney injury are likely related to an aging population, changing hospital practices (i.e. admitting patients with a higher severity of illness), and/or performing higher risk procedures on older individuals. Whether preventive measures that limit the age-related complications (e.g. hypertension, diabetes, hyperlipidemia, chronic kidney disease, sepsis, heart failure, etc.) could potentially avoid further increase in the incidence of AKI needs to be seen. We also found that trend of risk factors and exposures evolved over the course of the study. Our results can help policy makers, clinicians, and investigators to account for issues related to aging and its associated comorbidities and exposures when assessing hospital complications like AKI.
Limitations
This study has several limitations. There is a possibility that some Olmsted County residents were admitted to other facilities during this time period, particularly if they experienced AKI with mild intensity (AKI Stage I). As Mayo Clinic Hospital is the only local facility with acute inpatient dialysis and nephrology services, the impact of this limitation, particularly on the incidence of higher stages of AKI (Stage II and III) should be minimal. One of the other limitations of this study is the potential effect of migration to and away from Olmsted County during the course of the study. As the patterns of migration during the study period did not change in the Olmsted County, the impact of such bias in our results is unlikely. The other limitation is less diversity among the enrolled population. Although Olmsted County residents are relatively educated and wealthy, and ethnically less diverse, as compared to the total population of the United States, their age, and sex-specific mortality rates are similar to the entire country, and the results of previous epidemiological studies within the Olmsted County have been consistent with other national observations.28, 29 Since the AKI Sniffer sensitivity rate is 88%, up to 12% of patients with AKI could have been missed on an annual basis. However, since the sensitivity of the AKI Sniffer does not change, its impact on our annual incidence trends should be negligible.14 Finally, a very small minority of the patients with a lower stage of AKI (Stage I or subclinical AKI) could have been managed while the patient remained an outpatient, but the impact of this on the incidence of the clinically significant stages two and three AKI is nil.
Strengths
Our study has several strengths. It is the first large-scale population-based study in a well-defined geographical territory. It uses a validated electronic AKI Sniffer with high reliability. The AKI Sniffer uses a contemporary consensus definition of AKI (AKIN definition) and uses serum creatinine for all ICU and ward patients plus urine output criteria for all ICU patients. In addition to the Sniffer data, in order to compare our results with similar studies, we reported administrative data (ICD-9 codes, and the need for dialysis) for AKI detection. In order to mitigate potential biases that could be introduced by enrolling ICU patients who were diagnosed with AKI solely based on urine output criterion, or those in ICU and general ward who did not have measured baseline serum creatinine, sensitivity analyses were conducted following exclusion of these patients. The results of these sensitivity analyses did not differ from the main analysis. This serves to confirm our findings in the main analysis that the trends of AKI in the general population level remained flat over the course of the study.
Conclusions
After adjustments for sex and age, we found no overall significant change in the temporal trend of AKI incidence in a population-based cohort admitted to a tertiary hospital, regardless of the methodology used to adjudicate the AKI cases. Our findings suggest that the widely reported dramatic rise of AKI in the hospitalized population could be interpreted differently, by considering changes in demographics and practice patterns amongst the hospitalized population. During the course of this study, an increased age of the at-risk group (Olmsted County population) was observed together with a decline in the prevalence of comorbidities, and use of nephrotoxic medications. An increased use of high-risk procedures was also noted. Finally, this study demonstrates the feasibility and utilization of a well-validated EHR surveillance tool to review a large data set for AKI-related studies.
Methods
Participants
Mayo Clinic Hospital is a 2,207- bed, level I trauma tertiary referral hospital in Olmsted County with an annual admission rate of 135,000 patients.30 As other tertiary medical centers are distant (from 114 to 376-km radius), critical care services for Olmsted County residents are almost exclusively provided by the Mayo Clinic Hospital. In addition, Mayo Clinic Hospital is the only facility in the county which offered full dialysis and nephrology services during the study period. The reference population included all adult residents (≥18 years old) of Olmsted County, MN enumerated through the US Census Bureau in 2010. For the other study years, the reference population was estimated via the data obtained from the Rochester Epidemiology Project (REP).29, 31 The study was performed with Mayo Clinic Institutional Board approval, and residents who lacked research authorization were excluded as per Minnesota statutes. The first general ward or ICU admission at the Mayo Clinic from January 1st, 2006 through December 31st, 2014 was identified for each resident. Patients were stratified based on the level of care needed at their index admission. Regardless of subsequent transfers during the index admission, their admission type was stratified based on their initial admission level of care (ICU vs. general ward).
Screening and data collection
We reviewed the REP data to assess the annual Olmsted County population and their age and sex.29 In order to identify Mayo Clinic Hospital admissions and diagnoses among Olmsted County residents, we used Advanced Cohort Explorer (ACE) and ICU Data Mart (described elsewhere). 30, 32 We used AKI Sniffer in order to adjudicate AKI incident cases. The AKI Sniffer is an automated electronic tool to detect AKI and its stages according to the AKIN criteria17 by assessing patient medical records at 15-minute intervals. The screening process starts from the time of admission and continues to discharge. The tool analyzes any rise in serum creatinine level or decrease in urine output. The presence of AKI is detected when the first criterion fires (serum creatinine or urine output rules). Then the stage of AKI is determined as the maximum stage reached during the surveillance period. The methods for urine output data collection or serum creatinine measurement did not change during the study period.
In a previously reported study, the AKI Sniffer was trained for the highest sensitivity and specificity within the derivation cohort, and after optimization of its performance, it was validated in a separate cohort. For each cohort, manual review of the medical records and AKI adjudication by two independent reviewers was considered as the gold standard. Baseline serum creatinine was considered the median value of all the creatinine measures during 180 days prior to the index ICU admission or back-calculated serum creatinine with baseline eGFR of 60 ml/min when serum creatinine was not available. During the derivation process, in comparison with the literature suggested eGFR of 75 ml/min for serum creatinine back-calculation, we found eGFR of 60 ml/min provides higher specificity without sacrificing sensitivity. The urine output criterion was implemented in reference to the a priori defined thresholds by the AKI network. The urine output considered as hourly recording, especially if the measurement source was Foley catheter. In this case, hourly urine output measurements were done by the BARD® CRITICORE® Monitor which provides accurate urine per milliliter in each hour. When the urine output deviated from the hourly resolution (e.g., charting delays or lack of indwelling urinary catheter), the algorithm converted the urine output data for a given window of investigation to hourly values. Within the validation cohort of 462 patients, the performance of the AKI Sniffer was found to be unyielding with a sensitivity of 88% and specificity of 96%.
The complete list of collected data is summarized in Appendix A, and nephrotoxin list is mentioned in Appendix B.
AKI Classification
As our EHR surveillance tool was validated for the AKIN definition, we used it to identify patients with AKI.17 We used both serum creatinine and urine output criteria to identify and stage AKI in patients during hospitalization. The previously published performance of this electronic tool was excellent, with a sensitivity of 88% and specificity of 96%.14 In separate analyses ICD-9 codes for all AKI patients and administrative codes for dialysis-requiring AKI patients were used.
Statistical analysis
Continuous variables were summarized with mean and standard deviations (SD), median, and interquartile ranges (IQR), wherever appropriate. Categorical patient factors were summarized using counts and percentages. Age and sex-specific AKI incidence rates were calculated assuming all adult Olmsted County residents to be “at risk.” Specifically, the number of AKI incident cases was the numerator, and the denominator was the population estimate – based on the decennial census. Only adults who fulfilled the study criteria were included in the numerator. Incident rates are expressed on a 100,000 person-years basis. Age was treated as an ordinal variable, stratified into four mutually exclusive age ranges (18-54, 55-64, 65-74, and ≥75 years old).33 Univariate incident trends were studied using a Poisson regression model with a linear term for the calendar year. A multivariable Poisson regression model with sex, age class, and linear calendar year was developed for statistical adjustments. The likelihood ratio test was used to determine if the age and sex-adjusted temporal trends were statistically significant. To evaluate the temporal trends of continuous or categorical AKI risk factors, linear or logistic regression models with a linear calendar year term were used. The “R” Foundation for Statistical Computing software (version 3.2.4; 2016, Vienna, Austria) was used for statistical analyses. All statistical tests were two-sided, and P<.05 were considered significant.
In order to evaluate the impact of urine output diagnostic criterion on the temporal trends in AKI incidence, we did a sensitivity analysis after exclusion of patients who were diagnosed with AKI only by urine output criterion. In addition, a second sensitivity analysis was performed after exclusion of all patients who did not have measured baseline serum creatinine available.
Supplementary Material
Acknowledgments
This publication was made possible by CTSA Grant Number UL1 TR000135 from the National Center for Advancing Translational Sciences (NCATS), a component of the National Institutes of Health (NIH). Its contents are solely the responsibility of the authors and do not necessarily represent the official view of NIH. This study was made possible using the resources of the Rochester Epidemiology Project, which is supported by the National Institute on Aging of the National Institutes of Health under Award Number R01AG034676. The content is solely the responsibility of the authors and does not necessarily represent the official views of the National Institutes of Health.
Disclosure Statement: The first author (KK) is the recipient of the Mayo Clinic Department of Medicine Write-up and Publish (WRAP) grant which provided 5 business days for completion of this manuscript. No other financial support for any other authors. WK receives research funding from AstraZeneca.
Footnotes
Institution: This work was performed at Mayo Clinic, Rochester, MN.
Authors' Contributions: KK played a principal role in the design, analysis, and preparation of the manuscript.
Publisher's Disclaimer: This is a PDF file of an unedited manuscript that has been accepted for publication. As a service to our customers we are providing this early version of the manuscript. The manuscript will undergo copyediting, typesetting, and review of the resulting proof before it is published in its final citable form. Please note that during the production process errors may be discovered which could affect the content, and all legal disclaimers that apply to the journal pertain.
References
- 1.Lewington AJP, Cerda J, Mehta RL. Raising awareness of acute kidney injury: a global perspective of a silent killer. Kidney international. 2013;84:457–467. doi: 10.1038/ki.2013.153. [DOI] [PMC free article] [PubMed] [Google Scholar]
- 2.Hoste EJ, Bagshaw S, Bellomo R, et al. Epidemiology of acute kidney injury in critically ill patients: the multinational AKI-EPI study. Intensive care medicine. 2015;41:1411–1423. doi: 10.1007/s00134-015-3934-7. [DOI] [PubMed] [Google Scholar]
- 3.Wonnacott A, Meran S, Amphlett B, et al. Epidemiology and Outcomes in Community-Acquired Versus Hospital-Acquired AKI. Clin J Am Soc Nephrol. 2014;9:1007–1014. doi: 10.2215/CJN.07920713. [DOI] [PMC free article] [PubMed] [Google Scholar]
- 4.Hsu CY, McCulloch CE, Fan D, et al. Community-based incidence of acute renal failure. Kidney international. 2007;72:208–212. doi: 10.1038/sj.ki.5002297. [DOI] [PMC free article] [PubMed] [Google Scholar]
- 5.Hsu RK, McCulloch CE, Dudley RA, et al. Temporal Changes in Incidence of Dialysis-Requiring AKI. Journal of the American Society of Nephrology. 2013;24:37–42. doi: 10.1681/ASN.2012080800. [DOI] [PMC free article] [PubMed] [Google Scholar]
- 6.Srisawat N, Sileanu FE, Murugan R, et al. Variation in Risk and Mortality of Acute Kidney Injury in Critically Ill Patients: A Multicenter Study. American Journal of Nephrology. 2015;41:81–88. doi: 10.1159/000371748. [DOI] [PubMed] [Google Scholar]
- 7.Waikar SS, Curhan GC, Wald R, et al. Declining mortality in patients with acute renal failure, 1988 to 2002. J Am Soc Nephrol. 2006;17:1143–1150. doi: 10.1681/ASN.2005091017. [DOI] [PubMed] [Google Scholar]
- 8.Waikar SS, Wald R, Chertow GM, et al. Validity of International Classification of Diseases, Ninth Revision, Clinical Modification Codes for Acute Renal Failure. J Am Soc Nephrol. 2006;17:1688–1694. doi: 10.1681/ASN.2006010073. [DOI] [PubMed] [Google Scholar]
- 9.Siew ED, Davenport A. The growth of acute kidney injury: a rising tide or just closer attention to detail? Kidney international. 2015;87:46–61. doi: 10.1038/ki.2014.293. [DOI] [PMC free article] [PubMed] [Google Scholar]
- 10.Lenert L, Sundwall DN. Public health surveillance and meaningful use regulations: a crisis of opportunity. Am J Pub Health. 2012;102:e1–7. doi: 10.2105/AJPH.2011.300542. [DOI] [PMC free article] [PubMed] [Google Scholar]
- 11.Kashani K, Herasevich V. Utilities of Electronic Medical Records to Improve Quality of Care for Acute Kidney Injury: Past, Present, Future. Nephron. 2015;131:92–96. doi: 10.1159/000437311. [DOI] [PubMed] [Google Scholar]
- 12.Hoste EAJ, Kashani K, Gibney N, et al. Impact of electronic-alerting of acute kidney injury: workgroup statements from the 15th ADQI Consensus Conference. Canadian Journal of Kidney Health and Disease. 2016;3:1–9. doi: 10.1186/s40697-016-0101-1. [DOI] [PMC free article] [PubMed] [Google Scholar]
- 13.Kashani K, Herasevich V. Sniffing out acute kidney injury in the ICU: do we have the tools? Curr Opin Crit Care. 2013;19:531–536. doi: 10.1097/MCC.0000000000000024. [DOI] [PubMed] [Google Scholar]
- 14.Ahmed A, Vairavan S, Akhoundi A, et al. Development and validation of electronic surveillance tool for acute kidney injury: A retrospective analysis. J Crit Care. 2015 doi: 10.1016/j.jcrc.2015.05.007. [DOI] [PubMed] [Google Scholar]
- 15.Hou SH, Bushinsky DA, Wish JB, et al. Hospital-acquired renal insufficiency: a prospective study. The American journal of medicine. 1983;74:243–248. doi: 10.1016/0002-9343(83)90618-6. [DOI] [PubMed] [Google Scholar]
- 16.Nash K, Hafeez A, Hou S. Hospital-acquired renal insufficiency. Am J Kidney Dis. 2002;39:930–936. doi: 10.1053/ajkd.2002.32766. [DOI] [PubMed] [Google Scholar]
- 17.Mehta RL, Kellum JA, Shah SV, et al. Acute Kidney Injury Network: report of an initiative to improve outcomes in acute kidney injury. Crit Care. 2007;11:R31. doi: 10.1186/cc5713. [DOI] [PMC free article] [PubMed] [Google Scholar]
- 18.Levey AS, Coresh J, Greene T, et al. Using Standardized Serum Creatinine Values in the Modification of Diet in Renal Disease Study Equation for Estimating Glomerular Filtration Rate. Annals of Internal Medicine. 2006;145:247–254. doi: 10.7326/0003-4819-145-4-200608150-00004. [DOI] [PubMed] [Google Scholar]
- 19.Xue JL, Daniels F, Star RA, et al. Incidence and mortality of acute renal failure in Medicare beneficiaries, 1992 to 2001. Journal of the American Society of Nephrology : JASN. 2006;17:1135–1142. doi: 10.1681/ASN.2005060668. [DOI] [PubMed] [Google Scholar]
- 20.Feest TG, Round A, Hamad S. Incidence of severe acute renal failure in adults: results of a community based study. BMJ. 1993;306:481–483. doi: 10.1136/bmj.306.6876.481. [DOI] [PMC free article] [PubMed] [Google Scholar]
- 21.Khan IH, Catto GR, Edward N, et al. Acute renal failure: factors influencing nephrology referral and outcome. Qjm. 1997;90:781–785. doi: 10.1093/qjmed/90.12.781. [DOI] [PubMed] [Google Scholar]
- 22.Liano F, Pascual J. Epidemiology of acute renal failure: a prospective, multicenter, community-based study. Madrid Acute Renal Failure Study Group Kidney international. 1996;50:811–818. doi: 10.1038/ki.1996.380. [DOI] [PubMed] [Google Scholar]
- 23.Korkeila M, Ruokonen E, Takala J. Costs of care, long-term prognosis and quality of life in patients requiring renal replacement therapy during intensive care. Intensive care medicine. 2000;26:1824–1831. doi: 10.1007/s001340000726. [DOI] [PubMed] [Google Scholar]
- 24.Stevens PE, Tamimi NA, Al-Hasani MK, et al. Non-specialist management of acute renal failure. Qjm. 2001;94:533–540. doi: 10.1093/qjmed/94.10.533. [DOI] [PubMed] [Google Scholar]
- 25.Cole L, Bellomo R, Silvester W, et al. A prospective, multicenter study of the epidemiology, management, and outcome of severe acute renal failure in a 7“closed” ICU system. Am J Respir Crit Care Med. 2000;162:191–196. doi: 10.1164/ajrccm.162.1.9907016. [DOI] [PubMed] [Google Scholar]
- 26.Robertson S, Newbigging K, Isles CG, et al. High incidence of renal failure requiring short-term dialysis: a prospective observational study. Qjm. 2002;95:585–590. doi: 10.1093/qjmed/95.9.585. [DOI] [PubMed] [Google Scholar]
- 27.Prescott GJ, Metcalfe W, Baharani J, et al. A prospective national study of acute renal failure treated with RRT: incidence, aetiology and outcomes. Nephrol Dial Transplant. 2007;22:2513–2519. doi: 10.1093/ndt/gfm264. [DOI] [PubMed] [Google Scholar]
- 28.St Sauver JL, Grossardt BR, Leibson CL, et al. Generalizability of Epidemiological Findings and Public Health Decisions: An Illustration From the Rochester Epidemiology Project. Mayo Clinic proceedings. 2012;87:151–160. doi: 10.1016/j.mayocp.2011.11.009. [DOI] [PMC free article] [PubMed] [Google Scholar]
- 29.St Sauver JL, Grossardt BR, Yawn BP, et al. Data Resource Profile: The Rochester Epidemiology Project (REP) medical records-linkage system. International Journal of Epidemiology. 2012;41:1614–1624. doi: 10.1093/ije/dys195. [DOI] [PMC free article] [PubMed] [Google Scholar]
- 30.Herasevich V, Pickering BW, Dong Y, et al. Informatics infrastructure for syndrome surveillance, decision support, reporting, and modeling of critical illness. Mayo Clin Proc. 2010;85:247–254. doi: 10.4065/mcp.2009.0479. [DOI] [PMC free article] [PubMed] [Google Scholar]
- 31.St Sauver JL, Grossardt BR, Yawn BP, et al. Use of a Medical Records Linkage System to Enumerate a Dynamic Population Over Time: The Rochester Epidemiology Project. American Journal of Epidemiology. 2011;173:1059–1068. doi: 10.1093/aje/kwq482. [DOI] [PMC free article] [PubMed] [Google Scholar]
- 32.Herasevich V, Yilmaz M, Khan H, et al. Rule base system for identification of patients with specific critical care syndromes: The “sniffer” for acute lung injury. AMIA Annu Symp Proc. 2007:972. [PubMed] [Google Scholar]
- 33.Kane-Gill SL, Sileanu FE, Murugan R, et al. Risk Factors for Acute Kidney Injury in Older Adults With Critical Illness: A Retrospective Cohort Study. American Journal of Kidney Diseases. 2014 doi: 10.1053/j.ajkd.2014.10.018. [DOI] [PMC free article] [PubMed] [Google Scholar]
Associated Data
This section collects any data citations, data availability statements, or supplementary materials included in this article.