

Quantitative analysis and modeling of vesicle diffusion shows that polarized cell growth rates are sustained by actin-based vesicle clustering at the tip.
Abstract
F-actin has been shown to be essential for tip growth in an array of plant models, including Physcomitrella patens. One hypothesis is that diffusion can transport secretory vesicles, while actin plays a regulatory role during secretion. Alternatively, it is possible that actin-based transport is necessary to overcome vesicle transport limitations to sustain secretion. Therefore, a quantitative analysis of diffusion, secretion kinetics, and cell geometry is necessary to clarify the role of actin in polarized growth. Using fluorescence recovery after photobleaching analysis, we first show that secretory vesicles move toward and accumulate at the tip in an actin-dependent manner. We then depolymerized F-actin to decouple vesicle diffusion from actin-mediated transport and measured the diffusion coefficient and concentration of vesicles. Using these values, we constructed a theoretical diffusion-based model for growth, demonstrating that with fast-enough vesicle fusion kinetics, diffusion could support normal cell growth rates. We further refined our model to explore how experimentally extrapolated vesicle fusion kinetics and the size of the secretion zone limit diffusion-based growth. This model predicts that diffusion-mediated growth is dependent on the size of the region of exocytosis at the tip and that diffusion-based growth would be significantly slower than normal cell growth. To further explore the size of the secretion zone, we used a cell wall degradation enzyme cocktail and determined that the secretion zone is smaller than 6 μm in diameter at the tip. Taken together, our results highlight the requirement for active transport in polarized growth and provide important insight into vesicle secretion during tip growth.
The precise regulation of exocytosis is essential to maintain polarized cell growth in a variety of plant systems. Polarized cell growth, or tip growth, is a process by which a cell grows in a unidirectional manner and is found ubiquitously throughout the plant kingdom (Hepler et al., 2001). Pollen tubes, root hairs, and moss protonemal cells all have emerged as models for this process (Hepler et al., 2001; Menand et al., 2007). To achieve polar expansion in the presence of uniform turgor pressure, these cells must spatially regulate the extensibility of the cell wall (Winship et al., 2010; Hepler et al., 2013). This is achieved through the polarized exocytosis of various cell wall materials and loosening enzymes (Rojas et al., 2011).
How plant cells establish spatially directed exocytosis during polarized growth has been the focus of a number of studies in the past decade (Cárdenas et al., 2008; McKenna et al., 2009; Moscatelli et al., 2012). Many of these efforts have heavily implicated the cytoskeleton as a key player in exocytosis. Evidence suggests that myosin XI transports vesicles containing cell wall materials via F-actin to the growing tip of the cell (Vidali et al., 2010; Madison and Nebenführ, 2013; Madison et al., 2015). In pollen tubes, a cortical actin fringe several micrometers behind the cell tip has been shown to be essential in polarized growth (Vidali et al., 2001, 2009; Lovy-Wheeler et al., 2005). Rounds et al. (2014) have shown that the presence of this fringe is necessary for the focusing of apical pectin deposition. However, work with FM dyes supports the hypothesis that exocytosis happens along an annulus behind the cell tip (Bove et al., 2008; Zonia and Munnik, 2008). In moss protonemal cells, the actin cytoskeleton concentrates at the extreme cell apex (Vidali et al., 2009). At this extreme apex, vesicle fluctuations have been shown to predict F-actin fluctuations (Furt et al., 2013). Furthermore, myosin XI, which is essential for tip growth (Vidali et al., 2010), also can anticipate actin fluctuations (Furt et al., 2013). ROP GTPases, which have been thought to initiate tip growth (Lee and Yang, 2008), have been shown to influence apical F-actin dynamics and concentrations (Burkart et al., 2015).
Significant work has been done to probe the molecular players involved in cytoskeleton-mediated exocytosis; however, there is a growing need to demonstrate a mechanistic link between F-actin and polarized growth (Rounds and Bezanilla, 2013). Although the actin fringe has been modeled in pollen tubes (Sanati Nezhad et al., 2014), to the best of our knowledge, the role of apical F-actin in other, slower polar growth systems has yet to be examined. What are the physical limitations an active transport system like the actin cytoskeleton must overcome to facilitate vesicle exocytosis and sustain polarized growth? Vesicle concentrations and diffusion coefficients, exocytic reaction kinetics, cell growth rates, and the size of the active region of exocytosis all place specific limitations on the actin-based transport system. Quantifying these fundamental requirements will provide key insight into understanding the requirement for transport in this system.
Without a quantitative assessment of the potential physical limitations outlined above, we can hypothesize several functions for the actin cytoskeleton. For example, it could serve as a means to overcome slow vesicle diffusion limitations to drive exocytosis. The actin cytoskeleton also could function to surpass slow reaction kinetics associated with vesicle fusion events on the plasma membrane. It is also possible that exocytosis is confined to a relatively small area on the plasma membrane; the actin cytoskeleton could then function as a means to focus vesicles to this small exotic zone. Finally, it remains a possibility that F-actin active transport is not required to sustain polarized growth.
To better understand how F-actin influences vesicle transport, we fluorescently labeled the v-SNARE VAMP72 (Sanderfoot, 2007) in the moss Physcomitrella patens (Vidali and Bezanilla, 2012). P. patens was chosen here because it does not exhibit large organelle cytoplasmic streaming (Shimmen, 2007), which can complicate the analysis of vesicle transport (Furt et al., 2012). Instead, P. patens only exhibits two modes of vesicle transport, namely diffusion and active transport along the cytoskeleton. We visualized these modes of transport and performed fluorescence recovery after photobleaching (FRAP; McNally, 2008; Lorén et al., 2015) during polarized growth. To probe the utility of actin-mediated active transport, we used the small molecule inhibitor latrunculin B to depolymerize actin and uncouple vesicle diffusion from active transport. With FRAP as well as number and brightness analyses (Digman et al., 2008; Lorén et al., 2015; Kingsley et al., 2017), we measured vesicle diffusion rates and concentrations, respectively. We then developed a diffusion-limited analytical model and numerically solved it using these parameters as well as previously measured cellular growth rates (Furt et al., 2013). Using this model, we quantitatively explored the limiting factors associated with cell growth and used enzymatic digestions of the cell wall to further constrain the model.
RESULTS
Depolymerization of Actin Stops Cell Growth in Minutes
Previous evidence in plants suggests that actin filaments are essential for polarized growth (Vidali et al., 2001). It remains unclear, however, if removal of the actin cytoskeleton immediately abolishes growth or if some growth, supported by diffusion, continues to happen once actin is removed. To address this question, we treated growing protonemal cells with the actin monomer sequestering agent latrunculin B to depolymerize the actin filaments (Vidali et al., 2001, 2009). To visualize vesicle accumulation, we used a cell line expressing 3mEGFP-VAMP72 (Furt et al., 2013). Following latrunculin B treatment, we could not detect any tip growth (Fig. 1A), which is consistent with previous work (Vidali et al., 2001, 2009). Treatment also abolished the tip localization of VAMP72 vesicles (Fig. 1B) and produced an intensity gradient that decreased toward the cell tip (Fig. 1C). Vehicle-treated controls grew at 5.5 ± 0.4 nm s−1 which is within the range of previously measured growth rates (Furt et al., 2013). Since latrunculin B arrests growth, we concluded that cell growth could not continue without F-actin.
Figure 1.

Latrunculin B stops growth. A, Representative kymographic analysis of caulonemal cells expressing 3mEGFP-VAMP72 vesicles before (top) and after (bottom) vehicle (left) or 5 μm latrunculin B (right) treatment. The black vertical arrow indicates the vertical time axis. The horizontal arrow denotes treatment time. White space between top and bottom images represents the approximate time necessary to apply the treatment to the culture. The dotted white box indicates the region for the line scan. B, Representative cells before (top) and after (bottom) latrunculin B treatment. Bar = 5 μm. C, Measured intensity gradient for latrunculin B-treated cells. Measurement was taken from the white dotted box in B for each measured cell. Error bars indicate se, and n = 4.
Vesicles Exhibit Active Transport at the Cell Tip
Since the depolymerization of F-actin immediately blocks growth, we sought to determine if actin plays a role in vesicle transport at the cell tip. To this aim, we performed FRAP experiments on a cell line expressing the vesicle marker 3mCherry-VAMP72 (Furt et al., 2013) at the cell tip (Fig. 2A) and a region distal to the tip, subsequently referred to as the shank. We chose this cell line because we found that 3mCherry is more sensitive to photobleaching than 3mEGFP. To better understand the differences in molecular flux at the tip and the shank, fluorescence recoveries were corrected for acquisition photobleaching (Supplemental Fig. S1) and normalized to the mean prebleach shank intensity. Since VAMP72 vesicles localize to the cell tip (Fig. 2B; Supplemental Fig. S2), likely through myosin binding to actin, we expected a reduction in the recovery after photobleaching of vesicles at the cell tip. Instead, VAMP72 vesicles exhibited a faster exchange of particles at the tip than the shank (Fig. 2A), demonstrating that the accumulation of vesicles at the cell tip is not simply due to static capture. This indicates that there is a stream of active transport at the cell tip that is faster than the recovery at the shank.
Figure 2.

VAMP72 vesicle dynamics during polarized growth. A, Fluorescence recovery of 3mCherry-VAMP72 vesicles at the cell shank (green circles) and cell tip (black squares); n = 8 and 10, respectively (error bars indicate sd). B, Cropped and framed averaged photobleaching region of interest (ROI) at the cell tip for 3mCherry-VAMP72 vesicles (top) and simulation (bottom); n = 8 and 50, respectively. Image intensity is denoted with the rainbow lookup table (Δt1 = 0.7–1.6 s and Δt2 = 20–40 s). White arrows mark the direction of recovery (left). The white circle and arrow denote how the perimeter of the ROI was measured (right). C and D, Intensity profiles of 3mCherry-VAMP72 along the ROI perimeter at the cell tip during the time intervals Δt1 = 0.7 to 1.6 s (C) and Δt2 = 20 to 40 s (D); n = 10, and error bars indicate se.
To better understand the directionality of this fast active transport, we recorded the movement of VAMP72 vesicles after photobleaching. After averaging several fluorescent recoveries, we found that these vesicles moved along the cell cortex toward the tip of the cell (Fig. 2B; Supplemental Movie S1). We further quantified this directional recovery by measuring the fluorescence intensity along the perimeter of the photobleaching region of interest (Fig. 2B). At early times (Δt1 = 0.7–1.6 s) after photobleaching, we found that the maximum fluorescence intensity was cortical but moving toward the cell tip (Fig. 2, B and C; Supplemental Movie S1). Finally, at longer time intervals (Δt2 = 20–40 s), VAMP72 vesicles became localized to the cell tip (Fig. 2, B and D; Supplemental Movie S1). Since these vesicles exhibited an increased flux at the cell tip when compared with the shank, and because the vesicles recovered along the cell cortex toward the tip, we conclude that active transport drives a significant portion of the movement of VAMP72-labeled vesicles.
Vesicles Undergo Diffusion When Uncoupled from Actin
To determine if active vesicle transport is actin dependent, and to quantify vesicle diffusion, we uncoupled vesicle diffusion from actin-mediated transport with the actin-depolymerizing agent latrunculin. This treatment abolishes the tip localization of VAMP72 vesicles (Fig. 1; Supplemental Fig. S2), suggesting that untreated VAMP72-labeled vesicles exhibit active transport in an actin-dependent manner. To accurately quantify vesicle diffusion, we performed photobleaching at the cell tip and shank and, as done in the previous section, performed corrections on the recovery curves to remove the effects of acquisition photobleaching and reversible photoswitching (Supplemental Fig. S1). Fluorescence recovery curves for the two specific locations were normalized to their respective prebleach intensities. Following photobleaching, the cell tip exhibited a reduced fluorescence recovery rate when compared with the cell shank (Fig. 3A). Because photobleaching at the cell tip was close to the cell membrane, we expected the diffusion-based recovery at the tip to be limited by this boundary and, as a consequence, slower. This is not the case at the cell shank, where fluorescence recovery can happen from all directions. To accurately determine the diffusion coefficient, we used a particle-based computational model of FRAP that incorporates the properties of our confocal imaging system, the three-dimensional moss cell shape, and the thermal fluctuations of the fluorophore (Kingsley et al., 2017).
Figure 3.

Latrunculin B-treated VAMP72 vesicle dynamics. A, Fluorescence recovery of latrunculin B-treated 3mCherry-VAMP72 vesicles at the cell shank (green circles) and cell tip (black squares), with corresponding best-fit simulation results (red lines); n = 6 and 8, respectively (error bars indicate sd). B, Cropped and framed averaged photobleaching ROI at the cell tip for latrunculin B-treated 3mCherry-VAMP72 vesicles (top) and simulation (bottom); n = 8 and 50, respectively. Image intensity is denoted with the rainbow lookup table (Δt1 = 0.8–2.5 s and Δt2 = 20–40 s). The white circle and arrow denote how the perimeter of the ROI was measured. C to F, Intensity profiles of latrunculin B-treated VAMP72 along the ROI perimeter at the cell tip during the time intervals Δt1 = 0.8 to 2.5 s (C) and Δt2 = 20 to 40 s (D), with corresponding simulations in red (E and F); n = 8, and error bars indicate se.
To reduce the number of free parameters in this FRAP model, we experimentally measured the point-spread function of our confocal system and the bleaching width of the confocal laser (Supplemental Fig. S3). The FRAP model recovery curves also were corrected for reversible photobleaching to better match the experimental results (see “Materials and Methods”). The two remaining open parameters in our model were the diffusion coefficient and the photobleaching proportionality constant, which relates laser intensity to the number of fluorophores bleached. After generating simulations for an array of these two parameters, we employed a fitting routine to determine the best-fit parameters (see “Materials and Methods”). This analysis showed that a single diffusion coefficient (D = 0.29 ± 0.14 μm2 s−1) was sufficient to account for the fluorescence recovery seen both at the tip and the shank.
To further demonstrate that our best-fit particle-based simulation results accurately represent the motion of VAPM72 vesicles in vivo, we compared the directional fluorescence recovery of the best-fit particle-based simulation (without the reversibly photobleached fraction) to the experimental fluorescence recovery. At early times of fluorescence recovery, an intensity gradient was present within the photobleached regions for both the experiments and simulations (Fig. 3B; Supplemental Movie S2) following limited volume corrections (Supplemental Fig. S4). The gradient decayed toward the cell tip (Fig. 3C) and flattened at long times (Fig. 3D), which suggests that the cell boundary restricts the spatial recovery of VAMP72 vesicles. This gradient also was observed in our simulations of FRAP at the cell tip (Fig. 3, E and F) but not at the cell shank (Supplemental Fig. S5). This indicates that vesicle recovery at the cell tip is influenced by its position next to the apical plasma membrane, such that material cannot flow in or exchange in all directions. Importantly, this recovery closely matches a diffusion model (Fig. 3, E and F), further supporting our claim that VAMP72 vesicles exhibit diffusion.
Analytical Modeling Demonstrates That Cell Growth Is Not Entirely Diffusion Limited
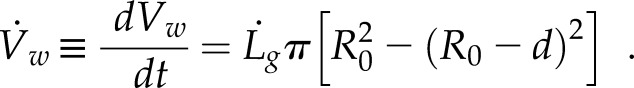
To determine if diffusion alone can supply enough vesicles to the growing cell edge to sustain polarized growth in P. patens, we initially created a simple analytical model of diffusion-based cell growth in the absence of the actin cytoskeleton. To build this model, we first determined the number of vesicle fusion events per second, ϕ, needed to support normal cell growth (Bove et al., 2008). We assumed that P. patens is cylindrical in shape at the shank, with an outer cell radius of R0 ∼ 6 μm and a wall thickness of d ∼ 250 nm (Martin et al., 2009). As the cell grows, the wall maintains its outer radius R0 and thickness d and elongates at a rate of  . The wall volume per second,
  , needed to sustain this growth can be written as
 |
Assuming that the cell wall materials within a vesicle do not change in volume once they are incorporated into the wall, the number of vesicle fusion events needed to support growth can be written as
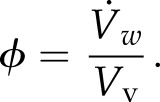 |
Here, ϕ is the number of vesicle fusion events as introduced above and  is the volume of a vesicle. This assumption is supported by electron micrographs in pollen tubes that show that the electron densities of vesicles and the cell wall are similar (Lancelle and Hepler, 1992; Derksen et al., 1995). Assuming that secretory vesicles are spherical in shape with a radius of 40 nm (Lancelle and Hepler, 1992), one can calculate that Vv ∼ 2.68 × 10⁻⁴ μm3 and
 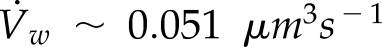 ; therefore, the vesicle fusion rate for a growing cell is ϕ ∼ 189 vesicles s−1.
To relate observed vesicle diffusion to this calculated vesicle fusion rate, we modeled the growing cell as a cylinder with an absorbable boundary at one face of the cylinder. This model is equivalent in principle to latrunculin B-treated cells, in which diffusion alone must support growth. Here, the cylinder is oriented so that the tip is positioned at x = 0 and the back end of the cylinder is at x = L (Fig. 4, A and B). The cylinder contains a population of vesicles with a spatial concentration that can be written as c(x,t). In wild-type P. patens polarized growth, we determined that large organelles such as chloroplasts and the vacuole remain at a distance of L = 16 ± 1.4 μm behind the growing tip. The presence of these large organelles allows us to make two important simplifications. First, the constant distance from these organelles to the tip makes it reasonable to model the growing tip of the cell as a cylinder of constant size. Second, we assume that these organelles act as a reflective boundary (at x = L) and block the flux of vesicles through this edge, c′(L,t) = 0.
Figure 4.

Differential equation model of diffusive cell growth with idealized geometry. A, Diagram of the cylindrical approximation of the moss geometry. Green circles represent vesicles. Red boundaries are reflective boundaries, and the green boundary is perfectly absorbable. B, Representative bright-field image of a growing cell with a cylindrical approximation of the analytical model in red. Bar = 5 μm. C, Simulated 3mEGFP-VAMP72 vesicles with cL = 10 vesicles μm−3. Bar = 4 μm. D, Normalized concentration profile for the solution of the analytical model (Eqs. 3–7). E and F, Growth rates for the analytical model (Eqs. 3–7) solved for cL = 10 vesicles μm−3 (E) and cL = 100 vesicles μm−3 (F). Model error bars represent predicted growth rates within 95% confidence intervals, with D = 0.15 and D = 0.43 μm2 s−1, respectively. Wild-type (wt) error bars represent 95% confidence intervals, n = 4.
At the opposite edge of the cylinder (at x = 0), we assume perfect vesicle absorbability (e.g. infinite on-rate), simulating a possible maximum limit for growth rate. This assumption of infinite on-rate (or presumably unlimited supply of receptors) uncouples vesicle diffusion limitations from receptor-mediated vesicle-membrane fusion limitations by assuming that vesicles instantly fuse upon contact with this face of the cylinder. This is represented by the vesicle concentration at the extreme edge being zero [i.e. c(0,t) = 0]. To model vesicle production, we assume a spatially homogenous production rate Q. We impose this uniform production rate because of the almost uniform distribution of Golgi bodies in the cell (Furt et al., 2012). We can then express the concentration of vesicles c(x,t) as a time-dependent diffusion equation with a constant production rate Q
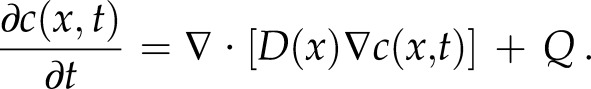 |
Here,  represents the vesicle concentration gradient. At steady-state growth, we can take
 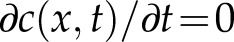 . Assuming homogenous diffusion (D = constant), the radial symmetry of the cell lets us define the concentration throughout the cell as dependent only on the linear position x. This produces a general solution for c(x) of the form
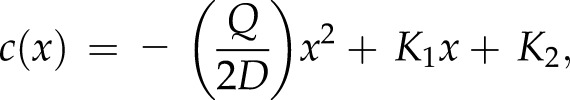 |
where K1 and K2 are constants determined by the boundary conditions. Solving for the two boundary conditions [c(0) = 0 and c′(L) = 0] produces a profile dependent on the vesicle production rate Q such that
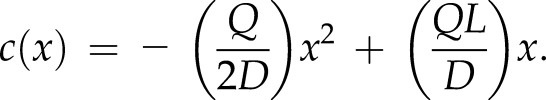 |
There is an additional constraint that fixes the value of Q; this steady-state condition requires that the concentration of vesicles at the cell shank c(L) is equal to a predetermined concentration cL. This constraint produces an expression for Q, namely
 |
During steady-state growth, the vesicle production rate Q must match the number of vesicle fusion events ϕ such that
Here, R is the radius of the growing cylinder. This expression allows us to determine the number of vesicle fusion events for any given cL, D, R, and L, and the values used for these four parameters are listed in Table I. Diffusion coefficient, D, was measured as described in the previous section with FRAP analysis (Kingsley et al., 2017). To determine cL, we used our confocal particle-based simulation (Kingsley et al., 2017) to produce a range of potential concentrations and found that resolving individual particles becomes impossible at concentrations above 10 vesicles μm−3 (Fig. 4C). Since we cannot resolve individual particles experimentally, we let this be the lower bound estimate for cL. Finally, we can relate the vesicle fusion rate predicted by our analytical model in Equation 7 to the observed vesicle fusion rate calculated using Equation 2.
Table I. Analytical model parameters.
| Parameter | Value | Source |
|---|---|---|
| Diffusion coefficient, D | 0.29 ± 0.14 μm2 s−1 | Measured with FRAP |
| Cylinder length, L | 16 ± 1.4 μm | Measured from microscope images (n = 8) |
| Cylinder radius, R | 6 ± 0.2 μm | Measured from microscope images (n = 8) |
| Concentration at c(L), cL | 10 to 100 vesicles μm−3 | Estimated from Figure 1B |
For the range of possible values of cL, the model predicts two consistent effects that influence cell growth. First, there is a parabolic reduction in vesicle concentration from the shank out toward the growing tip (Fig. 4D). Additionally, we find a linear relationship between cell growth rates and cL. At the lower bound vesicle concentration cL = 10 vesicles μm−3, the predicted vesicle fusion rate is ϕ = 41 ± 20 vesicles s−1 and the corresponding cell growth rate is 1.2 ± 0.6 nm s−1 (Fig. 4, E and F). At the upper bound vesicle concentration cL = 100 vesicles μm−3 ϕ = 410 ± 201 vesicles s−1 and the growth rate is 12 ± 6 nm s−1. The confidence bounds for these estimates are the result of lower and upper bound estimates for the vesicle diffusion coefficient (see “Materials and Methods”). This growth rate indicates that diffusion cannot sustain cell growth at our estimated lower bound vesicle concentrations (Fig. 4E) but can easily support growth at our upper bound estimate (Fig. 4F).
This means that diffusion limitations at the growing cell edge may not serve as the only reason why these cells stop growing. Interestingly, this implies that, under idealized vesicle fusion and vesicle concentrations, diffusion could support cell growth. Additional factors such as membrane-vesicle fusion kinetics, small active exocytic regions, and three-dimensional cell geometry also may prevent latrunculin B-treated cells from growing.
Vesicle Concentrations Yield an Estimate of Vesicle Fusion Kinetics
To explore the additional factors that may limit cell growth and better determine the concentration of VAMP72-labeled vesicles during latrunculin B treatment, we used numbers and brightness (N&B) analysis (Digman et al., 2008). In N&B analysis, the mean and variance of a fluorophore’s intensity fluctuations are used to determine the concentration of molecules in solution. The foundation of this analysis is the assumption that molecule number fluctuations in a given volume are Poisson distributed, which holds true for a freely diffusing population of vesicles (Digman et al., 2008). Since the mean and variance of a Poisson distribution are equal, it is possible to algebraically solve for the brightness of a fluorophore even in the presence of detector shot noise (Digman et al., 2008). Using this analysis, we found that the vesicle concentrations of latrunculin B-treated cells were 39 ± 6 and 38 ± 2 vesicles μm−3 at the tip and shank, respectively (for details, see “Materials and Methods”). No statistically significant differences in concentrations were found at the tip and shank (P = 0.8349; n = 6). At these vesicle concentrations, the analytical model predicts growth at 5 ± 2.9 nm s−1, similar to normal growth.
Since diffusion-based growth with ideal vesicle fusion kinetics is enough to support cell growth, we sought to estimate the true kinetics of vesicle membrane fusion during exocytosis. Docking and fusion of exocytic vesicles is a multistep process mediated by protein complexes such as Exocyst (Kulich et al., 2010; Bloch et al., 2016) and the SNARE complex (Lipka et al., 2007; El Kasmi et al., 2013), which we simplify by assuming that VAMP72 vesicles interact with one type of receptor on the plasma membrane at the cell tip. We also assume that this type of receptor has one reaction rate and facilitates the integration of vesicles into the plasma membrane. This allows us to write the flux equation through the plasma membrane as follows (Phillips, 2013)
Here, m is the total number of receptors on the plasma membrane at the cell tip, Kon is the binding reaction rate between vesicles and the receptors, and ϕ is the measured number of vesicle fusion events per second (as defined previously with Eq. 2). As a first approximation, and for the most parsimonious case, we assume that mKon is constant during growth. Since the intensity of vesicles at the very cell tip, c(0), for growing cells is roughly 2-fold higher than c(0) for latrunculin B-treated cells (Supplemental Fig. S2), we can solve Equation 8 to get mKon ∼ 2.5 s−1 μm−3.
The Refined Diffusion Model Illustrates the Requirement for F-Actin in Polarized Growth
With relevant vesicle concentrations and fusion kinetics known, we then built a more comprehensive model to determine the physiological conditions under which diffusion could or could not sustain cell growth and developed an insight into the limiting factors in polarized growth from a vesicle-trafficking perspective. To this end, we created a diffusion-based growth model without the actin cytoskeleton. To incorporate a more realistic geometry of the growing moss cell tip, we used the finite element analysis modeling software Comsol Multiphysics (Comsol) to solve Equation 3 within the moss geometry for biologically relevant boundary conditions. We used impermeable (reflective) boundary conditions for most of the plasma membrane, except for the active region of exocytosis at the cell tip, where the m receptors were concentrated. In this region, we used Equation 8 as a boundary condition to simulate diffusion-mediated exocytosis. Since the size of the zone of vesicle exocytosis is unknown, we simulated four different discrete exocytic zones, centered at the cell apex, with diameters Ω = 1, 2, 4, and 10 μm (Fig. 5A). To satisfy Equation 8, each of the four simulated exocytic zones maintained the same total number of receptors, m, but at different densities. Although it has been shown previously that vesicle exocytic zones may have a monotonically increasing mKon focused at the tip (Campàs and Mahadevan, 2009), we simulate Ω with a constant mKon to establish the effective length scales for the exocytic zone.
Figure 5.

Differential equation model of diffusive growth with moss cell geometry. A, Plasma membrane with the active area of exocytosis marked in red. Black lines indicate the reflective boundary. Dashed lines indicate the exocytosis region diameter Ω. B, Model-predicted steady-state vesicle concentration profile necessary to sustain wild-type cell growth. The color table indicates concentration gradients, with high concentrations as warm colors and low concentrations as cool colors. C and D, Normalized (C) and unnormalized (D) concentration profiles from B necessary to sustain wild-type cell growth. E, Comsol model-predicted growth rates for experimentally measured shank concentrations for Ω = 10, 4, 2, and 1 μm from left to right. Model error bars represent predicted growth rates for D = 0.15 and D = 0.43 μm2 s−1, respectively. The wild-type (wt) error bar represents se; n = 4.
To achieve growth rates similar to a wild-type cell, our model predicts that a cell growing by diffusion would have to maintain vesicle concentrations at the shank much greater than those observed experimentally. Specifically, these concentrations range between ∼125 and 477 vesicles μm−3 at the cell shank, cL, while our experimentally measured shank concentration is 38 ± 2 vesicles μm−3. Based on the size of the exocytosis zone, we found that these concentrations exhibited different gradients as they approached the cell tip. Large exocytic zones produced concentration gradients that fell slowly as they approached the cell tip, while smaller zones produced concentration gradients that rapidly fell as they approached the cell tip (Fig. 5, B and C). We also found that larger exocytic zones could support cell growth at lower vesicle concentrations than smaller exocytic zones. This means that a cell with larger exocytic zones could grow more quickly than a cell with a smaller exocytic zone if both cells had the same steady-state vesicle concentrations. For large exocytic regions and experimentally measured vesicle concentrations, diffusion alone could lead to cell growth rates slightly slower than 2 nm s−1 (Fig. 5E). Smaller exocytic regions at experimentally relevant vesicle concentrations produced growth rates slower than 1 nm s−1 (Fig. 5E). Although actin could serve other functions associated with growth, our results demonstrate that there is a specific requirement for active transport to sustain cell growth and that this need is dependent on the size of the exocytic zone.
Wall Extensibility Is Weakest at the Cell Tip
In order to constrain our diffusion model with an experimentally relevant secretion size, we examined the material properties of the cell wall. To probe these properties during polarized growth, we used the enzyme cocktail driselase, which enzymatically degrades the wall. When exposed to driselase, we found that the wall of the tip-growing cells would begin to extrude and eventually fail (Fig. 6A). Following treatment, extrusion and failure were observed within minutes. We found that the average size of the extruded region was approximately 5.8 ± 0.5 μm in diameter (Fig. 6B), and its center was within 3 μm from the center of the cell (Fig. 6C). Assuming that degradation happens uniformly, this indicates that the cell wall is most extensible at the cell tip. Due to the fact that exocytosis mediates wall extensibility, we inferred that exocytosis likely takes place within a region smaller than 5.8 μm in diameter. This upper limit illustrates that, without F-actin, diffusion-based cell growth could never achieve growth rates greater than 2 nm s−1 (Fig. 6, D and E), which is significantly less than the 5.5 ± 0.4 nm s−1 observed experimentally.
Figure 6.

Driselase reveals cell wall extensibility. A, Representative time series of cell wall rupture following exposure to driselase. The cell perimeter is highlighted in blue. Green circles mark the end points of the rupture arc length. Black circles mark the cell tip. Red circles show the maximally deflected rupture position. Red stars show the projected rupture position. Dashed lines indicate the rupture diameter Ω. Bar = 5 μm. B, Cumulative frequency of rupture diameter Ω. The inset displays a box plot of the rupture diameter. The median is marked in red, the quartiles are marked in blue, and the minimum and maximum are marked in black. The red dot is the mean. C, Location of cell rupture along the edge. Blue dots indicate the cell boundary. Red stars indicate the region of rupture (n = 17). D, Comsol model-predicted concentration profile, necessary to sustain wild-type cell growth, for Ω = 5.8 μm. E, Comsol model-predicted growth rate for experimentally measured shank concentrations and Ω = 5.8 μm, compared with the wild-type growth rate. Model error bars represent predicted growth rates for D = 0.15 and D = 0.43 μm2 s−1, respectively. The wild-type (wt) error bar represents se; n = 4.
DISCUSSION AND CONCLUSION
This work demonstrates that, in moss protonemata, actin drives vesicle transport and shows quantitatively that this transport is necessary to sustain normal cell growth. Specifically, the experimentally measured vesicle diffusion coefficient, vesicle concentrations, membrane reaction kinetics, and size of the exocytosis region collectively impose enough limitations on diffusion-based growth to require an active transport system in polarized secretion (Fig. 7).
Figure 7.

F-actin must overcome the limiting factors in polarized cell growth. A, Illustration of the limiting factors in cell growth. Without F-actin, our measured vesicle diffusion, vesicle concentrations, reaction kinetics (mKon), and active secretion zone size would result in significantly slower polarized growth. B, With F-actin, the cell can overcome these measured limitations and sustain cell growth.
While it is well known that F-actin is necessary for polarized growth, we showed here that latrunculin B treatments halt tip growth within 2 min, indicating an immediate reliance on actin. We then showed with FRAP that VAMP72-labeled vesicles are transported cortically to the cell apex in an actin-dependent manner. Nevertheless, this FRAP analysis is limited in that it does not have the spatiotemporal resolution to infer additional modes of vesicle dynamics, such as transport to the plasma membrane and/or endocytic vesicle resupply.
Depolymerizing the actin cytoskeleton with latrunculin B reduced the number of modes of vesicle dynamics and allowed us to use FRAP to measure the vesicle diffusion coefficient (∼0.29 μm2 s−1). While we assumed that the VAMP72 fluorescent marker exclusively labeled secretory vesicles, it remains a possibility that the marker could have labeled a small fraction of the Golgi or endoplasmic reticulum. However, our N&B analysis shows that the vast majority of pixels in the images have a brightness distribution consistent with the marker labeling a single species (Supplemental Fig. S6). In addition, fluorescence labeling of the endoplasmic reticulum and Golgi (Furt et al., 2012) did not match the fluorescence intensity distribution found with VAMP72. Furthermore, the vesicle diffusion coefficient we measured is in agreement with previously measured pollen tube vesicle diffusion coefficients (Bove et al., 2008; Kroeger et al., 2009) and measurements of the viscosity of the moss cytoplasm (Kingsley et al., 2017).
Our quantitative estimate of the vesicle diffusion coefficient, the number of vesicles (through N&B analysis of VAMP72), and the kinetics of vesicle fusion (mKon) allowed us to build a model to describe diffusion-based growth with relevant parameters from moss. While the variability in number of VAMP72 molecules on a vesicle can contribute to the observed intensity fluctuations, we considered this effect to be negligible, since our measured concentration of vesicles is in agreement with electron microscopy estimates (McCauley and Hepler, 1992). We used this concentration to solve the flux equation at the cell tip and determined an estimate for the kinetics of vesicle fusion, mKon. To explore how the reaction kinetics observed during normal cell growth limit diffusion-based cell growth, we assumed that mKon is constant and independent of the presence of F-actin. With these parameters used as inputs, we built and solved a comprehensive model of diffusion-based cell growth in a realistic moss geometry. It is important to note that this model is a theoretical proof used to illustrate limitations that highlight the importance of F-actin and is not expected to match the physiological conditions in latrunculin B-treated cells. Nevertheless, our results predict that diffusion-based transport is slower than normal cell growth and heavily dependent on the size of the active region of exocytosis.
Finally, with driselase treatments, we found that the effective length scale for the region of greatest extensibility (maximum secretion) was on the order of a few micrometers and located at the cell tip. This analysis holds as long the cell wall extruded because of an increased extensibility and not because of increased stresses resulting from the intrinsic geometry of the cell. Based on the shape of the cell wall, and on the assumption that the cell wall is a thin sheet, one can show that the maximum stresses on the cell wall are not at the regions of rupture (Campàs and Mahadevan, 2009). For thin-walled shells under uniform pressure, it has been shown that the curvature of the cell wall is inversely proportional to stress (Campàs and Mahadevan, 2009). Since the shank of the cell is less curved than the tip, greater stresses are predicted at the shank; therefore, the observed cell rupture is most likely a result of increased extensibility at the tip. Additionally, these measurements for the size of the exocytic zone are consistent with the localization of myosin XI at the cell tip (Vidali et al., 2010).
Although we built a tip-growth model that quantitatively highlights the necessity for an active transport mechanism in polarized growth, we cannot rule out the possibility that other factors could limit polarized growth. For example, the F-actin could be necessary to maintain the active region of exocytosis. Specifically, F-actin could facilitate the transport and polarization of the receptors required in vesicle fusion. However, elucidating such potential limitations is left for future work. Importantly, we have shown and quantified specific reasons why active transport is necessary in polarized growth. These analyses and modeling approaches are likely to apply to other tip-growth systems in plants such as root hairs and pollen tubes.
MATERIALS AND METHODS
Measuring Moss Growth Rates
The Physcomitrella patens cell line used for measuring growth rates was 3mEGFP-VAMP72 and was transformed as described (Furt et al., 2013); the gene used corresponds to accession number Pp3c4_13580V3.1 (Phytozome 12). Moss samples were cultured using the protocol described previously (Vidali et al., 2007). Microscope samples were prepared as described previously (Furt et al., 2013). To stop growth, liquid medium (PpNO3) with 200 μL of 5 μm latrunculin B was pipetted directly on top of the growing cells. Samples were imaged with a Leica TCS SP5 confocal microscope with a 63× objective and a numerical aperture of 1.4. The argon laser was set to 25% power, and the 488-nm laser line was set to 10% power. The emission bandwidth was set between 499 and 546 nm, and a hybrid detector was used to acquire images. Kymographs and growth rates were constructed using ImageJ.
Experimental FRAP Acquisition, Processing, and Analysis
The moss cell line used for FRAP was a 3mCherry-VAMP72 3mEGFP-myosin XIa double line published previously (Furt et al., 2013). Moss samples were cultured using the protocol described previously (Kingsley et al., 2017). Samples were prepared in QR-43C chambers (Warner Instruments) and perfused with 5 μm latrunculin B. Samples were imaged with a Leica TCS SP5 scanning confocal microscope using the Leica FRAP wizard. A 63× objective with a 1.4 numerical aperture was used. The pinhole was set to 2 airy disks, and the camera zoom was 9. To visualize the 3mCherry-VAMP72 cell line developed previously (Furt et al., 2013), the DPSS 561-nm laser was turned on and the 561-nm laser line was set to 10%. The laser scanning speed was set to 1,400 Hz with bidirectional scanning. The emission bandwidth for 3mCherry was set between 574 and 646 nm. Images were acquired at 256 × 256 pixel resolution with a bit depth of 12 bits.
Following image acquisition, images were subjected to several processing steps. First, experimental TIFF stacks were analyzed with an ImageJ macro that tracked the photobleaching ROI, performed background subtraction, and normalized the mean ROI to prebleach ROI intensities. Image acquisition photobleaching was measured by tracking fluorescence intensity over time while imaging cells at the same sampling rate used during FRAP experiments. This fluorescence time trace was fit to a piece-wise exponential. To correct for acquisition photobleaching and reversible photobleaching, normalized FRAP experimental ROI intensities were divided by this piece-wise exponential (Supplemental Fig. S1). All untreated curves were normalized to the mean prebleach shank intensity to illustrate changes in fluorescence intensity relative to the shank vesicle concentration. Recovery curves from latrunculin B-treated cells, at the tip and shank, were normalized to their mean prebleach intensities at their respective locations.
For spatial analysis of fluorescence recovery, experimental images were analyzed as follows. First, an image-cropping macro was used to extract FRAP ROIs. Cropped ROIs were then normalized to the mean of the prebleach ROIs and averaged across experimental replicates. To correct for the limited accessible volume at the cell tip, we fit an exponential decay to a line scan through the cropped prebleach ROIs. We then divided each ROI during fluorescence recovery by this exponential decay (Supplemental Fig. S5). For more details on experimental FRAP acquisition and processing, see Kingsley et al. (2017).
After ROI processing, we spatially subsampled the ROIs with an angular sector that was rotated 360° about the ROI (Figs. 2B and 3B). To reduce noise, we averaged about the horizontal axis of the ROI; this produced an intensity profile from 0° to 180°.
Measuring Confocal Imaging and FRAP Parameters
Since our particle-based FRAP simulation considers the imaging and photobleaching properties of the confocal microscope, we measured the point spread function (PSF) of our imaging system and the photobleaching properties of 3mCherry-VAMP72 (for details on the simulation inputs and parameter estimates, see Kingsley et al. [2017]). To determine the PSF of our imaging system, we used the PS-Speck Microscope Point Source Kit P7220 (Invitrogen). Bead images (Supplemental Fig. S3, A and B) were deconvolved with a boxcar function equal to the width of the bead. This ensured that the experimental images represented a true point source. The deconvolved PSF was then fit to a three-dimensional squared Gaussian beam (Supplemental Fig. S3, A and B) and used for imaging in the simulation (Kingsley et al., 2017). Based on these fits, we found that the minimum beam width, w0, and the Rayleigh range, zR, were 520 and 500 nm, respectively.
To measure the photobleaching properties of the beam, we fixed cells expressing 3mCherry-VAMP72 with formaldehyde (Fritzsche and Charras, 2015). For fixation, a solution of 100 mm HEPES with 2% (v/v) formaldehyde at pH 7 was perfused into QR-43C chambers (Warner Instruments) for 30 min (Vidali et al., 2007). Fixed cells were subjected to a 1- × 6-μm rectangular photobleaching ROI (Supplemental Fig. S1C, solid white rectangle) and imaged in the same plane as the photobleach. A rectangular ROI was chosen because it is composed of confocal scans of equal length, which permits fluorescence averaging along the long axis of the rectangle. A line scan was created by collapsing a 4- × 8-μm rectangular region including the photobleached ROI (Supplemental Fig. S1B, dashed yellow rectangle) into a one-dimensional profile. After photobleaching, we fit the photobleaching function described (Kingsley et al., 2017) to the line scan. This function characterizes the horizontal line scan of a Gaussian beam as it photobleaches across a fixed distance. As shown previously (Braeckmans et al., 2006), we found that the photobleaching Gaussian beam waist was 2-fold larger than the imaging beam waist at 920 nm. This fit also yielded a photobleaching proportionality constant, which was used as a starting point in fluorescence recovery fitting routines to measure VAMP-72 vesicle diffusion. For details on simulating confocal photobleaching, see Kingsley et al. (2017), and for general use, we developed the Digital Confocal Microscopy Suite (DCMS), which can be downloaded at http://dcms.tuzelgroup.net/.
FRAP Parameter Minimization
To determine the simulation parameters that best characterize the recovery curves for VAMP72 vesicles in latrunculin B-treated cells, a minimization routine was used similar to the one described (Kingsley et al., 2017). Averaged experimental recovery curves Rexp(t) at the tip and shank were characterized into classes  and
and  respectively. Averaged simulation recovery curves were characterized in the same way to produce
  and
and  . These two classes of simulation recovery curves were generated in a two-dimensional parameter space for the parameters D and K, where a range of each parameter was simulated (D = 0.1–0.5 μm2 s−1 and K = 0.01–0.03). Here, D is the diffusion coefficient and K is the bleaching proportionality coefficient. The bleaching proportionality coefficient K measured during fixation was used only as a reference in generating the range for possible values of K. This was done because formaldehyde treatment was found to affect fluorophore bleaching properties at the concentrations used. Unlike the approach from Kingsley et al. (2017), only two parameters were used here because the photobleaching width, w0, was measured with formaldehyde-treated cells. The recovery curve for each parameter pair was stored in a Matlab (MathWorks) data structure. Best-fit simulation parameters for the averaged experimental recovery profiles at the tip,
  , and shank,
  , were found by reducing the sum of squared differences between the curves. Averaged tip and shank recovery curves can be represented as
  and
and  , respectively.
To account for reversible bleaching, we imposed a correction on all simulated recovery curves (Sinnecker et al., 2005; Mueller et al., 2012; Morisaki and McNally, 2014; Kingsley et al., 2017). During intentional photobleaching, some fraction of the bleached molecules, α, convert back to an unbleached state at a given rate, R(t). We used α and R(t) that were measured previously for mCherry. Then, using the relationship devised previously, IM(t) = IFRAP(t) + αR(t)IFLAP(t), we corrected the simulated recovery curves (Mueller et al., 2012). Here, IM(t) is the resultant fluorescence recovery that incorporates reversible bleaching, IFRAP(t) represents the fraction of the fluorescence recovery due to the movement of unbleached fluorophores, and IFLAP(t) represents the motion of the reversibly photobleached molecules. After correction, the averaged simulation tip and shank recoveries become  and
and  , respectively, where the superscript rev indicates reversible bleaching correction. Following this correction, best-fit diffusion coefficients for VAMP72 vesicle experiments were found with the following argument minimization
In this minimization, experimental recoveries at the cell tip and shank were compared with their corresponding simulations to find the parameters Dv, Kt, and Ks. Here, the subscript v denotes VAMP72 vesicles. As shown in Equation 9, the diffusion coefficient Dv was shared between the tip and shank. To improve the argument minimization, two unshared bleaching proportionality coefficients were used at the tip Kt and shank Ks (Kingsley et al., 2017). Although using two unshared bleaching probabilities improves the argument minimization, a shared bleached probability for the tip and shank did not appreciably change the mean value of our measured diffusion coefficient, D = 0.45 ± 0.04 μm s−1. This measurement has confidence intervals that overlap with the intervals of our VAMP72 vesicle diffusion coefficient (D = 0.29 ± 0.14 μm2 s−1) and does not change our conclusions. Similarly, we found that ignoring the reversible photobleaching would have had little impact on our measured diffusion coefficient (D = 0.32 ± 0.18 μm2 s−1).
To determine the error associated with the measured parameters, we used the Monte Carlo simulation as described previously (Motulsky and Christopoulos, 2004; Kingsley et al., 2017). In brief, we generated new experimental and simulated recovery curves via Monte Carlo simulation by sampling from a normal distribution for each condition. The mean and sd of this normal distribution were taken from the mean and sd of each point in the corresponding recovery curve. We then performed the argument minimization described in Equation 9 on the newly generated curves to find new values for the parameters Dv, Kt, and Ks. We then repeated this process to produce a distribution of these parameters. We used two sd values from each distribution to represent the error of our measured parameters, such that Dv = 0.29 ± 0.24 μm2 s−1, Kt = 0.02 ± 0.004, and Ks = 0.0125 ± 0.004.
Comsol Cell Growth Model
Cell growth models were generated using the Comsol Multiphysics (Comsol) modeling software using the three-dimensional transport of dilute species interface with one species. To achieve the steady-state solution of our growth model, the stationary study option was selected. We model the cell as a cylinder of length 10 μm and radius 6 μm, capped by a hemisphere. To simulate the active region of exocytosis, we induced a flux, consistent with Equation 8, through the cell membrane at the cell tip. To simulate the uniform production of vesicles, we imposed a homogenous reaction rate. All simulations were run with a mesh setting of extremely fine in the software. To determine the concentration profiles required to maintain wild-type growth, for the various secretion sizes, we set the production term to match the desired growth rate. We then modified this production term to match the experimentally measured shank concentrations and reported the growth rate. Vesicle concentration profiles were then exported as text files and visualized in Matlab.
Numbers and Brightness Analysis
Moss cultures and microscope samples were prepared as described in measuring moss growth rates. Samples were imaged on a Leica TCS SP5 confocal microscope with a 63× objective with a numerical aperture of 1.4. The argon laser was set to 25% power, and the 488-nm laser line was set to 20% power. The emission bandwidth was set between 499 and 546 nm, and a hybrid detector in photon counting mode was used. Images were scanned at 700 Hz. Six latrunculin B-treated cells were imaged at both the shank and the cell tip within a 6- × 6-μm area and a pixel resolution of 512 × 512. Image stacks were analyzed in Matlab (MathWorks) as described previously (Digman et al., 2008).
To conduct our analysis, we collected confocal image time series at the tip and shank of latrunculin B-treated cells expressing 3mEGFP-VAMP72 (Supplemental Fig. S5A). We assumed that all the VAMP72s on a vesicle contribute equally to the brightness of a vesicle, because the size of a vesicle is consistent with a diffraction-limited spot (Lancelle and Hepler, 1992). To ensure that detector shot noise and VAMP72 vesicle number fluctuations were the primary contributors to intensity fluctuations, all images were acquired with a hybrid detector in photon-counting mode (Dalal et al., 2008; Digman et al., 2008). The intensity fluctuations over time for each pixel were calculated and used to determine the brightness and number of molecules within each pixel (Supplemental Fig. S5B). We then manually filtered the pixels by their apparent brightness and intensity. This was done to remove background pixels and anomalously bright pixels (with brightness value B > 2; Supplemental Fig. S5C). To convert the number of molecules within a given pixel to a concentration, the number of molecules must be divided by the volume of the PSF. To obtain the apparent volume of the PSF, we used our particle-based confocal simulation (Kingsley et al., 2017) with our measured PSF beam width and Rayleigh range as input parameters. These parameters were measured in the same way as 3mCherry (Supplemental Fig. S3). With the particle-based confocal simulation, we then generated an array of vesicle concentrations and used a calibration curve to convert the number of molecules per pixel to the known concentrations (Supplemental Fig. S5D). From the calibration curve, we were able to determine the volume of our PSF given our measured experimental parameters. This PSF volume was within the 20% error of theoretical PSF volumes (Moens et al., 2011).
Driselase Treatment on the Cell Wall
Moss cultures were prepared as described in measuring moss growth rates. Microscope preparations were made on the bottom of 60- × 15-mm petri dishes. Ten milliliters of PPN03 with 1% (w/v) agar was pipetted into the dish. Six 1-mL pipette tips were placed face up onto the dish. Once solidified, the pipette tips were removed and 50 μL of PPN03 with 1% (w/v) agar was pipetted into the newly made holes. A single moss colony was then placed into one of the holes. Then, a 200-μL solution of 8% (w/v) mannitol and 2% (w/v) driselase was pipetted into the hole. The cells were imaged using a Zeiss Axio Observer inverted microscope with a 20× objective. Images were acquired with a Photometrics Cool Snap Camera with the Pixelfly software. Images were taken every 0.1 s.
Images were analyzed with Matlab (MathWorks). Cell edges were detected using the canny edge detection algorithm with the function edge. Rupture points and positions were found manually by selecting points on the image. Polynomial fitting was used to estimate relevant arc lengths.
Supplemental Data
The following supplemental materials are available.
Supplemental Figure S1. Image acquisition photobleaching/reversible photoswitching and correction.
Supplemental Figure S2. Latrunculin B abolishes the tip localization of VAMP72 vesicles.
Supplemental Figure S3. PSF for imaging and photobleaching.
Supplemental Figure S4. VAMP72 vesicle-accessible volume correction.
Supplemental Figure S5. Spatial fluorescence recovery of VAMP72 vesicles at the cell shank.
Supplemental Figure S6. N&B analysis reveals vesicle concentrations.
Supplemental Movie S1. Analysis of the spatial recovery of VAMP72 vesicles at the cell tip.
Supplemental Movie S2. Analysis of the spatial recovery of VAMP72 vesicles at the cell tip of a latrunculin B-treated cell.
Acknowledgments
We thank Leica Microsystems for technical guidance and all members of the Vidali and Tüzel laboratories for helpful discussions, especially Iman Mousavi.
Footnotes
This work was supported by the National Science Foundation CBET 1309933 to E.T. and NSF-MCB 1253444 to L.V. E.T. and L.V. also acknowledge support from Worcester Polytechnic Institute Startup Funds. J.L.K. acknowledges support from the WPI Alden Fellowship.
Articles can be viewed without a subscription.
References
- Bloch D, Pleskot R, Pejchar P, Potocký M, Trpkošová P, Cwiklik L, Vukašinović N, Sternberg H, Yalovsky S, Žárský V (2016) Exocyst SEC3 and phosphoinositides define sites of exocytosis in pollen tube initiation and growth. Plant Physiol 172: 980–1002 [DOI] [PMC free article] [PubMed] [Google Scholar]
- Bove J, Vaillancourt B, Kroeger J, Hepler PK, Wiseman PW, Geitmann A (2008) Magnitude and direction of vesicle dynamics in growing pollen tubes using spatiotemporal image correlation spectroscopy and fluorescence recovery after photobleaching. Plant Physiol 147: 1646–1658 [DOI] [PMC free article] [PubMed] [Google Scholar]
- Braeckmans K, Stubbe BG, Remaut K, Demeester J, De Smedt SC (2006) Anomalous photobleaching in fluorescence recovery after photobleaching measurements due to excitation saturation: a case study for fluorescein. J Biomed Opt 11: 044013. [DOI] [PubMed] [Google Scholar]
- Burkart GM, Baskin TI, Bezanilla M (2015) A family of ROP proteins that suppresses actin dynamics, and is essential for polarized growth and cell adhesion. J Cell Sci 128: 2553–2564 [DOI] [PubMed] [Google Scholar]
- Campàs O, Mahadevan L (2009) Shape and dynamics of tip-growing cells. Curr Biol 19: 2102–2107 [DOI] [PubMed] [Google Scholar]
- Cárdenas L, Lovy-Wheeler A, Kunkel JG, Hepler PK (2008) Pollen tube growth oscillations and intracellular calcium levels are reversibly modulated by actin polymerization. Plant Physiol 146: 1611–1621 [DOI] [PMC free article] [PubMed] [Google Scholar]
- Dalal RB, Digman MA, Horwitz AF, Vetri V, Gratton E (2008) Determination of particle number and brightness using a laser scanning confocal microscope operating in the analog mode. Microsc Res Tech 71: 69–81 [DOI] [PubMed] [Google Scholar]
- Derksen J, Rutten T, Vanamstel T, Dewin A, Doris F, Steer M (1995) Regulation of pollen-tube growth. Acta Bot Neerl 44: 93–119 [Google Scholar]
- Digman MA, Dalal R, Horwitz AF, Gratton E (2008) Mapping the number of molecules and brightness in the laser scanning microscope. Biophys J 94: 2320–2332 [DOI] [PMC free article] [PubMed] [Google Scholar]
- El Kasmi F, Krause C, Hiller U, Stierhof YD, Mayer U, Conner L, Kong L, Reichardt I, Sanderfoot AA, Jürgens G (2013) SNARE complexes of different composition jointly mediate membrane fusion in Arabidopsis cytokinesis. Mol Biol Cell 24: 1593–1601 [DOI] [PMC free article] [PubMed] [Google Scholar]
- Fritzsche M, Charras G (2015) Dissecting protein reaction dynamics in living cells by fluorescence recovery after photobleaching. Nat Protoc 10: 660–680 [DOI] [PubMed] [Google Scholar]
- Furt F, Lemoi K, Tüzel E, Vidali L (2012) Quantitative analysis of organelle distribution and dynamics in Physcomitrella patens protonemal cells. BMC Plant Biol 12: 70. [DOI] [PMC free article] [PubMed] [Google Scholar]
- Furt F, Liu YC, Bibeau JP, Tüzel E, Vidali L (2013) Apical myosin XI anticipates F-actin during polarized growth of Physcomitrella patens cells. Plant J 73: 417–428 [DOI] [PubMed] [Google Scholar]
- Hepler PK, Rounds CM, Winship LJ (2013) Control of cell wall extensibility during pollen tube growth. Mol Plant 6: 998–1017 [DOI] [PMC free article] [PubMed] [Google Scholar]
- Hepler PK, Vidali L, Cheung AY (2001) Polarized cell growth in higher plants. Annu Rev Cell Dev Biol 17: 159–187 [DOI] [PubMed] [Google Scholar]
- Kingsley JL, Bibeau JP, Mousavi SI, Unsal C, Chen Z, Huang X, Vidali L, Tüzel E (2017) Understanding boundary effects and confocal optics enables quantitative FRAP analysis in the confined geometries of animal, plant, and fungal cells. bioRxiv 059220: 10.1101/059220. [DOI] [Google Scholar]
- Kroeger JH, Daher FB, Grant M, Geitmann A (2009) Microfilament orientation constrains vesicle flow and spatial distribution in growing pollen tubes. Biophys J 97: 1822–1831 [DOI] [PMC free article] [PubMed] [Google Scholar]
- Kulich I, Cole R, Drdová E, Cvrcková F, Soukup A, Fowler J, Zárský V (2010) Arabidopsis exocyst subunits SEC8 and EXO70A1 and exocyst interactor ROH1 are involved in the localized deposition of seed coat pectin. New Phytol 188: 615–625 [DOI] [PubMed] [Google Scholar]
- Lancelle SA, Hepler PK (1992) Ultrastructure of freeze-substituted pollen tubes of Lilium longiflorum. Protoplasma 167: 215–230 [Google Scholar]
- Lee YJ, Yang Z (2008) Tip growth: signaling in the apical dome. Curr Opin Plant Biol 11: 662–671 [DOI] [PMC free article] [PubMed] [Google Scholar]
- Lipka V, Kwon C, Panstruga R (2007) SNARE-ware: the role of SNARE-domain proteins in plant biology. Annu Rev Cell Dev Biol 23: 147–174 [DOI] [PubMed] [Google Scholar]
- Lorén N, Hagman J, Jonasson JK, Deschout H, Bernin D, Cella-Zanacchi F, Diaspro A, McNally JG, Ameloot M, Smisdom N, et al. (2015) Fluorescence recovery after photobleaching in material and life sciences: putting theory into practice. Q Rev Biophys 48: 323–387 [DOI] [PubMed] [Google Scholar]
- Lovy-Wheeler A, Wilsen KL, Baskin TI, Hepler PK (2005) Enhanced fixation reveals the apical cortical fringe of actin filaments as a consistent feature of the pollen tube. Planta 221: 95–104 [DOI] [PubMed] [Google Scholar]
- Madison SL, Buchanan ML, Glass JD, McClain TF, Park E, Nebenführ A (2015) Class XI myosins move specific organelles in pollen tubes and are required for normal fertility and pollen tube growth in Arabidopsis. Plant Physiol 169: 1946–1960 [DOI] [PMC free article] [PubMed] [Google Scholar]
- Madison SL, Nebenführ A (2013) Understanding myosin functions in plants: are we there yet? Curr Opin Plant Biol 16: 710–717 [DOI] [PubMed] [Google Scholar]
- Martin A, Lang D, Hanke ST, Mueller SJX, Sarnighausen E, Vervliet-Scheebaum M, Reski R (2009) Targeted gene knockouts reveal overlapping functions of the five Physcomitrella patens FtsZ isoforms in chloroplast division, chloroplast shaping, cell patterning, plant development, and gravity sensing. Mol Plant 2: 1359–1372 [DOI] [PMC free article] [PubMed] [Google Scholar]
- McCauley MM, Hepler PK (1992) Cortical ultrastructure of freeze-substituted protonemata of the moss Funaria hygrometrica. Protoplasma 169: 168–178 [Google Scholar]
- McKenna ST, Kunkel JG, Bosch M, Rounds CM, Vidali L, Winship LJ, Hepler PK (2009) Exocytosis precedes and predicts the increase in growth in oscillating pollen tubes. Plant Cell 21: 3026–3040 [DOI] [PMC free article] [PubMed] [Google Scholar]
- McNally JG. (2008) Quantitative FRAP in analysis of molecular binding dynamics in vivo. Methods Cell Biol 85: 329–351 [DOI] [PubMed] [Google Scholar]
- Menand B, Calder G, Dolan L (2007) Both chloronemal and caulonemal cells expand by tip growth in the moss Physcomitrella patens. J Exp Bot 58: 1843–1849 [DOI] [PubMed] [Google Scholar]
- Moens PDJ, Gratton E, Salvemini IL (2011) Fluorescence correlation spectroscopy, raster image correlation spectroscopy, and number and brightness on a commercial confocal laser scanning microscope with analog detectors (Nikon C1). Microsc Res Tech 74: 377–388 [DOI] [PMC free article] [PubMed] [Google Scholar]
- Morisaki T, McNally JG (2014) Photoswitching-free FRAP analysis with a genetically encoded fluorescent tag. PLoS ONE 9: e107730. [DOI] [PMC free article] [PubMed] [Google Scholar]
- Moscatelli A, Idilli AI, Rodighiero S, Caccianiga M (2012) Inhibition of actin polymerisation by low concentration latrunculin B affects endocytosis and alters exocytosis in shank and tip of tobacco pollen tubes. Plant Biol (Stuttg) 14: 770–782 [DOI] [PubMed] [Google Scholar]
- Motulsky H, Christopoulos A (2004) Fitting models to biological data using linear and nonlinear regression: a practical guide to curve fitting. Oxford University Press, Oxford [Google Scholar]
- Mueller F, Morisaki T, Mazza D, McNally JG (2012) Minimizing the impact of photoswitching of fluorescent proteins on FRAP analysis. Biophys J 102: 1656–1665 [DOI] [PMC free article] [PubMed] [Google Scholar]
- Phillips R. (2013) Physical Biology of the Cell, Ed 2 Garland Science, London [Google Scholar]
- Rojas ER, Hotton S, Dumais J (2011) Chemically mediated mechanical expansion of the pollen tube cell wall. Biophys J 101: 1844–1853 [DOI] [PMC free article] [PubMed] [Google Scholar]
- Rounds CM, Bezanilla M (2013) Growth mechanisms in tip-growing plant cells. Annu Rev Plant Biol 64: 243–265 [DOI] [PubMed] [Google Scholar]
- Rounds CM, Hepler PK, Winship LJ (2014) The apical actin fringe contributes to localized cell wall deposition and polarized growth in the lily pollen tube. Plant Physiol 166: 139–151 [DOI] [PMC free article] [PubMed] [Google Scholar]
- Sanati Nezhad A, Packirisamy M, Geitmann A (2014) Dynamic, high precision targeting of growth modulating agents is able to trigger pollen tube growth reorientation. Plant J 80: 185–195 [DOI] [PubMed] [Google Scholar]
- Sanderfoot A. (2007) Increases in the number of SNARE genes parallels the rise of multicellularity among the green plants. Plant Physiol 144: 6–17 [DOI] [PMC free article] [PubMed] [Google Scholar]
- Shimmen T. (2007) The sliding theory of cytoplasmic streaming: fifty years of progress. J Plant Res 120: 31–43 [DOI] [PubMed] [Google Scholar]
- Sinnecker D, Voigt P, Hellwig N, Schaefer M (2005) Reversible photobleaching of enhanced green fluorescent proteins. Biochemistry 44: 7085–7094 [DOI] [PubMed] [Google Scholar]
- Vidali L, Augustine RC, Kleinman KP, Bezanilla M (2007) Profilin is essential for tip growth in the moss Physcomitrella patens. Plant Cell 19: 3705–3722 [DOI] [PMC free article] [PubMed] [Google Scholar]
- Vidali L, Bezanilla M (2012) Physcomitrella patens: a model for tip cell growth and differentiation. Curr Opin Plant Biol 15: 625–631 [DOI] [PubMed] [Google Scholar]
- Vidali L, Burkart GM, Augustine RC, Kerdavid E, Tüzel E, Bezanilla M (2010) Myosin XI is essential for tip growth in Physcomitrella patens. Plant Cell 22: 1868–1882 [DOI] [PMC free article] [PubMed] [Google Scholar]
- Vidali L, McKenna ST, Hepler PK (2001) Actin polymerization is essential for pollen tube growth. Mol Biol Cell 12: 2534–2545 [DOI] [PMC free article] [PubMed] [Google Scholar]
- Vidali L, Rounds CM, Hepler PK, Bezanilla M (2009) Lifeact-mEGFP reveals a dynamic apical F-actin network in tip growing plant cells. PLoS ONE 4: e5744. [DOI] [PMC free article] [PubMed] [Google Scholar]
- Winship LJ, Obermeyer G, Geitmann A, Hepler PK (2010) Under pressure, cell walls set the pace. Trends Plant Sci 15: 363–369 [DOI] [PMC free article] [PubMed] [Google Scholar]
- Zonia L, Munnik T (2008) Vesicle trafficking dynamics and visualization of zones of exocytosis and endocytosis in tobacco pollen tubes. J Exp Bot 59: 861–873 [DOI] [PubMed] [Google Scholar]