Abstract
Purpose:
To improve patient safety and treatment quality, verification of dose delivery in radiotherapy is desirable. We present a simple, easy-to-implement, open-source method for in vivo planar dosimetry of conformal radiotherapy by electronic portal imaging device (EPID).
Methods:
Correlation ratios, which relate dose in the mid-depth of slab phantoms to transit EPID signal, were determined for multiple phantom thicknesses and field sizes. Off-axis dose is corrected for by means of model-based convolution. We tested efficacy of dose reconstruction through measurements with off-reference values of attenuator thickness, field size, and monitor units. We quantified the dose calculation error in the presence of thickness changes to simulate anatomical or setup variations. An example of dose calculation on patient data is provided.
Results:
With varying phantom thickness, field size, and monitor units, dose reconstruction was almost always within 3% of planned dose. In the presence of thickness changes from planning CT, the dose discrepancy is exaggerated by up to approximately 1.5% for 1 cm changes upstream of the isocenter plane and 4% for 1 cm changes downstream.
Conclusion:
Our novel electronic portal imaging device in vivo dosimetry allows clinically accurate 2-dimensional reconstruction of dose inside a phantom/patient at isocenter depth. Due to its simplicity, commissioning can be performed in a few hours per energy and may be modified to the user’s needs. It may provide useful dose delivery information to detect harmful errors, guide adaptive radiotherapy, and assure quality of treatment.
Keywords: in vivo dosimetry, EPID dosimetry, portal imaging dosimetry, patient safety, adaptive radiotherapy
Introduction
The electronic portal imaging device (EPID), originally developed for patient positioning prior to treatment, may also be used for verification of radiation therapy treatment delivery. Although EPID for pretreatment verification has been investigated extensively and is common practice in many clinics, its use for in vivo dosimetry (IVD) is still growing.1,2 EPID IVD has the potential to identify errors in dose calculation, data transfer, patient setup and motion, and dose delivery. It may also provide a valuable trigger for adaptive radiotherapy.3 Most importantly, EPID IVD could have detected recent catastrophic errors which led to major injury or death.4–6
The Netherlands Cancer Institute implemented an in-house EPID IVD solution7 which caught 17 serious errors of 4337 verified patient treatments.8 The method back-projects dose inside the patient making use of transit (ie, through the patient) EPID images and ion chamber commissioning measurements.9 Over time, the model was improved to calculate dose in 3 dimensions (3-D),10 be used in rotational deliveries,11 and account for inhomogeneities.12 A second group, making use of transit images and a complex image prediction algorithm,13 achieved 3-D dose reconstruction in the patient14 and 2-D real-time treatment verification,15 both at the cost of laborious implementation and heavy computational requirements. Thirdly, Piermattei et al have focused on calculating the dose at the isocenter point by means of correlation ratios.16–18 The latter method has the advantage of being of simple implementation but also has the drawback of providing only point dose. In addition to the in-house methods above, there are currently 2 commercial EPID IVD solutions: Dosimetry Check19 (by Math Resolutions, Columbia, MD) and EPIgray20 (by DOSIsoft, Cachan, France). In addition, the point dosimetry method proposed by Piermattei et al is available commercially from Best Medical Italy (Milano, Italy).
As the 2-D and 3-D EPID in vivo dose estimation solutions currently available are either proprietary or complex in-house methods, the need for an easy-to-implement and freely available method is apparent. We built upon the point-dose model initially proposed by Piermattei et al 16 and further developed by the same group21–23 aiming to develop a solution with the following characteristics: is sensitive to gross errors and most setup errors, does not require additional instrumentation, has fast and simple commissioning, and provides 2-D dose maps in the isocenter plane. Previously, we presented preliminary results in anthropomorphic phantoms for a simple method for 2-D dose calculation using correlation ratios and an empirical off-axis correction.24 In this article, we describe details of our improved model and test its ability to accurately calculate the dose. The purpose of this article is to allow other centers to adopt this method of EPID IVD. Preliminary clinical results showed power to detect interfractional variations.25 In a study on 10 rectal cancer patients we found dose differences due inter-fractional to soft tissue variations.26 Flowcharts that describe commissioning and measurement procedures are provided. As well, we investigate how changes in attenuator thickness between simulation and treatment (as in the case of most anatomy or setup variations) affect results. Our method is entirely open source, so it can be modified according to the user’s needs. It is based on cine imaging to allow possible extension to real-time dose verification and dynamic treatments.
Methods
Electronic Portal Imaging
All cine images were obtained with an a-Si 1000 EPID on a Varian Clinac 21 EX linear accelerator (Varian Medical Systems, Palo Alto, California), 6 and 15 MV at 600 monitor unit (MU)/min. The imager panel was placed 50 cm beyond isocenter, covering a field size of 26.8 × 20.1 cm2 at isocenter. Both half resolution (348 × 512, 0.4 MB per image) and full resolution (768 × 1024, 1.6 MB) were investigated. Dark and flood field (FF) correction images were applied for all 4 imaging settings: 6 MV half resolution (12.86 frames/s or f/s, 8 frames/image or f/i), 6 MV full resolution (7.5 f/s and 8 f/i), 15 MV half resolution (15 f/s and 4 f/i), 15 MV full resolution (7.827 f/s and 4 f/i). To quantify the EPID’s constancy in time, repeat cine images (6 MV half resolution, 10 × 10 cm2 field, 100 MU, 300 MU/min) through a 22-cm phantom were acquired at weeks 1 to 8, 14, and 18. Phantoms consisted in slabs of solid water (Gammex, Middleton, Wisconsin). The specific results presented herein apply to this particular equipment and settings, but in principle, the method is applicable to any system with minor modifications.
Commissioning Procedure
Commissioning of our transit EPID IVD requires 2 sets of calibration images acquired with multiple field sizes through various thicknesses of phantom and treatment planning system (TPS, here analytical anisotropic algorithm (AAA) Eclipse version 11.0.31; Varian Medical Systems) dose maps at corresponding mid-depths inside the phantom. A commissioning flowchart is displayed in Figure 1.
Figure 1.
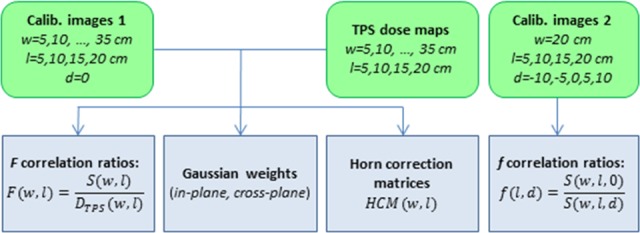
Commissioning procedure of electronic portal imaging device in vivo dosimetry (EPID IVD) by correlation ratios. Green rounded boxes represent suggested EPID measurements and treatment planning system (TPS) calculations. Blue boxes are output data, used for subsequent dose calculations, specific to machine, energy, dose rate, and imaging parameters. (w = phantom thickness on central axis, l = square field size, d = vertical displacement off-center; see Figure 2.)
Dose at isocenter
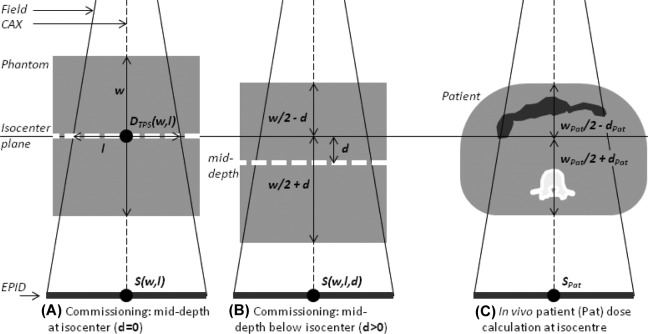
The isocenter point dose estimation is based on the work of Piermattei et al 16 and is summarized here for completeness. We use correlation ratios, F(w, l), between the EPID central axis (CAX) signal through a phantom of thickness w, centered at isocenter, and the dose at mid-depth (w/2) from the TPS, for square fields of size l. Unless otherwise specified, the CAX signal, S, refers to the mean of central 64 pixels (∼4 × 4 mm2). In the case of phantom vertical off-centering by d, another correlation ratio is introduced, f(l, d).
For each energy (6 MV, 15 MV), 28 sets of EPID cine calibration images were collected, corresponding to 7 thicknesses of solid water phantoms (5, 10, 15, 20, 25, 30, and 35 cm) and 4 square field sizes (l = 5, 10, 15, and 20 cm), as in Figure 2A. Each cine set was produced by 100 MU. The total water equivalent thickness along the CAX, w, is equal to that of the phantom plus that of the couch and was vertically centered about the isocenter. Each cine image set was preprocessed to determine the signal S(w, l) of Figure 2 as follows.
Figure 2.
In vivo isocenter dose measurement by electronic portal imaging as proposed by Piermattei et al.16 A, Measurement of correlation ratio F (Equation 1). A and B, Measurement of f (Equation 2). C, Use of F, f, and tissue maximum ratios (TMRs) to measure dose at isocenter in a patient. In our approach, we account for inhomogeneities by water equivalent thicknesses (bowel gas and vertebral body shown).
To invert and offset the cine produced by the EPID, each “raw” pixel value S (raw) i,j was replaced by 214 − S (raw) i, j. As the original (raw) 14-bit image is designed to resemble film (with lower pixel values representing greater dose), this step produced an image in which intensity is proportional to dose.
An FF correction image was taken through 20 cm of solid water, a “typical” patient thickness.
Resolution was set to half resolution to reduce computational time.
Cines whose CAX value differed from the mean CAX value of the whole cine set by more than 1 standard deviation (SD) were replaced with the average frame from the remaining ones. This removes beam-on artifacts due to dose rate ramp-up and ghosting27 while maintaining the correct number of frames.
All cines in the set were summed to produce a single image.
The sum image is corrected for backscatter following the method by Berry et al.28
The sum image was corrected for beam-off frame loss.
The beam-off frame loss correction is needed because in cine imaging only images are recorded, not the individual frames. For this reason, if f/i = 8, up to 7 frames may be lost, thus underestimating the total dose. The magnitude of this error depends on f/i, f/s, and the dose rate, so for our setup, we needed to calculate 4 separate corrections (6 and 15 MV, half resolution and full resolution, 600 MU/min). To determine the correction, we acquired images for a range of MU values (approximately 10-15, 45-50, 95-100, and 155-160) and plotted the number of resulting images as a function of MU, as in Figure 3. A linear fit of the “steps” of the plot then gave the corrected (noninteger) number of images per MU, which was used to correct all measurements.
Figure 3.
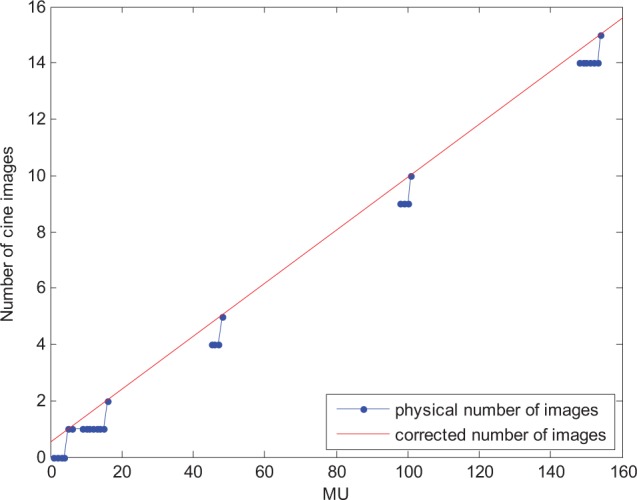
Correction for beam-off frame loss. In cine imaging, the last frames which are too few to form an image (ie, are less than the f/i value) are discarded. This was accounted for multiplying the image sum by the corrected (noninteger) number of images (red) for its monitor unit (MU) value over the physical number of images (blue), found by fitting the data points characterized by the lowest number of MU per image.
For each S(w, l), the corresponding TPS dose at isocenter, DTPS (w, l), refers to dose at mid-depth w/2. S(w, l) and DTPS (w, l) were interpolated and then extrapolated to w = 45 cm. Correlation ratios were given (Figure 2A) by:
| 1 |
To account for the general case of the patient/phantom not vertically centered about the isocenter, the second correlation ratio is:
| 2 |
Here, S(w, l, d) is the CAX signal with the attenuator shifted by d (>0 if shifted downstream; Figure 2B). The f(l, d) ratios were measured for l = 5, 10, 15, and 20 cm and d = –10, −5, 5, and 10 cm (each image 50 MU, w fixed at 26 cm because dependence of F with phantom thickness is <0.3%16). In the case of vertical alignment (d = 0), f(l,0) is equal to unity.
Making use of F and f correlation ratios and TPS tissue maximum ratios (TMR), dose at isocenter in a patient (Figure 2C) is, as per Piermattei et al,16
| 3 |
Here, w pat and d pat are the total water equivalent thickness through the patient along the CAX and l eq is the equivalent square field size of the treatment field.
From isocenter dose to 2-D dose at isocenter depth
To calculate dose in the plane at isocenter depth, we applied Equation 3 for every ray line from the source to each EPID pixel i, j, with w pat and d pat becoming wi,j and di,j.
| 4 |
This 2-D dose map is accurate at isocenter (the F and f correlation factors were in fact obtained on the CAX) but not in the whole plane because the 2-D shape of the transit image does not mirror that of the mid-phantom dose distribution. This occurs predominantly because closer to field edges the dose in the phantom is affected by loss of lateral electronic equilibrium, while image intensity in different pixels is affected mainly by different phantom and gantry scatter. In our previous work, we proposed an empirical method to correct for this, based on the shape of F profiles for various field sizes and absorber thicknesses.24 Although results were good along the central in-plane and cross-plane profiles, this solution was inadequate in the corners of larger (>10 × 10 cm2) fields.
To improve accuracy of the EPID-derived dose map, we convolved it in 2-D by an asymmetrical multi-Gaussian kernel, by means of 2 subsequent 1-D convolutions. For each of the 56 commissioning setups described above (7 slab phantom thicknesses, 4 field sizes, and 2 energies), we determined an optimal convolution kernel by an in-house optimizer in MATLAB. The optimization process was run in 1-D, separately for the cross-plane (x) and in-plane (y) central profiles, thus resulting in a non-circularly symmetrical 2-D kernel. For each direction, the TPS dose central profile was modeled by a linear combination of 4 Gaussian functions, G1-G4, of SDs: 0.32, 0.64, 3.20, and 9.60 cm. Standard deviations of the 4 Gaussians were empirically set to best model the physical phenomena involved (dosimetric penumbra dependence with phantom thickness, field size, and pixel intensity changes with phantom-to-imager distance and scatter from phantom to imager29), starting from published results of similar work.30,31 The use of 4 Gaussians was appropriate according to minimum Akaike information criteria.32,33 In the cross-plane direction (x), the optimizer found the 4 coefficients c1X-c4X that minimized the quantity.
| 5 |
The calculation was repeated in the in-plane (y) direction. An asymmetrical 2-D convolution kernel allows better modeling since the imager responds slightly differently in the 2 directions due to differences in backscatter (eg, from the imager arm)34 and geometric penumbra (eg, elliptical shape of the focal spot35,36 and distances of jaws from said focal spot).
The Gaussian convolution is not capable of modeling the dose profile horns, which are present at shallow depths, especially for 15 MV. So a horn correction matrix, HCM (w, l), is determined by point-by-point division of the convolved image by the TPS dose map (Figure 4). In brief, for each setup, we calculated the matrix of the ratio of the transit image to the mid-plane dose and normalized it to its maximum (the peak of the horns). All pixel values outside the horns were set to unity. The result is a circular 2-D map which may be used to reinsert the shape of the dose inside the horns.
Figure 4.
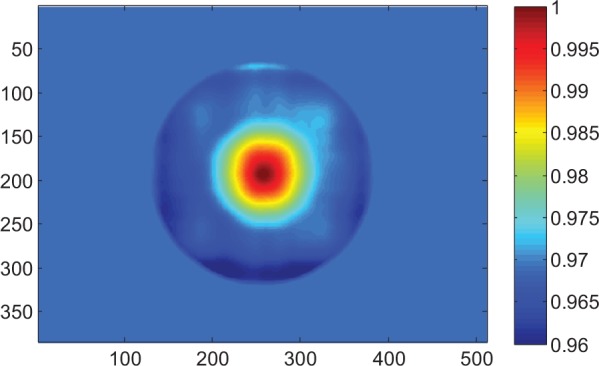
Horn correction matrix (HCM) for phantom thickness 10 cm, 15 × 15 cm2 field. An in vivo dose calculation must be divided by the appropriate HCM to account for beam horns. The correlation ratio F between portal imaging transit signal and dose in the mid-depth of the phantom was established on the central axis, hence the HCM is equal to 1 in the center of the image. Axes are pixel numbers.
The 2-D dose in the isocenter plane is then (Figure 5):
Figure 5.
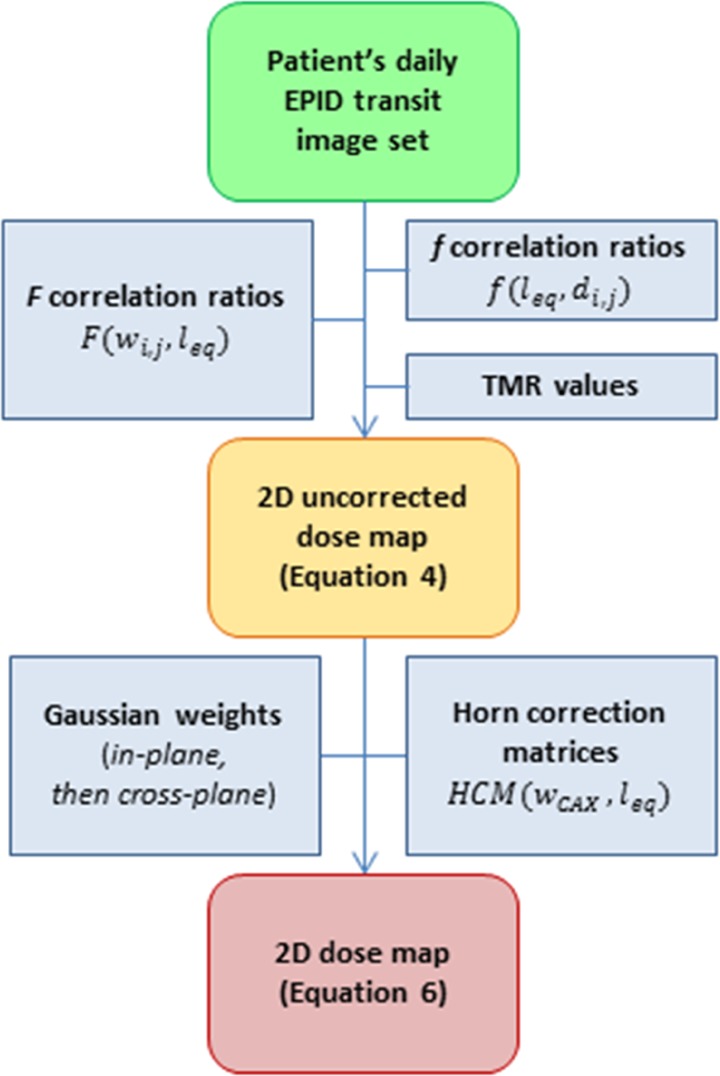
Portal imaging dose calculation from patient/phantom images.
| 6 |
where ⊗X and ⊗Y are 1-D convolutions in the cross- and in-plane directions. The effect of the 2-D correction (multi-Gaussian convolution and HCM matrix multiplication) in improving accuracy can be seen in Figure 6G and H. Here, the green curve is the uncorrected dose calculated by Equation 4. The cyan curve is the same map after 2-D convolution by the optimal asymmetrical multi-Gaussian kernel. The red dashed curve is the final dose map, after multiplication by the HCM, as per Equation 6.
Figure 6.
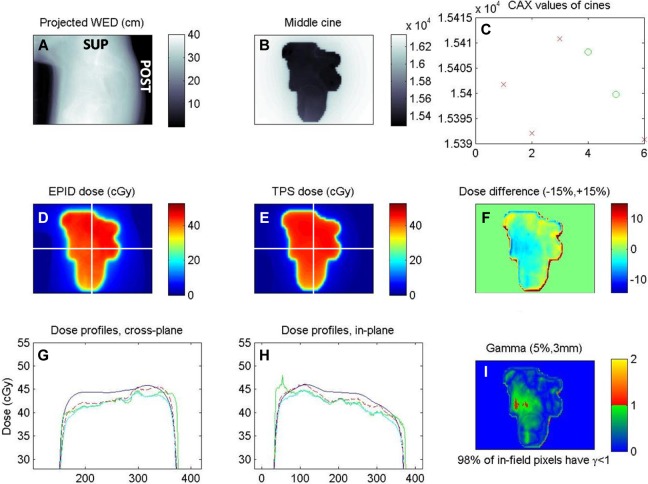
Screenshot of in vivo EPID dose calculation (prone cervical cancer patient, lateral field). A, Beam’s eye view of water equivalent depth, obtained by the projection of planning CT along ray lines from source to each EPID pixel. B, One of the in vivo cine EPID images (a.u.). C, Value of the central pixels for each of the 5 cines (x-axis); the first 3 discarded due to beam-on artifacts. D, EPID–reconstructed inpatient dose at isocenter depth. E, Planned dose. F, In-field pixel-by-pixel dose difference map. G and H, Cross-plane and in-plane central profiles of planned dose (blue), dose reconstruction steps (green and cyan), and final EPID dose (dashed red). I, Gamma evaluation, 5%/3mm. Unlabeled axes are pixel number.
Testing
EPID dose versus MU, field size, and thickness
To test dose calculation, images were taken with both 6 MV and 15 MV energies through slab phantoms:
Versus MU: 40, 80, 120, 160, and 200 MU (w = 20 cm, l = 10 cm, half resolution and full resolution).
Versus l and w: For half resolution, l = 7, 12, and 17 cm and w = 12, 22, and 32 cm. For full resolution: l = 8, and 16 cm and w = 6 and 28 cm.
Measured and planned dose maps were compared on the CAX, pixel-by-pixel, and by means of 3%/3mm gamma evaluations. These gamma criteria were chosen as they are the most prevalent37 and useful for comparison with other techniques.
Accuracy in the presence of thickness errors
A characteristic limitation of using planning computed tomography (CT) data (ie, thickness w) to calculate dose delivered at treatment is that the CT may not accurately reflect the patient at the time of treatment (actual thickness w + Δw). If this occurs, the calculated EPID dose will have a systematic error, quantified here as the ratio between , calculated with w values obtained from planning CT, and DEPID, calculated with the actual patient thickness w + Δw. This idea is expressed graphically in Figure 7. If the thickness changes by Δw (>0 for thickness increase and vice versa) upstream, downstream, and symmetrically with respect to the isocenter, the ratios of apparent to true EPID doses are (making use of Equation 3), respectively:
Figure 7.
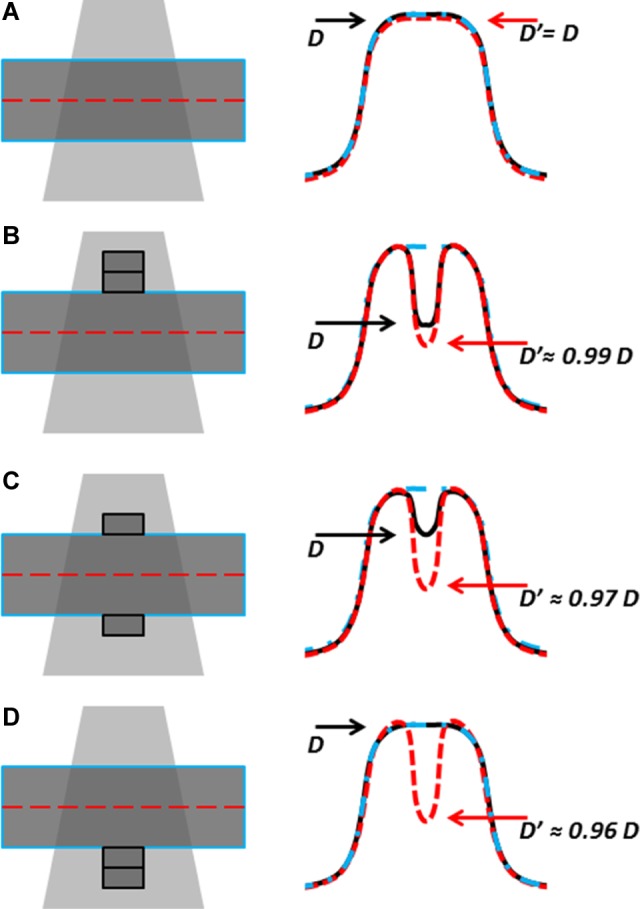
Dose discrepancies flag changes in, eg, patient set up but dose values may be inaccurate. A, Treatment matches planning CT; EPID-calculated dose D′ (red dashed) and true dose D (black) agree with CT-planned dose (blue dash-dot). B, When Δw = +1 cm is introduced upstream of isocenter in the treatment but not in the CT, D′ slightly exaggerates the dose difference. C, If the extra attenuator is distributed vertically, the true dose is closer to planned dose, but the EPID signal is unchanged with respect to (B), and D′ further overestimates dose difference. D, If extra attenuator is downstream, D agrees with planned dose, while D′ underestimates dose by 4% per cm (see Figure 12A for exact values).
| 7 |
| 8 |
| 9 |
Analytical calculations of Equation 7 to Equation 9 were performed on the CAX for ▵w = +1 cm, for the commissioning ranges of w (5-45 cm) and l (5-20 cm).
In vivo calculation
Proof of concept was tested with analysis of patient cine images, obtained as part of a trial approved by the Conjoint Health Research Ethics Board of the University of Calgary. The in vivo case included here is a lateral field from a patient with cervical cancer treated with a 15 MV 4-field box while lying prone on a belly board immobilization device. The gamma analysis criteria was loosened to 5%/3mm to account for acceptable setup and anatomical differences, as employed by previous reports.21,22
Results
The CAX EPID signal range over 18 weeks was very stable: the SD of the 10 readings was 0.9% of the mean signal. F and f correlation ratios were in agreement with previous reports16,24 (eg, F for 6 MV in Figure 8).
Figure 8.
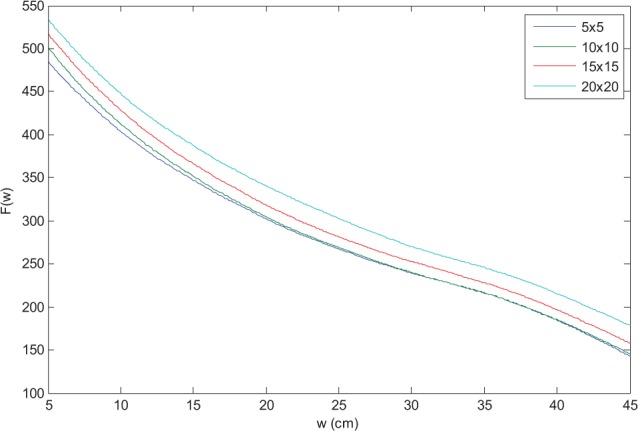
F correlation ratios for 6 MV.
EPID dose versus MU, field size, and thickness
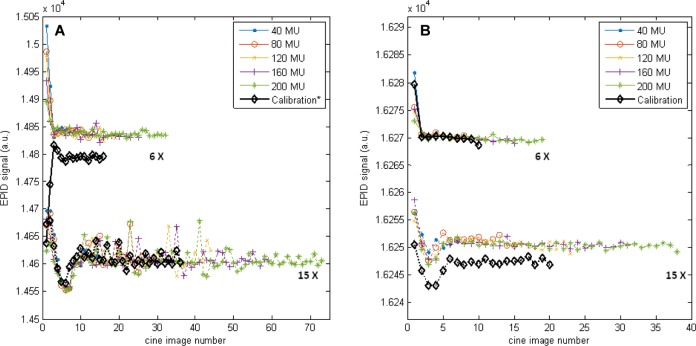
The number of frames required to achieve a stable signal depended on imaging parameters (Figure 9) and was approximately 1.2 seconds and 2.4 seconds for the 6 MV and 15 MV beams, respectively. The magnitude of the effect did not depend on the total MU.
Figure 9.
(A) Half resolution and (B) full resolution central axis (CAX) S (raw), for both energies, l = 10, w = 20. Higher S (raw) corresponds to lower dose. In all cases, the first images are susceptible to linear accelerator ramp-up artifacts39 and were therefore removed. For 6 MV half resolution, a correction factor was introduced to account for the systematic offset. Note that the scale of (B) is 10 times smaller. *Acquired 9 months before all other images, before imager upgrade.
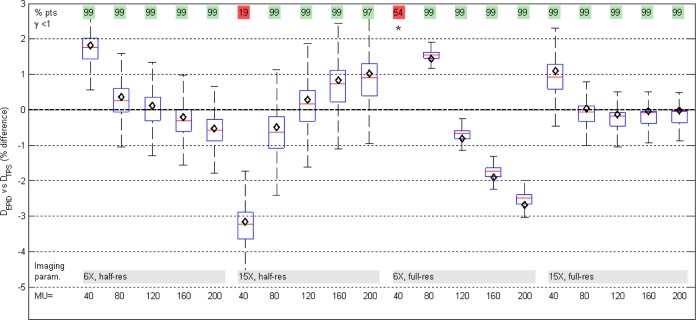
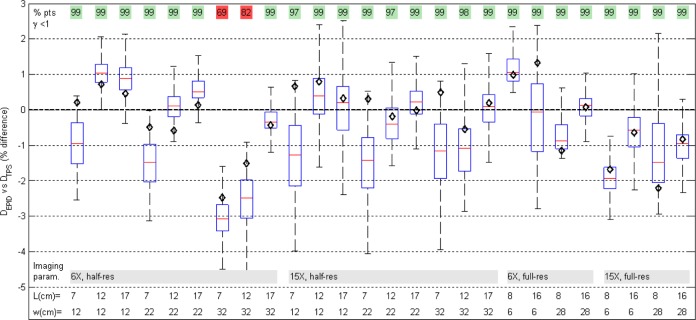
Agreement between planned and measured dose for different MU values was generally within 3% (Figure 10). On the CAX, dose difference (mean [SD]) was (0.26% [2.23%]). Two of the 20 tests, both at the lowest MU value, failed a 3%/3mm gamma evaluation and had the largest CAX deviations, −3% and +8%. These are due to limitations of the beam-off frame loss correction and due to lower signal to noise; as well, there is a discernible trend with MU for each imaging setting (more detail in Discussion). For all 4 imaging settings, the best agreement is at approximately 100 MU where the F factors were measured: calibration dose should be close to delivered field dose to optimize accuracy.
Figure 10.
Box plot of pixel-by-pixel dose differences between EPID and planned dose maps, varying monitor unit (MU). Box edges are the 25th and 75th percentiles; red line is median. Dose maps passed a 3%/3 mm gamma analysis in all but 2 tests (top row). In all but 3 cases, the central axis EPID dose (black diamond) was within ±2% of planned dose. Whiskers are set at q3 + 1.5 (q3-q1) and q1 − 1.5 (q3-q1), where q1 and q3 are the 25th and 75th percentiles, respectively. This corresponds to approximately ±2.7σ and 99.3% coverage if the data are normally distributed. Outliers not plotted. *Out of scale, +8%.
EPID dose calculation showed good agreement with the TPS for nonreference field sizes and solid water thicknesses (Figure 11). On the CAX, mean deviation from TPS value was (−0.23% [0.97%]). In 24 of the 26 fields, >97% of points passed the gamma 3%/3mm evaluation.
Figure 11.
Box plot of pixel-by-pixel dose differences shows good agreement between EPID and planned dose maps, varying square field size (l) and absorber thickness (w). In all but 2 cases, the central axis EPID dose (black diamond) was within ±2% of planned dose.
Accuracy in the presence of thickness errors
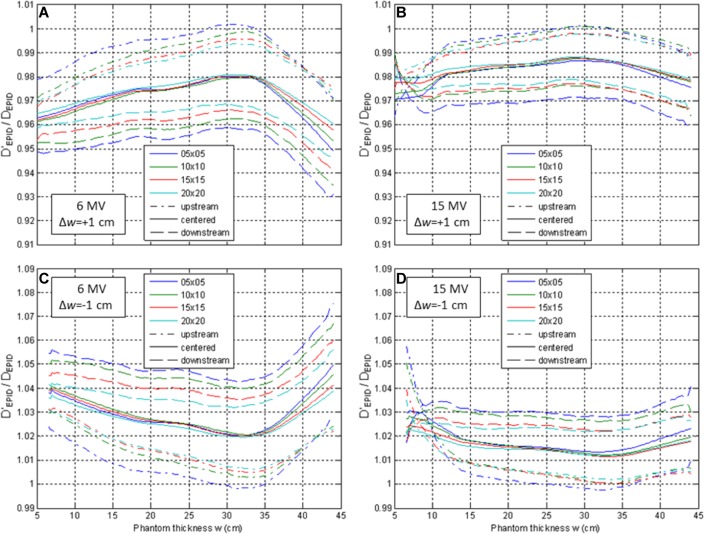
Changes in patient characteristics from the planning CT have a complex impact on the accuracy of dose estimation from EPID images (Figure 12). If the water equivalent thickness changes by 1 cm upstream of the isocenter, the estimated dose is generally within ±1.5% of the actual dose for 6 MV and ±0.5% for 15 MV. On the other hand, changes downstream of the isocenter result in poorer estimates: up to ±4.5% for 6 MV and ±3.0% for 15 MV.
Figure 12.
Ratio of dose calculated using incorrect thickness (w) to dose calculated with correct thickness (w ± ▵w), from transit images of phantoms of thickness w ± ▵w. In the case of tissue gain/swelling (▵w = +1, A and B), use of planning CT thickness (w) causes dose underestimation. The dose calculation error is largest for thickness changes downstream of the isocenter (dashed) and is larger for 6 MV (A and C) than 15 MV (B and D).
In vivo calculation
EPID in vivo dose calculation was successful and added minimal treatment time for the patient (imager arm extension and retraction) and added no extra dose. CT water equivalent depth calculation required about an hour and was done separately. EPID-calculated dose was found to be in very good agreement with planned dose, with 98% of the field passing gamma evaluation. A screenshot of the resulting IVD report is illustrated in Figure 6.
Discussion
In this article, we have illustrated the implementation procedure and sensitivity of a simple in-house 2-D EPID IVD by correlation ratios. It is in principle translatable to any linear accelerator equipped with a standard flat panel EPID, provided that the acquisition mode captures the entire delivery (ie, cine or integrated) and that the same mode is used at commissioning and at measurement. For Elekta 16-bit imaging systems,38 the 214 offset described in the section “Dose at isocenter” must be replaced by 216.
The ramping up effect observable in the CAX value of the first cine images is in agreement with previous observations by McCurdy and Greer39 who found the same trend in both cine images and ion chamber measurements, leading to the conclusion that this effect is due to the linear accelerator. For the 6 MV beam only, the beam-on effect switched from an abnormal “ramping down” (Figure 9A, 6 MV, black) to ramping up (Figure 9B, 6 MV, black) over the 9 months between calibration and measurement, during which the upgrade from half resolution to full resolution was carried out. This upgrade also caused a 1-time systematic deviation in signal of about 3%, which was accounted for by means of a correction factor. It is unclear why the 6 MV beam produced these results, and further investigation was not possible due to the nonreversible upgrade. We speculate that it may relate to imaging system defects, including sensitivity changes due to accumulated dose, which is why the upgrade was performed.
Agreement between planned and EPID-calculated dose with varying MU was within 3% for deliveries of 80 MU and above. The 40-MU deliveries had worse agreement (2 failed gamma analysis) for 2 reasons: low signal-to-noise and limitations of the frame loss correction. Regarding signal-to-noise, we established that it is advisable to discard the first 2 to 4 cine images (as per Figure 9), in agreement with previous findings,39 which showed that cine pixel values only stabilize after about 30 MU. The 40 MU deliveries may leave as little as 1 cine in the set, increasing susceptibility to noise. The second limitation, which affected both the dose agreement at low MU and which produced the trends visible in Figure 10, is the beam-off frame loss correction. Data used to derive the linear fit in Figure 3 are necessarily discretized because only whole MU values are deliverable, resulting in a fit uncertainty equal to a horizontal offset of 1 MU. This error is more important for images with fewer MU (2.5% for a 40-MU image). In addition, there is uncertainty on the slope of the fit (the ratio of “correct number of images” to MU), which may produce worse agreement at very low or high MU. The best agreement is around 100 MU, where test measurements are closest to commissioning measurements, and thus, the systematic error from the frame loss corrections cancels out. To reduce these systematic errors and accurately verify low-MU fields, we suggest setting a lower value (<4) to the frames per image parameter, although this increases computational requirements, and matching the MU for calibration to anticipated field doses.
The other 2 cases of gamma analysis failure were small fields through thick attenuator (w = 32 cm, l = 7, 12 cm). These 2 tests were the first to be delivered in the run of 9 tests for that set of imaging parameters, and both calculations resulted in an underdosage of approximately 3%, suggesting that ghosting artifacts may have affected the commissioning data used to determine the F calibration factor. To prevent this, we suggest waiting an adequate time (eg, 1 minute) between commissioning fields.
Accuracy in the Presence of Thickness Errors
The shape of Figure 12 curves is due to F factor characteristics. With increasing thickness, the air gap between the phantom and the imager shortens, increasing the CAX EPID signal, S. For even larger thickness (w > 30 cm), more photons scattered in the phantom are absorbed by the phantom itself, decreasing S and causing an inflection point at 30 to 35 cm in Figure 8. This causes a maxima when calculating the ratio F(w)/F(w + 1) (Figure 12A and C) and a minima when calculating F(w)/F(w−1) (Figure 12B and D). Lastly, the behavior of /D EPID at shallow depths for 15 MV is due to proximity to the depth of maximum dose (dose is calculated at mid-depth, w/2).
For IVD using planning CT data, the magnitude of detected dose discrepancy may not be accurate if the CT data used to back-project the EPID signal no longer accurately reflect the measurement conditions. Most IVD solutions, including the original point dose estimation by correlation ratios of Piermattei et al,16 do not quantify this effect but simply loosen the dose difference tolerance to account for acceptable anatomical changes. For isocenter IVD by correlation ratios, tolerances of 5%/3mm were found to be appropriate21,40 but may be changed by users depending on the desired objective (eg, gross error detection vs detection of small setup errors or anatomical changes) and the acceptable number of false positives and false negatives. Recently, Rozendaal et al 41 quantified the effect of anatomical changes on their in-house EPID IVD and found that the EPID-based dose reconstruction is approximately 5 times more sensitive to volume changes than the TPS dose calculation. For example, if an attenuating volume increases in thickness from 20 to 21 cm, they found that the true dose to a point within that volume drops by about 1%, whereas the EPID-calculated dose in the same point drops by 5%. In our IVD by correlation ratios, we also found that the EPID-based dose reconstruction may exaggerate dose disagreement between plan and delivery. Increasing thickness from 20 to 21 cm, the EPID-calculated dose decreases by up to 4 to 5 times more than the true dose (Figure 7B and C). In the extreme case of an anatomical change entirely downstream of the calculation plane (Figure 7D), the true dose would not differ from the planned dose, but the EPID calculation would detect this (likely harmless) discrepancy. The dose measured by our algorithm will be less than the true dose when the attenuator increases (by swelling or setup errors) and greater than true dose when attenuator decreases (weight loss and setup errors). The change depends on energy, field size, thickness, and location (upstream vs downstream of isocenter) of thickness change but is almost always within 4% per cm of water equivalent thickness variation (Figure 12). In conclusion, dose discrepancies should be interpreted primarily as flags which warrant further investigation, rather than an accurate measure of delivered dose.
Limitations
Because the correlation ratios between EPID signal and dose in phantom are acquired with square fields, the immediate application is 3-D conformal radiotherapy (CRT). In lower resource settings, such as middle and lower income countries, CRT is likely to retain a leading role, making our IVD readily applicable. Extension of our IVD to intensity-modulated radiation therapy (IMRT) is straightforward, by summation of all cine images into an integrated image, although the modulated beam will produce different scatter to the imager, affecting dose reconstruction accuracy. Occasionally, IMRT split-fields may have a small number of MU (<40), which may compromise accuracy as discussed above and illustrated in Figure 10. Extension to volumetric-modulated arc therapy (VMAT), on the other hand, requires considerable work. To produce true in-patient dose data, 2-D dose maps are needed at every gantry angle (an integrated image over all the arc is less sensitive to dosimetric variations42). This would require CT-based calculation of water equivalent thicknesses, from the source to each pixel, at every gantry angle. This calculation is currently time-consuming (∼1 hour per gantry angle) and would require further optimization. The resulting 2-D dose maps would then have to be summed appropriately in 3-D to provide patient dose. In addition, small and/or irregularly shaped subfields of a VMAT arc cause different photon scatter to the imager compared to the square fields used at commissioning and would likely cause errors in dose estimation.
This method uses only water equivalent thickness for calibration and calculation. Although this does account for changes in attenuation of the primary beam due to inhomogeneities, it does not account for changes in scatter dose. For this reason, its utility in regions of large inhomogeneities such as lung is limited.24
We used the TPS as reference values, rather than measured data (eg, ion chamber), in order to develop an easy-to-implement method. The AAA calculates dose to within 0.5% in equilibrium conditions in homogeneous media, and the penumbra is modeled with an accuracy of 1%, 1 mm, which is sufficiently accurate for F correlation ratios and planar measurements.43
Conclusion
We propose a simple, open-source, 2-dimensional EPID IVD by correlation ratios, with a fast commissioning procedure. Varying MU, thickness, and field size within clinical ranges, agreement between EPID-calculated, and TPS dose were in almost all cases better than 3%, suggesting that our EPID IVD method is sufficiently robust. Dose reconstruction makes use of planning CT data, so its accuracy is related to anatomical and setup reproducibility. In case of anatomy and setup differences with respect to planning, EPID dose may overestimate the error by up to about 4% per cm of attenuator change. Results on a patient provide proof of concept; further, in vivo testing is warranted for clinical implementation. The in vivo dose information may be used as a flag for delivery errors and to guide adaptive radiotherapy. All MATLAB code is freely available by contacting the authors.
Abbreviations
- CAX
central axis
- CT
computed tomography
- EPID
electronic portal imaging device
- FF
flood field
- HCM
horn correction matrix
- IMRT
intensity-modulated radiation therapy
- IVD
in vivo dosimetry
- MU
monitor unit
- TPS
treatment planning system
- VMAT
volumetric-modulated arc therapy
Footnotes
Declaration of Conflicting Interests: The author(s) declared no potential conflicts of interest with respect to the research, authorship, and/or publication of this article.
Funding: The author(s) received no financial support for the research, authorship, and/or publication of this article.
ORCID iD: Stefano Peca, PhD http://orcid.org/0000-0001-5940-6046
References
- 1. Van Elmpt W, McDermott L, Nijsten S, Wendling M, Lambin P, Mijnheer B. A literature review of electronic portal imaging for radiotherapy dosimetry. Radiother Oncol. 2008;88(3):289–309. doi:10.1016/j.radonc.2008.07.008. [DOI] [PubMed] [Google Scholar]
- 2. Mijnheer BJ, Beddar S, Izewska J, Reft C. In vivo dosimetry in external beam radiotherapy. Med Phys. 2013;40(7):70903 doi:10.1118/1.4811216. [DOI] [PubMed] [Google Scholar]
- 3. Persoon LC, Nijsten SM, Wilbrink FJ, et al. Interfractional trend analysis of dose differences based on 2D transit portal dosimetry. Phys Med Biol. 2012;57(20):6445–6458. doi:10.1088/0031-9155/57/20/6445. [DOI] [PubMed] [Google Scholar]
- 4. Williams MV. Radiotherapy near misses, incidents and errors: radiotherapy incident at Glasgow. Clin Oncol (R Coll Radiol). 2007;19(1):1–3. doi: 10.1016/j.clon.2006.12.004. [DOI] [PubMed] [Google Scholar]
- 5. Derreumaux S, Etard C, Huet C, et al. Lessons from recent accidents in radiation therapy in France. Radiat Prot Dosimetry. 2008;131(1):130–135. doi:10.1093/rpd/ncn235. [DOI] [PubMed] [Google Scholar]
- 6. Bogdanich W. As Technology Surges, Radiation Safeguards Lag. New York Times. January 28, 2010:1–13. [Google Scholar]
- 7. McDermott LN, Wendling M, Sonke JJ, van Herk M, Mijnheer BJ. Replacing pretreatment verification with in vivo EPID dosimetry for prostate IMRT. Int J Radiat Oncol Biol Phys. 2007;67(5):1568–1577. doi:10.1016/j.ijrobp.2006.11.047. [DOI] [PubMed] [Google Scholar]
- 8. Mans A, Wendling M, McDermott LN, et al. Catching errors with in vivo EPID dosimetry. Med Phys. 2010;37(6):2638–2644. doi:10.1118/1.3397807. [DOI] [PubMed] [Google Scholar]
- 9. Wendling M, Louwe RJW, McDermott LN, Sonke JJ, van Herk M, Mijnheer BJ. Accurate two-dimensional IMRT verification using a back-projection EPID dosimetry method. Med Phys. 2006;33(2):259–273. doi:10.1118/1.2147744. [DOI] [PubMed] [Google Scholar]
- 10. Wendling M, McDermott LN, Mans A, Sonke JJ, van Herk M, Mijnheer BJ. A simple backprojection algorithm for 3D in vivo EPID dosimetry of IMRT treatments. Med Phys. 2009;36(7):3310–3321. doi:10.1118/1.3148482. [DOI] [PubMed] [Google Scholar]
- 11. Mans A, Remeijer P, Olaciregui-Ruiz I, et al. 3D Dosimetric verification of volumetric-modulated arc therapy by portal dosimetry. Radiother Oncol. 2010;94(2):181–187. doi:10.1016/j.radonc.2009.12.020. [DOI] [PubMed] [Google Scholar]
- 12. Wendling M, McDermott L, Mans A, et al. In aqua vivo EPID dosimetry. Med Phys. 2012;39(1):367 doi:10.1118/1.3665709. [DOI] [PubMed] [Google Scholar]
- 13. Chytyk-Praznik K, VanUytven E, VanBeek T, Greer PB, McCurdy BMC. Model-based prediction of portal dose images during patient treatment. Med Phys. 2013;40(3):31713 doi:10.1118/1.4792203. [DOI] [PubMed] [Google Scholar]
- 14. Van Uytven E, Van Beek T, McCowan PM, Chytyk-Praznik K, Greer PB, McCurdy BMC. Validation of a method for in vivo 3D dose reconstruction for IMRT and VMAT treatments using on-treatment EPID images and a model-based forward-calculation algorithm. Med Phys. 2015;42(12):6945–6954. doi:10.1118/1.4935199. [DOI] [PubMed] [Google Scholar]
- 15. Woodruff HC, Fuangrod T, Van Uytven E, et al. First experience with real-time EPID-based delivery verification during IMRT and VMAT sessions. Int J Radiat Oncol. 2015;93(3):516–522. doi:10.1016/j.ijrobp.2015.07.2271. [DOI] [PubMed] [Google Scholar]
- 16. Piermattei A, Fidanzio A, Stimato G, et al. In vivo dosimetry by an aSi-based EPID. Med Phys. 2006;33(11):4414–4422. doi:10.1118/1.2360014. [DOI] [PubMed] [Google Scholar]
- 17. Cilla S, Fidanzio A, Greco F, et al. Calibration of Elekta aSi EPIDs used as transit dosimeter. Technol Cancer Res Treat. 2011;10(1):39–48. http://onlinelibrary.wiley.com/doi/10.1002/cbdv.200490137/abstract\nhttp://www.tcrt.org/mc_images/category/4298/tcrt_sample_ms.pdf. [DOI] [PubMed] [Google Scholar]
- 18. Russo M, Piermattei A, Greco F, et al. Step-and-shoot IMRT by Siemens Beams: an EPID dosimetry verification during treatment. Technol Cancer Res Treat. 2016;15(4):535–545. doi:10.1177/1533034615590962. [DOI] [PubMed] [Google Scholar]
- 19. Gimeno J, Pujades MC, García T, et al. Commissioning and initial experience with a commercial software for in vivo volumetric dosimetry. Phys Medica. 2014;30(8):954–959. doi:10.1016/j.ejmp.2014.06.004. [DOI] [PubMed] [Google Scholar]
- 20. Celi S, Costa E, Wessels C, Mazal A, Fourquet A, Francois P. EPID based in vivo dosimetry system: clinical experience and results. 2016;17(3):262–276. [DOI] [PMC free article] [PubMed] [Google Scholar]
- 21. Fidanzio A, Greco F, Mameli A, et al. Breast in vivo dosimetry by EPID. J Appl Clin Med Phys. 2010;11(4):249–262. [DOI] [PMC free article] [PubMed] [Google Scholar]
- 22. Cilla S, Fidanzio A, Greco F, et al. Correlation functions for Elekta aSi EPIDs used as transit dosimeter for open fields. J Appl Clin Med Phys. 2011;12(1):218–233. [DOI] [PMC free article] [PubMed] [Google Scholar]
- 23. Piermattei A, Greco F, Fidanzio A, et al. Real-time dose reconstruction for wedged photon beams: a generalized procedure. J Appl Clin Med Phys. 2011;12(4):124–138. [DOI] [PMC free article] [PubMed] [Google Scholar]
- 24. Peca S, Brown DW. Two-dimensional in vivo dose verification using portal imaging and correlation ratios. J Appl Clin Med Phys. 2014;15(4):117–128. doi:10.1120/jacmp.v15i4.4752. [DOI] [PMC free article] [PubMed] [Google Scholar]
- 25. Peca S, Brown D, Smith WL. In vivo EPID dosimetry detects interfraction errors in 3D-CRT of rectal cancer In: International Federation for Medical and Biological Engineering Proceedings 2015;51:531–534. [Google Scholar]
- 26. Peca S, Sinha RS, Brown DW, Smith WL. In vivo portal imaging dosimetry identifies delivery errors in rectal cancer radiotherapy on the belly board device. Technol Cancer Res Treat. 2017; doi: 10.1177/1533034617711519. [DOI] [PMC free article] [PubMed] [Google Scholar]
- 27. McDermott LN, Louwe RJW, Sonke JJ, van Herk M, Mijnheer BJ. Dose-response and ghosting effects of an amorphous silicon electronic portal imaging device. Med Phys. 2004;31(2):285–295. doi:10.1118/1.1637969. [DOI] [PubMed] [Google Scholar]
- 28. Berry SL, Polvorosa CS, Wuu CS. A field size specific backscatter correction algorithm for accurate EPID dosimetry. Med Phys. 2010;37(6):2425–2434. doi:10.1118/1.3468578. [DOI] [PubMed] [Google Scholar]
- 29. Jaffray DA, Battista JJ, Fenster A, Munro P. X-ray scatter in megavoltage transmission radiography: physical characteristics and influence on image quality. Med Phys. 1994;21(1):45–60. doi:10.1118/1.597255. [DOI] [PubMed] [Google Scholar]
- 30. Van Herk M, Remeijer P, Rasch C, Lebesque JV. The probability of correct target dosage: dose-population histograms for deriving treatment margins in radiotherapy. Int J Radiat Oncol Biol Phys. 2000;47(4):1121–1135. doi:10.1016/S0360-3016(00)00518-6. [DOI] [PubMed] [Google Scholar]
- 31. Witte MG, van der Geer J, Schneider C, Lebesque J V, van Herk M. The effects of target size and tissue density on the minimum margin required for random errors. Med Phys. 2004;31(11):3068–3079. doi:10.1118/1.1809991. [DOI] [PubMed] [Google Scholar]
- 32. Yamaoka K, Nakagawa T, Uno T. Application of Akaike’s information criterion (AIC) in the evaluation of linear pharmacokinetic equations. J Pharmacokinet Biopharm. 1978;6(2):165–175. doi:10.1007/bf01117450. [DOI] [PubMed] [Google Scholar]
- 33. Quirk S, Becker N, Smith W. External respiratory motion: shape analysis and custom realistic respiratory trace generation. Med Phys. 2012;39(8):4999–5003. doi:10.1118/1.4737095. [DOI] [PubMed] [Google Scholar]
- 34. Greer PB. Correction of pixel sensitivity variation and off-axis response for amorphous silicon EPID dosimetry. Med Phys. 2005;32(12):3558–3568. doi:10.1118/1.2128498. [DOI] [PubMed] [Google Scholar]
- 35. Mayles P, Nahum AE, Rosenwald JC. Handbook of Radiotherapy Physics: Theory and Practice. Boca Raton, FL: Taylor & Francis; 2007. [Google Scholar]
- 36. Naqvi SA, Earl MA, Shepard DM. Convolution/superposition using the Monte Carlo method. Phys Med Biol. 2003;48(14):2101–2121. doi:10.1088/0031-9155/48/14/305. [DOI] [PubMed] [Google Scholar]
- 37. Pulliam K, Kerns J, Howell R, Followill D, O’Daniel J, Kry S. MO-G-BRE-02: a survey of IMRT QA practices for more than 800 institutions. Med Phys. 2014;41(6):432–432. doi:10.1118/1.4889185. [Google Scholar]
- 38. Fidanzio A, Greco F, Gargiulo L, et al. A generalized calibration procedure for in vivo transit dosimetry using siemens electronic portal imaging devices. Med Biol Eng Comput. 2011;49(3):373–383. doi:10.1007/s11517-010-0699-6. [DOI] [PubMed] [Google Scholar]
- 39. McCurdy BMC, Greer PB. Dosimetric properties of an amorphous-silicon EPID used in continuous acquisition mode for application to dynamic and arc IMRT. Med Phys. 2009;36(7):3028–3039. doi:10.1118/1.3148822. [DOI] [PubMed] [Google Scholar]
- 40. Cilla S, Azario L, Greco F, et al. An in-vivo dosimetry procedure for Elekta step and shoot IMRT. Phys Medica. 2014;30(4):419–426. doi:10.1016/j.ejmp.2013.11.005. [DOI] [PubMed] [Google Scholar]
- 41. Rozendaal RA, Mijnheer BJ, Hamming-Vrieze O, Mans A, van Herk M. Impact of daily anatomical changes on EPID-based in vivo dosimetry of VMAT treatments of head-and-neck cancer. Radiother Oncol. 2015;116(1):70–74. doi:10.1016/j.radonc.2015.05.020. [DOI] [PubMed] [Google Scholar]
- 42. Persoon LCGG, Podesta M, Nijsten SMJJG, Troost EGC, Verhaegen F. Time-resolved versus integrated transit planar dosimetry for volumetric modulated arc therapy: patient-specific dose differences during treatment, a proof of principle. Technol Cancer Res Treat. 2016;15(6):NP79–NP87. doi:10.1177/1533034615617668. [DOI] [PubMed] [Google Scholar]
- 43. Van Esch A, Tillikainen L, Pyykkonen J, et al. Testing of the analytical anisotropic algorithm for photon dose calculation. Med Phys. 2006;33(11):4130–4148. doi:10.1118/1.2358333. [DOI] [PubMed] [Google Scholar]


