Abstract
Purpose:
The aim of this study is to evaluate the tracking accuracy of a commercial ultrasound system under relevant treatment conditions and demonstrate its clinical utility for detecting significant treatment deviations arising from inadvertent intrafractional target motion.
Methods:
A multimodality male pelvic phantom was used to simulate prostate image-guided radiotherapy with the system under evaluation. Target motion was simulated by placing the phantom on a motion platform. The tracking accuracy of the ultrasound system was evaluated using an independent optical tracking system under the conditions of beam-on, beam-off, poor image quality with an acoustic shadow introduced, and different phantom motion cycles. The time delay between the ultrasound-detected and actual phantom motion was investigated. A clinical case example of prostate treatment is presented as a demonstration of the utility of the system in practice.
Results:
Time delay between the motion phantom and ultrasound tracking system is 223 ± 45.2 milliseconds including video and optical tracking system frame rates. The tracking accuracy and precision were better with a longer period. The precision of ultrasound tracking performance in the axial (superior–inferior) direction was better than that in the lateral (left–right) direction (root mean square errors are 0.18 and 0.25 mm, respectively). The accuracy of ultrasound tracking performance in the lateral direction was better than that in the axial direction (the mean position errors are 0.23 and 0.45 mm, respectively). Interference by radiation and image quality do not affect tracking ability significantly. Further, utilizing the tracking system as part of a clinical study for prostate treatment further verified the accuracy and clinical appropriateness.
Conclusions:
It is feasible to use transperineal ultrasound daily to monitor prostate motion during treatment. Our results verify the accuracy and precision of an ultrasound system under typical external beam treatment conditions and further demonstrate that the tracking system was able to identify important prostate shifts in a clinical case.
Keywords: motion tracking, image-guided radiation therapy, transperineal ultrasound, time lag, intrafractional imaging
Introduction
Image-guided radiation therapy (IGRT) has become routine treatment for prostate cancer in the last decade.1 Intrafractional imaging and the ability to visualize soft tissue are important for IGRT of the prostate, especially in the context of emerging stereotactic body radiotherapy approaches. Various methods have been proposed to monitor prostate motion intrafractionally, but these methods have several limitations when applied to the challenging problem of real-time soft tissue prostate visualization. On-board 3-dimensional kV/MV imaging is capable of producing soft tissue images with excellent spatial resolution, but it does not provide adequate temporal sampling for real-time motion monitoring during beam delivery. Planar kV/MV imaging can be used for tracking in combination with implanted fiducials. However, this method is invasive and the fiducials could migrate over the time.2,3 Furthermore, this approach requires frequent exposures delivering additional radiation dose that may become hazardous if frequency and technique are not properly controlled.4 Bony anatomy may also be used for positioning purposes; however, this may not be accurate for prostate target positioning due to the differential filling of the bladder and rectum.5 The Calypso real-time electromagnetic tracking system is another alternative method used for monitoring prostate motion during radiation treatment with high time resolution and precise localization6; however, image artifacts caused by transponders can preclude the use of magnetic resonance imaging in posttreatment assessment,7 making its usefulness less appealing. Using transperineal ultrasound (TPUS) for IGRT allows for the use of the same modality in the simulation room and the treatment room. This makes it possible to avoid a difference in imaging modalities for setup and treatment with no additional imaging dose.8 For TPUS, it has been shown that there is a good correlation between image-defined and physical volumes.9 Moreover, TPUS visualizes the prostate gland well in comparison to computed tomography (CT) image10 and offers certain advantages to transabdominal ultrasound (TAUS). The TAUS showed systemic errors compared to CT as well as gold seed verification.11 The reason for the systemic error is that pressure impacts prostate localization causing prostate movement during the TAUS acquisition.12 There is pressure applied to the prostate with the use of TPUS, but the pressure is always applied during the continuous ultrasound (US) image acquisitions and the treatment. For TAUS, the pressure is applied only during the image acquisition but not during the treatment. Moreover, an abdominal probe would interfere with the treatment machine if left in place during delivery. On the other hand, a transperineal probe is out of the treatment field. In addition, TAUS imaging is more sensitive to bladder filling and pubic bones than TPUS. With all of these advantages, TPUS imaging has been introduced clinically for intrafractional prostate motion monitoring,13–15 but it has not yet been established that its tracking accuracy and precision are adequate for daily IGRT use in the clinic under treatment conditions. Previous phantom studies have attempted to evaluate the US tracking approach,16,17 but essential confounding factors such as temporal accuracy (latency evaluation), presence of radiation, image quality, and motion frequency have not been addressed. For this reason, in this study, we evaluate the Clarity Autoscan US system under relevant treatment conditions in comparison to an independent optical tracking system. We further present a clinical case to demonstrate the importance of and potential for intrafractional motion detection using the system (Elekta, Stockholm, Sweden).
Materials and Methods
Simulation and Treatment Planning
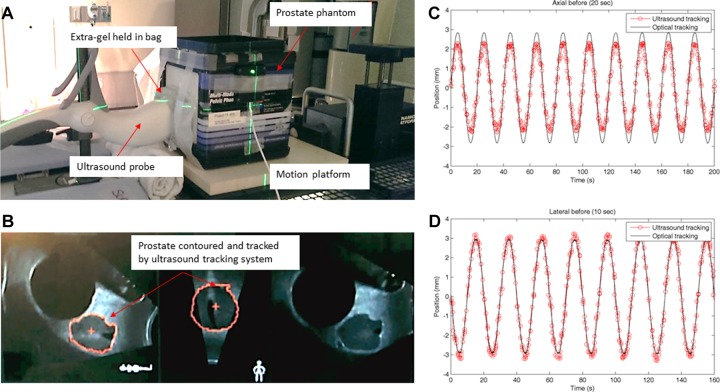
A male pelvic phantom (CIRS Model 048; Computerized Imaging Reference Systems, Inc, Norfolk, Virginia) was placed on the CT couch and aligned to the internal CT lasers. The male pelvic phantom includes pelvic bones, 177 cm3 anechoic bladder, prostate, urethra, seminal vesicles, and rectum. This phantom can be imaged under US, magnetic resonance imaging, and CT with known prostate and bladder volumes to enable assessment of volumetric measurement accuracy. A reflective marker array was affixed to the top of the transperineal probe and used to correlate the phantom position in the simulation room with the position in the treatment room for the Clarity US system (Elekta, Stockholm, Sweden). The phantom setup and an US image of the pelvic phantom are shown in Figure 1. Moreover, an overview of the motion pattern monitored by the US and optical tracking systems for axial (superior–inferior) and lateral (left–right) directions is shown in Figure 1C and D. In order to maintain contact between the phantom and the probe while the phantom was moving, extra gel was held in an US compatible bag between the probe and phantom. To avoid any air gaps, extra gel was applied on the probe and the surface of the phantom. Both an US scan and a CT scan were acquired in the simulation room for treatment planning purposes.
Figure 1.
(A) The experimental setup. A prostate phantom was placed on a motion platform and an ultrasound compatible bag was used to hold extra gel in place between the phantom and the ultrasound probe to avoid any air gaps while the phantom was moving. (B) An ultrasound image of the pelvic phantom. (C and D) An overview of the motion pattern monitored by the ultrasound (red dots) and optical (black line) tracking systems. The motion of the platform is set at ±3 mm amplitude with a period of (C) 20 seconds for axial (superior–inferior) and (D) 10 second for lateral (left–right) directions.
The US image was then registered to the CT image using the Clarity workstation (Elekta). The registration between US image and CT image is rigid in this study. The registration of simulation US to CT serves to transfer prostate contours from the CT-based plan onto the simulation US image. Given that simulation US and CT are taken within seconds of each other (the patient is CT scanned with the US probe in place), the prostate shape and location in both the US and the CT should be the same. The hardware US-CT registration and fusion is nevertheless reviewed and adjusted for the unlikely scenario that the prostate has moved between the CT and the immediate US simulation scan. After the registration, the prostate contours overlaid on the simulation US images represent the expected shape and location of the prostate for treatment. A treatment plan is then generated using volumetric-modulated arc therapy (VMAT) with a single 15 MV arc to mimic prostate treatment (Eclipse, v.11; Varian Medical Systems, Palo Alto, California)
Experiment Setups and Data Analysis
Intensity-based image-to-image registration is used for prostate tracking. The tracking is limited to voxels within a 2-cm boundary surrounding the prostate contours.17 The algorithm uses normalized cross-correlation as the cost function calculated within 2 cm from the contours of prostate. The world coordinate Xw of the prostate (contours) center of mass (COM) is calculated, and the difference between the currently calculated COM and the reference COM position on the world determines the current prostate displacement. The registration is constrained to 6 degrees of freedom (translations and rotations with no deformations). The new sampled image is compared to the pretreatment US reference image acquired at beginning in cylindrical coordinates. The relationships between voxel coordinate (Xp = i, j, k and world coordinates Xw are defined in Equations 1 to 3:
| 1 |
| 2 |
| 3 |
where si and sj are the pixel scaling, α is the rotational step, r is the radial offset from the voxel origin (X 0) to the axis of rotation, and D is the matrix of direction cosines.18
The field of view can be adjusted by the sweep angle to cover the desired field of view. The maximum scan angle is 75° in 0.5 second. The probe uses motorized control for the sweeping motion. The US frame rate (F) depends on the imaging parameters defined in Equation 4:
| 4 |
where Δθsweep is the sweep angle, Δθ is the angular spacing between frames, and T sweep is the total sweep time.
There is an in-room tracker calibrated to the room coordinates and mounted on the wall to locate the reflective markers on the US probe. With the reflective markers, the coordinates of the US image are linked to room coordinates in the treatment room. The coordinate transformations between US image and position in the treatment room are defined as the following equation:
| 5 |
where rR is the room coordinates, RTT is the tracker-to-room transformation matrix, TTP is the probe-to-tracker transformation matrix, PTF is the 4 × 4 frame-to-probe transformation matrix, and rF is a pixel in US “frame” coordinates.
The Polaris Spectra optical tracking system capable of tracking 6 degrees of motion (NDI, Ontario, Canada) was used as an independent method to verify the tracking accuracy of the Clarity Autoscan US system. The optical tracking system uses infrared emitting markers. Due to the high sampling rate (60 Hz) and accuracy of the optical system, it is treated as the gold standard in this study. The CIRS male pelvic phantom was placed on a motion platform (Computerized Imaging Reference Systems, Inc, Norfolk, Virginia) in the treatment room and positioned using the room lasers. The target position was adjusted using TPUS imaging. For each measurement, approximately 4-minute data were recorded. Therefore, there were approximately 240 (=4 × 60) data points for the US system and 104 (=4 × 60 × 60) data points for the optical tracking system for each measurement. Linear regression was used to evaluate the linear relationship between the tracking performed by the US system and Polaris. The root mean square error (RMSE) between all measurements reported by the 2 systems was also calculated to demonstrate the average error for US system in comparison to the optical system. The tracking ability of US system was evaluated with regard to the following:
1. Temporal accuracy (latency evaluation) between the motion phantom and US tracking system: The 2 tracking systems operate completely independent of each other and cannot be started at the exact same time. Since they do not share a common synchronized time stamp, in order to determine the delay between actual phantom motion and that reported by the US tracking system, a video system was used to monitor both the optical and the US system, that is, to put the 2 systems on the same clock. The screens of the optical system and the US system, used to monitor the motion of the phantom, were placed next to each other and screen displays were recorded by a camera with a frame rate of 30 frames per second (fps). The recorded video was reviewed frame-by-frame to examine the temporal signals displayed by both systems and determine the offset between the 2 signals. The first frame that reports the phantom in motion is located for each of the optical and the US systems. Since the frame rate of the video is known, the time delay between the 2 systems was calculated by the difference in frame number. A total of 10 videos were taken; the time delay and standard deviation were calculated. Approximately 1000 frames (∼34 seconds) were reviewed per video. The position of the phantom was monitored and displayed by the optical and the US systems. When the position of the phantom changed more than 3 standard deviation of the noise (no motion), we considered the phantom to be in motion (1 mm for US and 0.1 mm for optical system).
2. Radiation and neutron perturbation (performance during treatment, beam on): A VMAT treatment plan using 15 MV beams was delivered, while the US system was acquiring data in order to determine whether radiation would affect the electronic processing of the US system. In this study, the optical tracking patterns served as the ground truth. The mean position difference recorded between the US system and the optical tracking system (US tracking error) at different motion phases was used to evaluate the accuracy of the US system. The mean position value is the position difference detected by the US and optical systems calculated by the following equation.
| 6 |
where x i,ultrasound and x i,optical are the phantom position detected by the US and the optical systems at certain phase. The phantom motion was set to ±3 mm amplitude and 10- or 20-second period.
3. Image quality: Using the same setup as earlier, an additional image was acquired in which acoustic shadows were introduced with an air gap between the US probe and the surface of the phantom in order to simulate deterioration in US image quality. The image is shown in Figure 2. The effect of image quality degradation was evaluated by calculating the US tracking error and its standard deviation, when compared to the optical tracking system, as discussed earlier. The phantom motion was set to ±3 mm in amplitude and a 10-second period.
4. Phantom motion frequency: The phantom motion was set to either a 20-second period or a 10-second period in order to evaluate the impact of the motion frequency on the tracking accuracy and the precision in both lateral and axial directions. The effect of phantom motion frequency was evaluated by US tracking error and its standard deviation when compared to the optical tracking system, as discussed earlier.
5. Prostate treatment clinical case example: A standard prostate treatment was simulated and planned according to clinical protocols. A knee support provided with the US system to hold the legs in frog-like position and a ring for the hands were used as immobilization devices. The patient was asked to drink 2 to 3 cups of water (500-700 mL) 30 minutes before treatment and to have a bowel movement 2 to 3 hours before treatment. Patient was also asked to be on a low-fiber diet. A rectal spacer or balloon was not used for the treatment. During simulation, the Clarity Autoscan US system was used to acquire the TPUS data set. The US images were fused with the planning CT, and the prostate was contoured on both data sets. The treatment plan was created according to standard clinical protocol. During the daily treatment setup, the Clarity Autoscan US system was used to acquire the TPUS images. The patient was aligned for treatment using the standard of care cone beam CT, and the US system was used to track intrafractional prostate motion. The presentation of this clinical case example was reviewed and approved by the institutional review board of Stanford.
Figure 2.
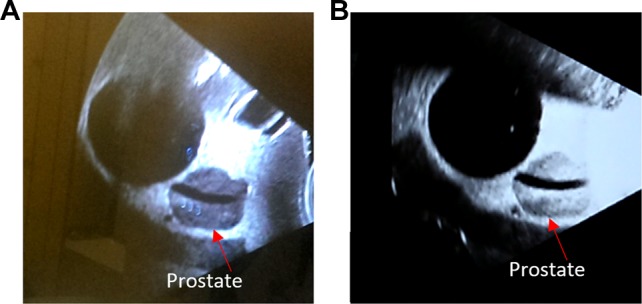
(A) A typical good quality ultrasound image of the male pelvic phantom. (B) A poor quality ultrasound image. The contrast for the prostate is degraded by air gaps between the probe and phantom (arrows point the boundary of the prostate). The algorithm uses normalized cross-correlation as the cost function calculated within 2 cm from the contours of prostate. Theoretically, if the contrast at boundary of prostate gets compromised, the ultrasound tracking ability will decrease.
Results
Temporal Accuracy (Latency Evaluation)
The motion of the phantom was monitored by the US and optical systems and was recorded by a video before and continued after start of the phantom motion. The frame number reporting initial phantom motion was noted for each system. The average difference in the number of frames noting the initial phantom motion between the 2 systems is 5.2. With the known frame rate of 30 fps, the average time delay is 173 milliseconds and the standard deviation is 45.2 milliseconds (n = 10). If the finite video (30 fps) and optical tracking system (60 Hz) frame rates are included in the latency evaluation time delays, the upper limit latency is estimated to be 223 milliseconds (=173 + 33 + 17).
Radiation and Neutrons Effect From Radiation Delivery
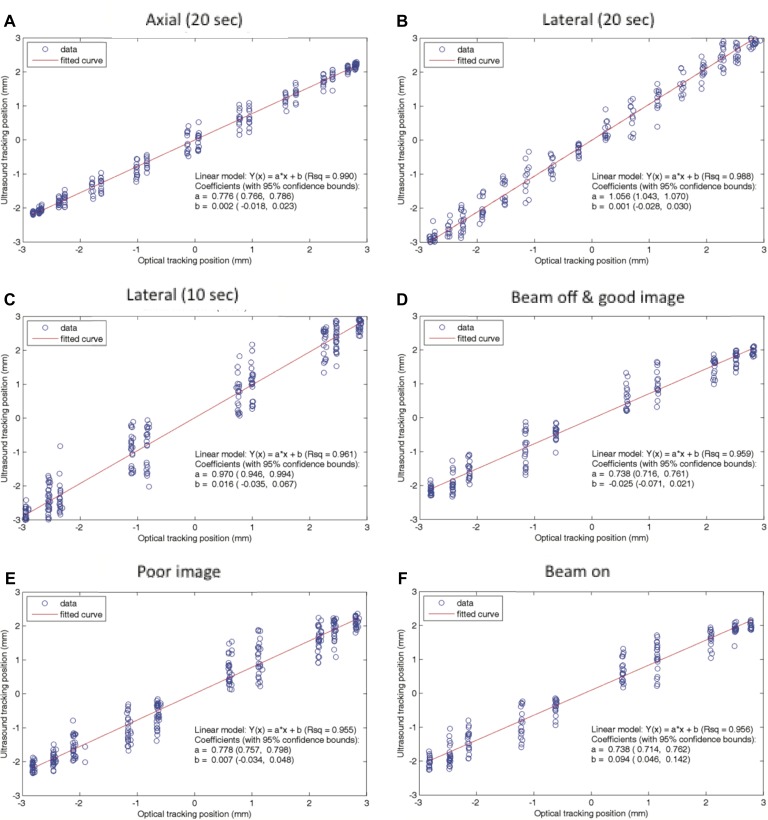
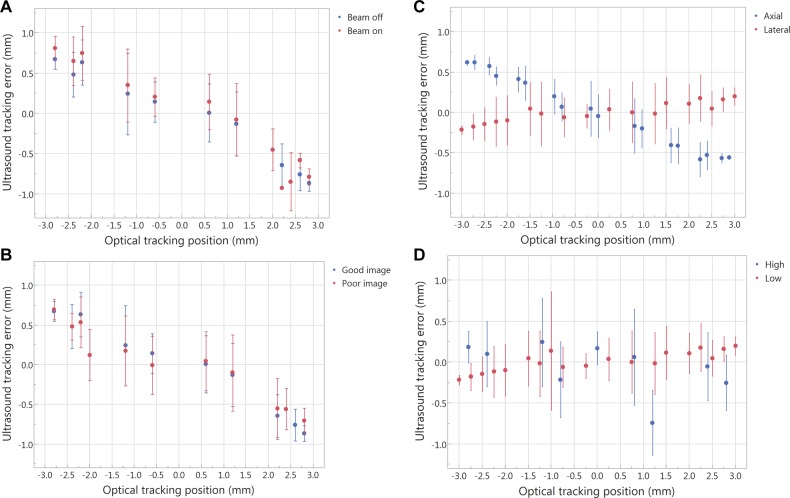
The linear regression fits of US-measured displacement versus optically measured displacements in the presence and lack of radiation and neutrons are shown in Figure 3D and F. The fitting results (R 2) for beam-off and beam-on are comparable, R 2 = 0.958 and 0.956, respectively. The RMSEs are 0.31 and 0.32 mm for beam-off and beam-on. Moreover, the US tracking error and its standard deviation at different motion phases (when the phantom goes through different phases of the sine wave, the phantom has different speeds) as shown in Figure 4A are comparable. Therefore, the influence of radiation and neutrons on the tracking ability is negligible.
Figure 3.
The linear regression fit between the ultrasound and the optical tracking systems for (A) axial (superior–inferior) with 20-second period, (B) lateral (left–right) with 20-second period, (C) lateral with 10-second period, (D) beam-off with good image quality, (E) poor image, and (F) beam-on. The fitting results between beam-off and beam-on are comparable (r = 0.979 and 0.978, respectively). The fitting result for good image quality is comparable to that for the poor image (r = 0.979 and 0.977, respectively). High frequency (10-second period) has worse fitting result than low frequency (20-second period; r = 0.961 and 0.988, respectively). The fitting results between lateral and axial are comparable, but the slope of the fitting curve is different, which is due to the positional accuracy.
Figure 4.
The average of the position difference recorded between the ultrasound system and the optical tracking system (y-axis, ultrasound tracking error) at different motion phases (x-axis). The error bar is the deviation of the position difference between the 2 systems when the phantom goes through different phases of the sine wave and when the phantom has different speeds. (A) Beam-off versus beam-on, (B) good image quality versus poor image quality, (C) axial (superior–inferior) versus lateral (left–right), and (D) high frequency (10-second period) versus low frequency (20-second period).
Image Quality
The linear regression fit of US-measured displacement versus optically measured displacements for good image quality is comparable to that for poor image quality (R 2 = 0.958 and 0.955, respectively), as shown in Figure 3D and E. The RMSEs are 0.31 and 0.34 mm for good and poor image quality, respectively. The US tracking error and its standard deviation at different motion phases is similar for both good and poor image quality, as shown in Figure 4B.
Motion Frequency and the Directional Effect
The precision of US tracking performance in the axial direction was better than that in the lateral direction (Figure 4C). The RMSEs for axial and lateral are 0.18 and 0.25 mm, respectively. The accuracy of US tracking performance in the lateral direction was better than that in the axial direction (the mean position errors are 0.23 and 0.45 mm, respectively). The tracking accuracy and precision were better with a longer period (Figure 4D). The RMSEs for low and high frequency are 0.25 and 0.45 mm, respectively.
Prostate Radiotherapy Clinical Case Example
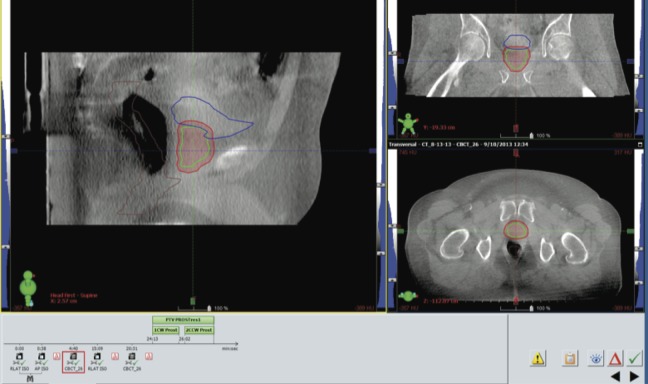
During treatment, the Clarity Autoscan US system was used to acquire continuous TPUS images that were used as monitoring for intrafractional prostate motion. The patient was positioned using cone beam CT (Figure 5), and once the patient was shifted to treatment position based on this cone beam CT, the US monitoring was started with a 3-mm threshold. The zero position of the US monitoring is thus determined by the standard-of-practice cone beam CT. Any deviation beyond 3 mm from this position will be alerted by the US system.
Figure 5.
Patient alignment using cone beam computed tomography (CT) as a baseline before ultrasound monitoring. The patient was aligned to treatment position using cone beam CT according to standard treatment protocols, after which the ultrasound monitoring was started.
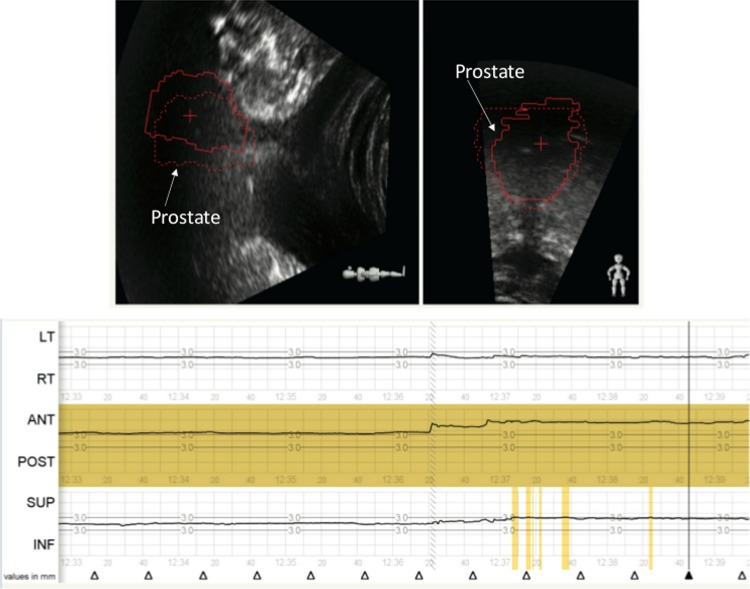
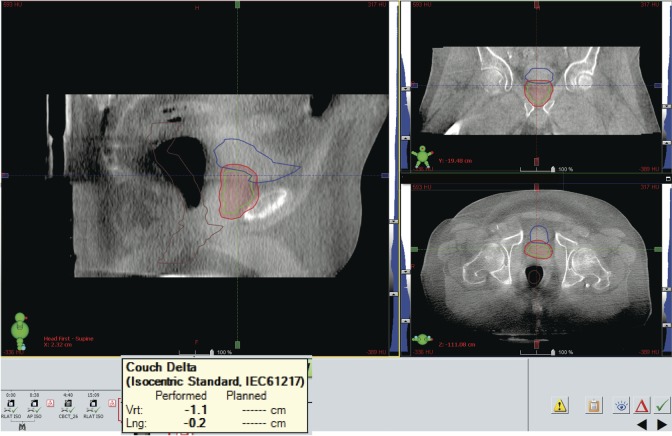
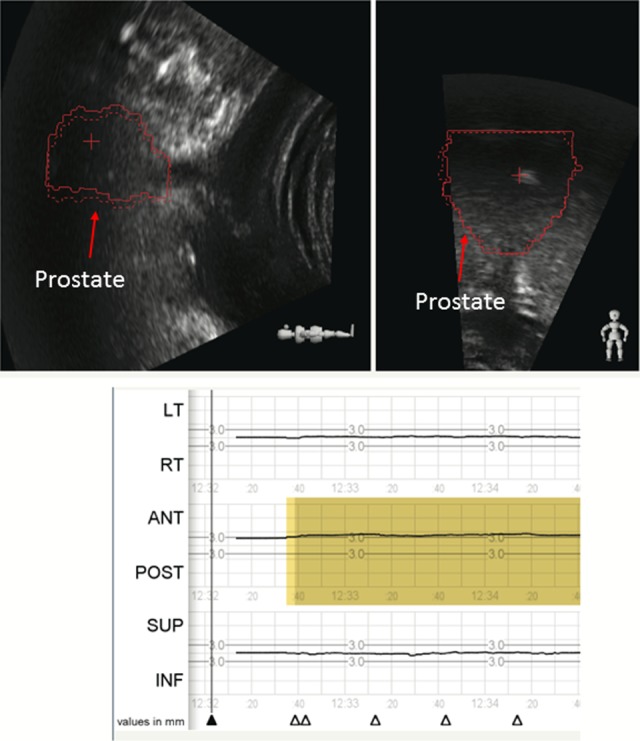
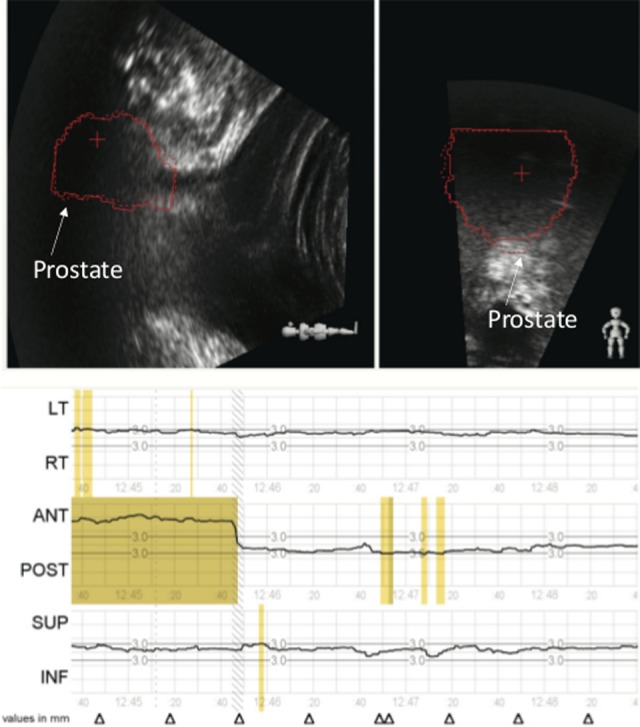
Less than 1 minute from initiating the monitoring and immediately prior to the commencement of treatment, the Clarity system signaled that the prostate had shifted more than 3 mm in the anterior direction (Figure 6). Beam initiation was halted and the patient’s position was observed. The patient’s anatomy continued to shift in the anterior direction over the next several seconds and settled at a displacement of about 1 cm, as noted by the US monitoring (Figure 7). The anterior shift in prostate position was stable over several seconds and thus not indicative of a movement that would return to treatment position on its own. A second cone beam CT was taken and verified the anterior shift noted by the Clarity system. The cone beam CT determined the shifts to be 1.1 cm in the anterior direction (Figure 8), which was in agreement with the US system. The patient was repositioned based on the cone beam CT and the US monitoring continued throughout this corrective action, showing the patient’s return to original treatment position on the tracking system (Figure 9). The patient’s position was monitored for several seconds in order to ensure stability. The treatment beam was then initiated with confidence in prostate position. The US monitoring continued throughout treatment delivery and did not detect any further anatomy shifts outside the 3 mm tolerance. In this example, the Clarity system detected the deviation in prostate position immediately prior to initiating treatment and the beam was halted. On first impression, this may indicate interfractional monitoring; however, this deviation in prostate position took place during the standard of care process within the treatment session and thus can be argued to be considered part of the treatment session and thus intrafractional. This positional displacement was caught within the treatment session just prior to beam initiation, which was then halted, and corrective action was taken. This example demonstrates the potential for intrafractional motion detection by the Clarity Autoscan US system.
Figure 6.
The Clarity Autoscan ultrasound system was used for intrafractional prostate monitoring. The zero position was set based upon an initial cone beam computed tomography (CT) and a 3 mm threshold was set. Motion in any direction (left/right, superior/inferior, or anterior/posterior) will signal an out-of-tolerance alert as shown in yellow. A prostate shift of more than 3 mm is identified in the anterior direction just prior to initiating treatment.
Figure 7.
Prostate shift is identified by the Clarity Autoscan ultrasound system. The Clarity Autoscan ultrasound system shows an anterior prostate shift of 1 cm. The red prostate contour (solid line) has moved anterior to the zero position (red dotted line) by 1 cm as noted in the lower panel and maintains this position over several minutes. The red contour is contoured during the planning process on the planning computed tomography (CT) and transferred to the ultrasound (US) image during the registration of the 2 images in the Clarity system. On the first treatment, the contour is imported into the monitoring system.
Figure 8.
Cone beam computed tomography (CT) confirms the prostate shift identified by the Clarity Autoscan ultrasound system. A cone beam CT verifies the 1.1 cm anterior shift reported by the Clarity Autoscan ultrasound. The amount of the shift is showed in the yellow box.
Figure 9.
The Clarity ultrasound system monitors the corrective action performed. The patient was repositioned based upon the cone beam computed tomography (CT) . The prostate contours on the ultrasound image return to treatment position and the anterior shift returns to the zero position as reported by the tracking system. Both the cone beam computed tomography (CT) and the Clarity Autoscan ultrasound system agree on the prostate position.
Discussion
The use of US for intrafractional imaging offers certain advantages over standard radiographic fiducial-based approaches, such as eliminating additional imaging dose and continuous imaging throughout the treatment. Additionally, the TPUS prostate tracking is more attractive than the transabdominal approach for prostate localization which faces challenges related to prostate displacement/deformation induced by probe pressure and interference of the imaging probe with beam paths.19 Previous data show the feasibility of remotely controlled robotic US imaging for IGRT20 to circumvent these challenges; however, limitations of the TAUS technique were prevalent. Kupelian et al showed that the isocenter determined by TAUS-based localization has a systematic shift compared to Calypso,21 bringing into question the usefulness of TAUS for prostate localization and monitoring. Another recent study compared TAUS to cone beam CT for prostate positioning and showed strong agreement between US and bone-matched cone beam CTs; however, they noted limited feasibility due to bladder filling and user-dependent technique issues.22 Clinically, with TPUS, we didn’t notice consistent correlation between image quality and patient size and bladder filling. This might be due to the smaller variation in the depth with the use of a transperineal probe compared to an abdominal probe. While bladder filling is indeed required with TAUS to provide acoustic imaging window, for the TPUS, it appears to be less significant since the bladder is placed distally to the prostate along the US beam. However, further research is necessary to draw a definite conclusion on these effects. This, along with the possible acoustic shadows from the pubic symphysis, limits the usefulness of TAUS for prostate localization. Further, the Clarity Autoscan system has the advantage of continuously taking images throughout the treatment without a manual operator present, thus moving from an US system which utilizes a manual probe for pretreatment setup to an automated scanning system capable of monitoring prostate motion both before and throughout treatment. The Clarity Autoscan system thus holds promise to move US IGRT into intrafractional continuous prostate monitoring. Knowing the accuracy, the precision and clinical feasibility of the Clarity Autoscan US system is crucial for implementation and is evident within the data presented here.
In this study, the accuracy and the precision of the Clarity Autoscan US were evaluated. The accuracy we report reflects the closeness of the Clarity mean value to the actual (true) value as measured by the optical system. The precision provides an estimate of the spread of Clarity measured values for what is expected to be one and the same displacement. The results from the phantom study indicate that the tracking accuracy in the lateral (left–right) direction is better than that in the axial (superior–inferior) direction. The tracking precision in the axial (superior–inferior) direction is better than that in the lateral (left–right) direction. In both directions, tracking accuracy is within a millimeter when target motion is less than 3 mm. The tracking accuracy depends on how well the structure can be seen (ie, good contrast will be tracked well) on the US image, since the registration is intensity based.17 In the case of the phantom, the anatomy is well defined and the contrast of the prostate is easy to see, but for patients, the prostate outline and contrast can vary. Structures including the rectum and pelvic bones within a patient also affect the ability to accurately image the prostate using US. The amplitude discrepancy showed in Figure 1C is probably due to the speed-of-sound variation between the nominal value used by the US system and the actual value in the phantom material. A similar observation is also reported by Lachaine and Falco17 However, to draw a proper conclusion, a further study is needed.
The slope of the regression line in the axial direction was between 0.71 and 0.78, which indicates that when target motion exceeds 3 mm, the displacement error might exceed 1 mm. Therefore, if the target motion is larger than 3 mm, the tracking result should be taken with caution and reevaluated. Thus, for treatments, the patient should be repositioned by other IGRT means before continuing. Due to the method of image acquisition, the accuracy of anterior–posterior direction is expected to be between that of the axial and lateral directions, which has been reported in the previous study.17
The discrete steps along the x-axis (Polaris; Figure 3) arise because in the exported data (available for analysis) the time resolution is much higher for the optical system (60 fps) compared to the US system (1 fps). Each data point represents the position of the phantom reported by the optical system and the US system at the same time (after synchronizing both systems). The position is quantized because the motion of the phantom is a periodic sine wave. Since the phantom motion is periodic and the sampling rate is fixed, the detected position repeats itself. If the monitoring system is very accurate with high sampling rate (the case of the optical tracking system), it should report the same position at a certain phase of the motion (minimum spread in the x-axis). If there is position uncertainty associated with the monitoring system (which is the case for the US system), there will be small variation around the true position. Therefore, the vertical spread in the y-axis represents the uncertainty of US system and the horizontal spread in the x-axis represents the uncertainty of the optical tracking system. The slope represents how well the US tracking system agrees with the optical tracking system and whether there is a systemic difference between the 2 systems. In our case, the amplitude is underestimated by the US system and the underestimation is dependent on the speed of the phantom.
With regard to latency evaluation, to be on the conservative side, time delays because of the finite video and optical tracking system frame rates are included in the latency evaluation. By including the time delay from video (30 fps) and optical tracking system (60 Hz), the latency will be 223 milliseconds (=173 + 33 + 17), which is inferior to those achievable by other monitoring systems such as Calypso 4-D Localization System. To put this in perspective, the intrafractional monitoring system is used to inform the user when the target is out of the tracking limit. In our institution, the tracking limit is 3 mm from the predefined position. If the prostate moves at time 0 and the system has latency timing and reports the shift 223 milliseconds after the shift already happened, then the prostate is outside the predefined position 223 milliseconds without any action. Therefore, it is important to know if the intrafractional monitoring system can report the shift in real time or with minimum time latency in order to determine the dosimetric effect accurately. For prostate treatments, the maximum error associated with the sampling rate and the time delay can be estimated by considering a single-arc treatment at maximum gantry speed (1 rpm). In this study, the latency is 223 milliseconds. Consider the worst case highly improbable scenario: 200 cGy delivered in a single VMAT arc with gantry rotation speed of 1 rpm. If the prostate goes completely out of the beam, it will receive a zero dose for 223 milliseconds before beam hold. This will result in underdosage by (0.223 seconds/60 seconds) × 200 cGy = 0.7 cGy or in relative terms 0.4% of prescribed dose. Even for such extreme case, this is a very minor effect. This error is comparable to what will be acceptable output variations and hence tolerable, especially given the alternative of much larger error with no monitoring and corrections. However, the use of the Autoscan technology for monitoring and adapting therapy to respiratory-induced motion of abdominal lesions will require additional investigation.
Image quality might play a certain role in tracking accuracy because the registration method is intensity-based, image-to-image.17 The live image is compared to the reference image, and the normalized cross-correlation is used as the cost function. Therefore, if the image quality drops, for example, acoustic shadows are induced, the registration algorithm might not be able to give optimal results, which likely will introduce errors into the tracking results. With the use of the male pelvic phantom, this study shows that image quality only slightly affects the tracking accuracy. It might be due to the well-defined structures of the pelvic phantom, which does not truly represent the real prostate image. Further studies using a more realistic prostate image could provide more insight into how the image quality will affect tracking accuracy. The average of the position difference recorded between the US system and the optical tracking system at different motion phases and its standard deviation at different phases were used to evaluate the accuracy and the precision of the tracking system. If the ability of the tracking system is not affected by introduced factors, the average tracking error and its deviation should remain the same. On the other hand, if the introduced factors affect the tracking ability, the tracking position of the phantom will fluctuate more or less dependent on whether the introduced factor stabilizes or perturbs the system. The accuracy of the Clarity Autoscan US system in 3 directions, anterior–posterior, left–right, and superior–inferior, has been reported using a QA phantom in a semi-stationary condition.17 However, an independent tracking system in conjunction with a pelvic phantom on a motion platform treated under typical treatment conditions has not previously been used to verify the accuracy of the Clarity Autoscan US tracking. In this study, we verified the US tracking accuracy with the independent optical tracking system under typical treatment conditions (beam-on). This allowed us to examine the impact of radiation on the electronic processing of the US system, which is present during actual patient treatments.
An important question is to what extent the phantom tracking results reported here are potentially biased by the lack of prostate deformation that occurs in patients. For patients, a pretreatment US is acquired and registered interactively to the simulation US by a therapist in the treatment room. In this process, the therapist moves the table to correct for discrepancies in prostate location and shape between the pretreatment US and the simulation US. While intrafractional motion of the prostate may be associated with some shape changes, this change is very small for the small prostate displacements that the system tracks by calculating the cost function between the pretreatment image and during treatment US images that are both acquired in the treatment room during the delivery session. Thus, for the particular task of intrafractional tracking (evaluated in this manuscript), prostate shape changes are likely to be very small, while the prostate is within the allowable treatment margins.
Three millimeters is the maximum displacements that we allow clinically based upon an additional margin given to the treatment target during planning in order to account for prostate motion. Clinically, the idea is that if there is a margin of 3 mm placed on the radiation target (prostate), and the prostate moves at most 3 mm in any direction during treatment, the prostate will still lie within the radiation beam. The beam will be held if the prostate moves more than 3 mm in any direction, until the target returns to the proper location. The 10- and 20-second periods were chosen to evaluate how fast and accurately the system can detect the motion. We did not attempt faster motion as the ultrasound probe and gel would have completely decoupled and prevent US imaging during the experiments.
A clinical case example involving standard prostate treatment protocols was used to demonstrate the clinical impact and relevance of US intrafractional prostate monitoring. Prostate motion during radiation treatment is expected; however, with current common on-board IGRT capabilities, it is impossible to determine the extent of this motion and its clinical impact. A recent study evaluated the potential for using TPUS as a means of pretreatment patient positioning for prostate radiotherapy.23 While they did not evaluate US monitoring during beam-on, their data showed a strong agreement between cone-beam CT and TPUS pretreatment patient positioning. Such agreement was also observed in our clinical case example. Importantly, our example also demonstrates that cross-modality IGRT comparisons are only valid if there is a way to ensure that the target has not moved between image acquisitions.
In the case, we present the prostate motion was undetected by standard cone beam CT IGRT protocol and only discovered with US prostate monitoring. Small random movements of the prostate during radiation treatment may not result in large clinical impact. However, a stable large shift in prostate position, as described in this clinical case example, could result in missing the clinical target during radiation treatment. Typical margins placed on prostate targets in order to account for small deviations in prostate position during radiation treatment are around 2 to 3 mm. In this clinical example, we show that a positional deviation of 1 cm is possible and could potentially go undetected by standard IGRT protocols. This can potentially result in missing the treatment area without even recognizing the error. As presented in the current clinical case example, the US tracking system would be able to recognize this shift and corrective actions taken prior to treatment initiation or even during beam-on. Although the motion was detected prior to initiating the beam, and thus one could argue this is interfractional monitoring, the prostate deviation took place during the treatment process workflow, after the patient’s treatment position was established, and thus indicates intrafractional monitoring. This error would not have been caught using the standard of care treatment process.
Conclusions
In summary, the positional and timing accuracy of the Clarity Autoscan US system were evaluated, using a male pelvic phantom, and found to be acceptable under simulated treatment conditions. Further, the clinical case example of prostate motion during radiation treatment presented here clearly demonstrates the applicability of US intrafractional prostate monitoring and its clinical impact. Therefore, it is feasible that the Clarity Autoscan US system can be used on a daily basis for IGRT with the advantage of no additional radiation dose from imaging.
Acknowledgments
The authors acknowledge Dave Cooper for his training and instruction on the use of the Clarity Autoscan ultrasound system.
Abbreviations
- COM
center of mass
- CT
computed tomography
- fps
frames per second
- IGRT
image-guided radiation therapy
- RMSE
root mean square error
- TAUS
transabdominal ultrasound
- TPUS
transperineal ultrasound
- US
ultrasound
- VMAT
volumetric-modulated arc therapy.
Footnotes
Declaration of Conflicting Interests: The author(s) declared no potential conflicts of interest with respect to the research, authorship, and/or publication of this article.
Funding: The author(s) received the following financial support for the research, authorship, and/or publication of this article: Dimitre Hristov is a recipient of a research grant from Elekta.
References
- 1. Das S, Liu T, Jani AB, et al. Comparison of image-guided radiotherapy technologies for prostate cancer. Am J Clin Oncol. 2014;37(6):616–623. [DOI] [PubMed] [Google Scholar]
- 2. Kitamura K, Shirato H, Shimizu S, et al. Registration accuracy and possible migration of internal fiducial gold marker implanted in prostate and liver treated with real-time tumor-tracking radiation therapy (RTRT). Radiother Oncol. 2002;62(3):275–281. [DOI] [PubMed] [Google Scholar]
- 3. Ng JA, Booth JT, Poulsen PR, et al. Kilovoltage intrafraction monitoring for prostate intensity modulated arc therapy: first clinical results. Int J Radiat Oncol Biol Phys. 2012;84(5):e655–e661. doi:10.1016/j.ijrobp.2012.07.2367. [DOI] [PMC free article] [PubMed] [Google Scholar]
- 4. Simon J, Eschwège F, El Hajj L, et al. Epinal# 2: 409 patients overexposed during radiotherapy for prostate cancer after daily use of portal imaging controls. Int J Radiat Oncol Biol Phys. 2010;78:S361. [Google Scholar]
- 5. Ten Haken RK, Forman JD, Heimburger DK, et al. Treatment planning issues related to prostate movement in response to differential filling of the rectum and bladder. Int J Radiat Oncol Biol Phys. 1991;20(6):1317–1324. [DOI] [PubMed] [Google Scholar]
- 6. Murphy MJ, Eidens R, Vertatschitsch E, Wright JN. The effect of transponder motion on the accuracy of the Calypso electromagnetic localization system. Int J Radiat Oncol Biol Phys. 2008;72(1):295–299. doi:10.1016/j.ijrobp.2008.05.036. [DOI] [PubMed] [Google Scholar]
- 7. Zhu X, Bourland JD, Yuan Y, et al. Tradeoffs of integrating real-time tracking into IGRT for prostate cancer treatment. Phys Med Biol. 2009;54(17):N393–N401. doi:10.1088/0031-9155/54/17/N03. [DOI] [PubMed] [Google Scholar]
- 8. Cury FL, Shenouda G, Souhami L, et al. Ultrasound-based image guided radiotherapy for prostate cancer: comparison of cross-modality and intramodality methods for daily localization during external beam radiotherapy. Int J Radiat Oncol Biol Phys. 2006;66(5):1562–1567. doi:10.1016/j.ijrobp.2006.07.1375. [DOI] [PubMed] [Google Scholar]
- 9. Rathaus V, Richter S, Nissenkorn I, Goldberg E. Transperineal ultrasound examination in the evaluation of prostatic size. Clin Radiol. 1991;44(6):383–385. [DOI] [PubMed] [Google Scholar]
- 10. Trivedi A, Ashikaga T, Hard D, et al. Development of 3-dimensional transperineal ultrasound for image guided radiation therapy of the prostate: early evaluations of feasibility and use for inter-and intrafractional prostate localization. Pract Radiat Oncol. 2017;7(1):e27–e33. [DOI] [PubMed] [Google Scholar]
- 11. Langen KM, Pouliot J, Anezinos C, et al. Evaluation of ultrasound-based prostate localization for image-guided radiotherapy. Int J Radiat Oncol Biol Phys. 2003;57(3):635–644. [DOI] [PubMed] [Google Scholar]
- 12. Fargier-Voiron M, Presles B, Pommier P, et al. Impact of probe pressure variability on prostate localization for ultrasound-based image-guided radiotherapy. Radiother Oncol. 2014;111(1):132–137. doi:10.1016/j.radonc.2014.02.008. [DOI] [PubMed] [Google Scholar]
- 13. Baker M, Behrens CF. Determining intrafractional prostate motion using four dimensional ultrasound system. BMC cancer. 2016;16:484. [DOI] [PMC free article] [PubMed] [Google Scholar]
- 14. Ballhausen H, Li M, Hegemann N, Ganswindt U, Belka C. Intra-fraction motion of the prostate is a random walk. Phys Med Biol. 2014;60(2):549–563. [DOI] [PubMed] [Google Scholar]
- 15. Ricardi U, Franco P, Munoz F, et al. Three-dimensional ultrasound-based image-guided hypofractionated radiotherapy for intermediate-risk prostate cancer: results of a consecutive case series. Cancer Invest. 2015;33(2):23–28. [DOI] [PubMed] [Google Scholar]
- 16. Abramowitz MC, Bossart E, Flook R, et al. Noninvasive real-time prostate tracking using a transperineal ultrasound approach. Int J Radiat Oncol Biol Phys. 2012;84:1 doi:10.1016/j.ijrobp.2012.07.145. [Google Scholar]
- 17. Lachaine M, Falco T. Intrafractional prostate motion management with the clarity autoscan system. Med Phys Int. 2013;1:72–80. [Google Scholar]
- 18. Brooks R. Intrafraction prostate motion correction using a non-rectilinear image frame. Prostate cancer imaging image analysis and image-guided interventions. In: Madabhushi A, Dowling J, Huisman H, Barratt D. eds. Proceedings of International Workshop, Held in Conjunction with MICCAI 2011, Toronto, Canada, September 22, 2011 Berlin, Heidelberg: Springer Berlin Heidelberg; 2011:57–59. doi:10.1007/978-3-642-23944-1_6. [Google Scholar]
- 19. O’Shea T, Bamber J, Fontanarosa D, van der Meer S, Verhaegen F, Harris E. Review of ultrasound image guidance in external beam radiotherapy part II: intra-fraction motion management and novel applications. Phys Med Biol. 2016;61(8):R90–R137. doi:10.1088/0031-9155/61/8/R90. [DOI] [PubMed] [Google Scholar]
- 20. Schlosser J, Salisbury K, Hristov D. Telerobotic system concept for real-time soft-tissue imaging during radiotherapy beam delivery. Med phys. 2010;37(12):6357–6367. doi:10.1118/1.3515457. [DOI] [PubMed] [Google Scholar]
- 21. Kupelian P, Willoughby T, Mahadevan A, et al. Multi-institutional clinical experience with the Calypso System in localization and continuous, real-time monitoring of the prostate gland during external radiotherapy. Int J Radiat Oncol Biol Phys. 2007;67:1088–1098. [DOI] [PubMed] [Google Scholar]
- 22. Li M, Ballhausen H, Hegemann NS, et al. A comparative assessment of prostate positioning guided by three-dimensional ultrasound and cone beam CT. Radiat Oncol. 2015;10:82 doi:10.1186/s13014-015-0380-1. [DOI] [PMC free article] [PubMed] [Google Scholar]
- 23. Fargier-Voiron M, Presles B, Pommier P, et al. Evaluation of a new transperineal ultrasound probe for inter-fraction image-guidance for definitive and post-operative prostate cancer radiotherapy. Phys Med. 2016;32(3):499–505. doi:10.1016/j.ejmp.2016.01.481. [DOI] [PubMed] [Google Scholar]


