

Abstract
Parkinson disease (PD) is associated with oxidative stress and decreased nigral glutathione (GSH) suggesting that therapies that boost GSH may have a disease-modifying effect. Intravenous administration of a high dose of N-acetylcysteine (NAC), a well-known antioxidant and GSH precursor, increases blood and brain GSH in individuals with PD, Gaucher disease, and healthy controls. To characterize the pharmacokinetics of repeated high oral doses of NAC and their effect on brain and blood oxidative stress measures, we conducted an open-label, prospective 4-week study of oral NAC in individuals with PD (n=5) and healthy controls (n=3). Brain GSH was measured in the occipital cortex using 1H-MRS at 3- and 7-tesla before and after 28 days of 6000 mg NAC/day. Blood was collected prior to dosing and at predetermined collection times before and after the last dose to assess NAC, cysteine, GSH, catalase, malondialdehyde (MDA) and 4-hydroxynonenal (4-HNE) concentrations and reduced-to-oxidized GSH ratio (GSH/GSSG). Symptomatic adverse events were reported by three of the five subjects with PD. NAC plasma concentration-time profiles were described by a first-order absorption, one-compartment pharmacokinetic model. While peripheral antioxidant measures (catalase and GSH/GSSG) increased significantly relative to baseline, indicators of oxidative damage, i.e., measures of lipid peroxidation (4-HNE and MDA) were unchanged. There were no significant increases in brain GSH, which may be related to low oral NAC bioavailability and small fractional GSH/GSSG blood responses. Additional studies are needed to further characterize side effects and explore the differential effects of NAC on measures of antioxidant defense and oxidative damage.
Keywords: N-acetylcysteine, Parkinson Disease, glutathione, neurodegeneration, pharmacokinetics, oxidative stress, antioxidant, magnetic resonance spectroscopy, phase II, clinical study
Introduction
Parkinson Disease (PD) affects over one million Americans and is expected to double in prevalence worldwide by 2030.1 Currently, there is no disease-modifying treatment available. Multiple factors including oxidative stress, mitochondrial impairment, lysosomal or proteasomal dysfunction, and glutathione (GSH) depletion are thought to contribute to the pathogenesis of PD.2–8 Decreased nigral GSH levels in post-mortem brains have been reported.2 The reduction in GSH or alteration in GSH redox status may occur early in PD progression and could be a result of oxidative stress.4 GSH, the most abundant low-molecular-weight thiol, is a necessary constituent of cells that provides antioxidant and electrophile defenses, and acts as a redox buffer.9 GSH/glutathione disulfide (GSSG) is the major redox couple in human cells and blood GSH and/or GSH/GSSG are depleted in neurodegenerative disorders such as PD where oxidative stress is suspected.10–13 Thus, therapies that boost GSH may have a disease-modifying effect on PD.
N-acetylcysteine (NAC), a well-known antioxidant, is a prescription product for treating cystic fibrosis and acetaminophen overdose and is also widely available as a dietary supplement. Its reported mechanisms of action include direct free radical scavenging and antioxidant effects, as well as serving as a precursor to cysteine (Cys), the rate-limiting amino acid needed for GSH synthesis. Long-term oral administration of NAC in a PD mouse model substantially reduced neuronal loss, oxidative stress, and motor abnormalities.14,15 Recently, a combination IV/oral NAC therapy was reported to decrease symptoms in individuals with PD.16
We previously showed that a single intravenous dose of NAC increased blood and brain (cortical) GSH levels in individuals with PD, Gaucher disease, and healthy controls.17 However, intravenous dosing is not practical for long-term use. Thus, the objective of this study was to characterize NAC pharmacokinetics in individuals with PD and healthy controls and evaluate its effect on blood and brain glutathione following repeated oral dosing. Secondary aims were to measure tolerability and clinical outcomes using the Unified Parkinson’s Disease Rating Scale (UPDRS), to evaluate NAC’s effect on other systemic measures of oxidative stress (catalase, malondialdehyde (MDA) and 4-hydroxynonenal (4-HNE)), and to determine if brain GSH concentrations measured using 3 T magnetic resonance spectroscopy (MRS) were comparable to those obtained at 7 T, which would allow use of the MRS technology on a widely available 3 T platform in future work.
Methods
This open-label, prospective, 4-week study of high-dose oral NAC was approved by the Minnesota Human Research Protection Program, the Food and Drug Administration (IND #123269) and was listed on ClinicalTrials.gov: NCT# NCT02212678. The procedures followed were in accordance with the Minnesota Human Research Protection Program, the Food and Drug Administration, and the World Medical Association Declaration of Helsinki. All participants gave written, informed consent before enrollment. Individuals with PD and healthy controls were recruited from the University of Minnesota’s Movement Disorders Center and from flyers. All participants were on stable medication regimens for at least 1 month before enrollment. The use of antioxidant supplements, including coenzyme Q-10 and vitamin E, was not allowed within 3 weeks of enrollment. Individuals with a history of asthma or bronchospasm were excluded from the study.
Baseline Measurements
Age, ethnicity, sex, disease duration, weight, smoking status, use of alcohol and illicit drugs, UPDRS scores (I–III), Hoehn and Yahr staging, medications, supplements, and vital signs were recorded at baseline. Each subject had magnetic resonance spectroscopy scans at 3 T and 7 T to measure brain GSH. Blood was collected to measure NAC, Cys, GSH, GSH/GSSG, catalase, MDA and 4-HNE.
NAC Dosing
Recent controlled, clinical trials used NAC doses of 1200 to 8000 mg/day given from 4 weeks to 6 months with no reported major safety concerns. For example, 8000 mg/kg/day NAC was given for 8 weeks to individuals with HIV.9 Another study gave NAC for 4 weeks at a dose of 2700 mg NAC/day in children which corresponds to an adult dose of ~6300 mg/day.7 Both of these studies reported changes in blood GSH concentrations7,9. Thus, based on these clinical reports, we chose a dose near the upper end of the doing range and a 4 week treatment duration which would likely identify a pharmacological effect while minimizing risks to subjects.
600 mg N-acetylcysteine capsules were purchased from Swanson Health Products, Fargo, ND. Verification of content and purity was provided. Each subject was provided NAC capsules and instructed to take two oral doses (3000 mg) of NAC daily (6000 mg/day), one in the morning and one in the evening. Compliance and adverse events were assessed weekly via a telephone survey. Subjects also completed a medication diary, which was reviewed during the final study visit.
Post-NAC measurements
After 28 days, subjects returned for the final study visit. Blood was collected upon arrival, neurological examination was completed and UPDRS scores were recorded. Subjects then received the final dose of NAC and blood was collected approximately at 30, 60, 120, 180, 240, 300, and 360 min thereafter. Approximately 2 hours after the final dose, brain GSH levels were measured using 7 T MRS followed by 3 T MRS. All post-NAC scans were started within 2 hours of the pre-dose scan start time per individual with most post-NAC scans completed within 30 minutes of the pre-NAC scan completion time.
MRS methodology
Brain MR scans were performed at 7 T using a 90-cm horizontal bore magnet (Siemens MAGNETOM) and a quadrature surface coil, and at 3 T using a 92-cm horizontal bore magnet (Siemens Trio) and a 32 channel phased-array Siemens head coil as described previously.18,19 Images were acquired with a MPRAGE sequence and used for selection of the volume-of-interest (VOI). All first- and second-order shims were adjusted using FASTMAP with echo-planar imaging readout.20 Spectra were acquired from the occipital cortex (22 × 22 × 22 mm3) with a modified semi-LASER sequence (echo time TE = 26 ms for 7 T, 28 ms for 3 T, repetition time TR = 5 s).21 Unsuppressed water spectra acquired from the same VOI were used to remove residual eddy current effects and as a quantification reference. Single-shot data were saved during acquisition; individual FIDs were frequency and phase corrected prior to summation. Metabolites were quantified using LCModel22 as previously described18,21 with the following metabolites in the basis set: alanine (Ala), aspartate (Asp), ascorbate (Asc), glycerophosphocholine (GPC), phosphocholine (PCho), creatine (Cr), phosphocreatine (PCr), γ‐aminobutyric acid (GABA), glucose (Glc), glutamine (Gln), glutamate (Glu), GSH, myo-Inositol (Ins), lactate (Lac), N-acetylaspartate (NAA), N-acetylaspartylglutamate (NAAG), phosphoethanolamine (PE), scyllo‐inositol (sIns) and taurine (Tau). The metabolite model spectra were generated based on previously reported chemical shifts and coupling constants.23 Macromolecule spectra were acquired at both fields from the occipital cortex using an inversion recovery sequence (TR = 2 seconds and inversion time = 0.68 seconds at 7 T, TR = 2.5 s and TI = 0.75 s at 3 T). Only metabolites that were fitted with average Cramér-Rao lower bounds (estimated error of the metabolite quantification) equal or less than 20% are reported. Whenever resonances were not sufficiently resolved (correlation coefficient r < −0.7 in most spectra), metabolite concentrations were reported as sums, i.e., tCr = Cr + PCr, tCho = GPC + PCho. Similarly, Glc+Tau was reported since Glc did not pass the CRLB inclusion criterion and these metabolites tend to correlate. Concentrations were not corrected for cerebrospinal fluid contribution to the VOI.
Measurement of NAC, Cys, GSH, and GSH/GSSG
Reduced-to-oxidized GSH ratio (GSH/GSSG) was measured in whole blood using high performance liquid chromatography (HPLC) coupled to a mass spectrometer (MS) as previously reported.17 Total (both protein bound and unbound) concentrations of NAC, Cys and GSH were measured in plasma using a validated HPLC-MS assay. For the analysis of plasma samples, calibration standards were prepared, which consisted of six standards that combined Cys (range of 1–100 μg/mL), GSH (range of 0.5–100 μg/mL), and NAC (range of 1–1000 μg/mL). Plasma quality control (QC) standards (n=3) were prepared prior to analysis using diluted plasma (1:1 with 20mM ammonium formate buffer) and solubilized Cys, NAC, and GSH in buffer. QC standards were frozen at −20°C until day of analysis. Volumes for sample processing were as follows: 250 μL plasma, 50 μL internal standard, 100 μL 0.05 mg/mL dithioerythritol (DTE), 100 μL buffer, and 50 μL calibration standard (if appropriate). The internal standard concentration was 20μg/mL for deuterated GSH, Cys and NAC. A “blank” plasma sample containing only 250 μL diluted plasma was included for subtraction of background. All calibration standards were analyzed in triplicate. QC standards were analyzed in quadruplicate.
All samples were incubated in a water bath shaker for 30 min at 37°C and 85 rpm. Following incubation, 2 mL of methanol was added to each tube to precipitate the protein. All samples were centrifuged at 2000 rpm for 10 min. The organic layer was conserved and evaporated at 37°C by gaseous nitrogen (15 psi) using a TurboVap® LV Concentration Evaporator. Sample contents were reconstituted in 300 μL of buffer and filtered through Acrodisc® nylon syringe filters into HPLC vials for analysis.
Plasma, red blood cell, and whole blood samples were analyzed by a Hewlett-Packard 1100 series (Agilent Technologies, Santa Clara, CA) HPLC with a quadrupole mass spectrometer. Briefly, analytes were separated using a Zorbax Eclipse (Agilent Technologies) XDB C18 column (150 × 3.0 mm, 3.5μ particle size) with a mobile phase consisting of 20 mM ammonium formate buffer (pH 3.5) and acetonitrile (Sigma; 98:2 vol/vol). Analytes were detected in negative ion mode with quantitation ions at m/z 120, m/z 162 and m/z 306 for Cys, NAC, and GSH, respectively. The deuterated forms of Cys, NAC, and GSH were used as internal standards and quantified at m/z 122, m/z 165, and m/z 309, respectively. The flow rate was 0.35 mL/min, and the run time was 10 min.
Calibration curves were constructed for each analyte in plasma and blood using peak area response ratios of analyte to internal standard and known concentration. Concentrations of NAC, Cys, and GSH were calculated from the appropriate calibration curve. The lower limit of quantitation (LLOQ) was 1 μg/mL for NAC and Cys and 0.5 μg/mL for GSH
Measurement of catalase, MDA, and 4-HNE
Catalase enzyme activity was measured in red blood cell lysate using a Catalase Assay kit (Cayman Chemical, Ann Arbor, MI) as per manufacturer’s instructions. Lipid peroxidation markers, MDA and 4NHE were measured in plasma using a TBARS (TCA method) assay kit (Cayman Chemical, Ann Arbor, MI) and an OxiSelect™ HNE Adduct Competitive ELISA Kit (Cell Biolabs, Inc., San Diego, CA), respectively as per manufacturer’s protocol.
Pharmacokinetic and Statistical Analysis
Descriptive statistics were calculated for all concentration data. The Wilcoxon signed rank test was used to assess differences in blood GSH/GSSG, brain GSH, catalase, 4-HNE, and MDA before and after NAC dosing. The rank test, although not as commonly used, is a non-parametric test that is likely more appropriate given the small number of subjects in this study.
Non-compartmental analysis was used to estimate each subject’s pharmacokinetic parameter values for total NAC, Cys, and blood GSH (Phoenix WinNonlin 6.3, Pharsight Corp., NC, USA). Steady-state was assumed based on an expected half-life of between 2 and 6 hours (hrs).24,25 Maximum concentration (Cmax), time at which maximum concentration is observed (Tmax), minimum concentration (Cmin), and area under the time-concentration curve (AUC) from time 0 to 6 hrs were reported for NAC, Cys, and blood GSH. In addition, terminal phase half-life (t1/2) was reported for NAC. Descriptive statistics were used to summarize the PK parameter estimates for the PD and control groups separately and combined.
NAC concentration-time profiles for all subjects were simultaneously analyzed using population pharmacokinetic models (Phoenix NLME (version 1.2, Pharsight Corp., NC, USA). Given that NAC has a reported half-life of 2–6 hrs and the subjects had received NAC for 28 days prior to the final dose used for PK, steady-state conditions were assumed. One-and two- compartment pharmacokinetic models were evaluated. First-order absorption with a rate constant Ka was included in all models. The first-order conditional estimation method was used. Study group (PD or controls) was evaluated as covariate. The best fit model was determined by successful minimization, the objective function value, visual observation of goodness of fit plots (for example, predicted vs. observed concentration, residual vs. time, residual vs. concentration), and precision of model parameters. Additive, proportional, and combined error models were explored.
Results
Demographic and Clinical Data
Five individuals (3 female, 2 male) with mild-moderate (Hoehn and Yahr stage 2) PD and 3 control subjects (1 female, 2 male) were enrolled in this study and given NAC (Table 1). Four individuals with PD and three healthy controls completed the study. The UPDRS pre-NAC scores in patients with PD ranged from 20–42, with a mean of 32.6 (Figure 1). The UPDRS post-NAC scores in PD subjects ranged from 23–48, with a mean score of 36.6. The UPDRS pre-NAC scores in healthy controls ranged from 3–4, with a mean of 3.6 (Figure 1). The UPDRS post NAC scores in healthy controls ranged from 4–7 with a mean score of 5.6. All subjects with PD were on at least one anti-parkinsonian medication (Table 2).
Table 1.
Study Demographics and Baseline and Post-NAC UPDRS Scores
| Group | # Sbj. Enrolled | Age1 | Sex1 | Weight1 | UPDRS2 Pre-NAC1 | UPDRS2 Post-NAC1 | # Sbj. Completed Study |
|---|---|---|---|---|---|---|---|
|
| |||||||
| PD | 5 | 65 (54–73) | (3F/2M) | 162 (132–178) | 32.6 (20–42) | 36.6 (23–48) | 4 |
| HC | 3 | 78 (74–84) | (1F/2M) | 153 (137–193) | 3.6 (3–4) | 5.6 (4–7) | 3 |
: mean (range)
: total UPDRS I–III
Figure 1.
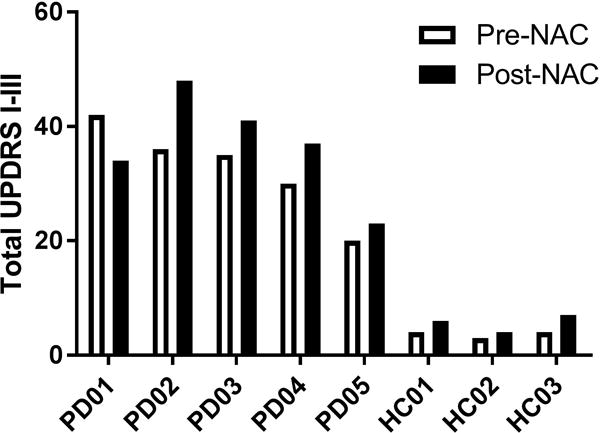
Table 2.
Total Daily Doses (mg) of PD Medications
| Subject | levodopa/carbidopa | amantadine | isradapine | pramipexole | trihexyphenidyl | rasagiline |
|---|---|---|---|---|---|---|
|
| ||||||
| A | 75/300 | 200 | 1.5 | |||
| B | 300 | 3 | ||||
| C | 3 | 4 | 2 | |||
| D | 75/300 | |||||
| E | 10 | |||||
Adverse events (AEs) were noted in 3 of the 5 individuals with PD and 1 of 3 healthy controls. Mild indigestion was reported in all 4 of these individuals which persisted for the entire 4 weeks they were on NAC. In addition, increased drooling and mild to moderate increases in tremor were noted in three patients including one individual who withdrew from the study after 5 days of dosing due to increased tremor. Another patient who remained in the study developed freezing of gait, which resolved at the end of the study after NAC discontinuation. For all 3 patients with AEs, symptoms returned to baseline within 3 days to 2 weeks after NAC discontinuation. Following oral NAC, UPDRS scores increased in 4 of 5 individuals with PD (Figure 1). The individuals with the greatest increases in UPDRS were also those that had increased parkinsonian symptoms.
NAC, Cys, and GSH pharmacokinetics
The total NAC, GSH, and Cys concentration-time profiles acquired on the last day of dosing are illustrated in Figure 2. Non-compartmental analysis was used to determine Cmax, Cmin, Tmax, AUC (0–6), and t1/2 for each subject individually and summarized in Table 3 by group. Maximum concentrations of NAC and Cys were attained between 30 and 90 minutes with Cys exposures greater than those of the parent drug. While NAC and Cys concentrations were significantly elevated from baseline, plasma GSH remained very low and essentially unchanged during the 6 hours of monitoring. The decline in NAC concentrations appears to be log-linear (mono-exponential) with an elimination half-life ranging from 2–8 hours.
Figure 2.
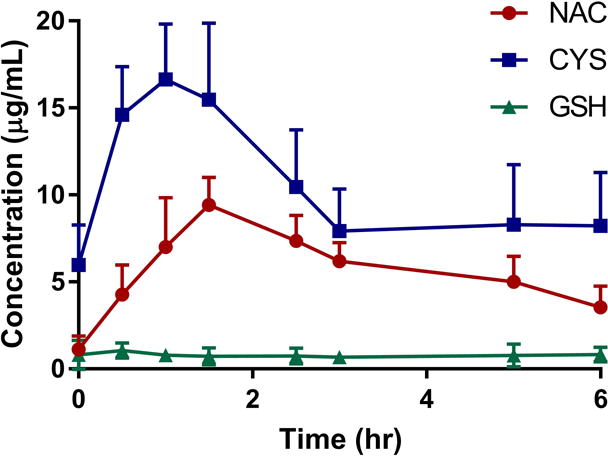
Table 3.
NAC, Cys, and GSH PK parameters using non-compartmental analysis for a single dose (3000 mg) of NAC at steady-state
| PD (n=4) | HC (n=3) | ||||||
|---|---|---|---|---|---|---|---|
|
| |||||||
| PK Parameter | Mean | SD | CV% | Mean | SD | CV% | |
| NAC | Tmax (min) | 82.5 | 15.0 | 18 | 90 | 34.6 | 27 |
| Cmin (μg/mL) | 0.20 | 0.36 | 17 | 1.4 | 0.45 | 26 | |
| Cmax (μg/mL) | 11.0 | 3.1 | 28 | 7.3 | 2.7 | 37 | |
| AUC(0–6) (μg*min/mL) | 2111 | 453 | 21 | 1690 | 336 | 20 | |
| t1/2 (hr) | 4.6 | 3.3 | 73 | 5.9 | 3.6 | 62 | |
|
| |||||||
| Cys | Tmax (min) | 60 | 34.6 | 58 | 70 | 17.3 | 25 |
| Cmin (μg/mL) | 5.0 | 2.9 | 58 | 6.6 | 8.7 | 130 | |
| Cmax (μg/mL) | 15.1 | 8.81 | 58 | 25.7 | 5.0 | 20 | |
| AUC(0–6) (μg*min/mL) | 2537 | 1625 | 64 | 5139 | 3880 | 75 | |
|
| |||||||
| GSH | Tmax (min) | 40 | 45.8 | 115 | 105 | 135 | 129 |
| Cmin (μg/mL) | 0.81 | 0.10 | 13 | 0.36 | 0.37 | 102 | |
| Cmax (μg/mL) | 1.30 | 0.44 | 28 | 0.92 | 0.20 | 22 | |
| AUC(0–6) (μg*min/mL) | 302 | 33.2 | 11 | 187 | 114 | 61 | |
NAC population PK modeling
The NAC concentration-time profiles were best fit by a first order absorption, one-compartment PK model. Population and individual predicted versus observed concentration plots are shown in Figure 3. Population estimates of Ka, CL, and V are provided in Table 4. Because the profiles for those with PD and healthy controls were similar, PK model parameters were estimated for both groups together. The addition of study group as a covariate did not further explain variability in clearance or volume, so study group was not included in the final model (objective function of 189 with covariate versus 190 without covariate). The precision values of the model parameters were adequate (CV < 40%). Inter-individual variability was estimated for clearance and volume of distribution using an exponential model. A proportional error model best described the residual unexplained variability of 18%.
Figure 3.
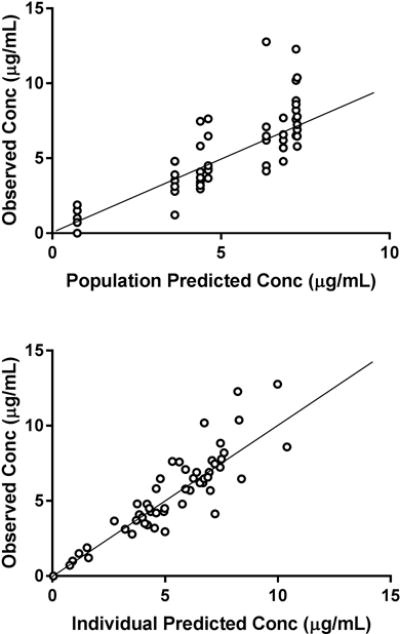
Table 4.
Compartmental pharmacokinetic parameter estimates for total NAC following a single dose (3000 mg) of NAC at steady-state
| Param. Estimate | RSE% | IIV | RSE% | |
|---|---|---|---|---|
|
| ||||
| Dose (mg/kg) | ||||
|
| ||||
| Ka (hr−1) | 0.79 | 33 | a | a |
| V/F (L) | 269 | 30 | 40% | 49 |
| CL/F (L/hr) | 66.6 | 6.5 | 12% | 6.7 |
|
| ||||
| RUV | 18% | 20 (CV%) | ||
: unable to estimate due to high shrinkage (>40%)
Ka: absorption rate constant, V: volume of distribution, F: oral bioavailability, CL: steady-state clearance, RUV: random unexplained variability, RSE: relative standard error, IIV: inter-individual variability
Systemic measures of oxidative stress
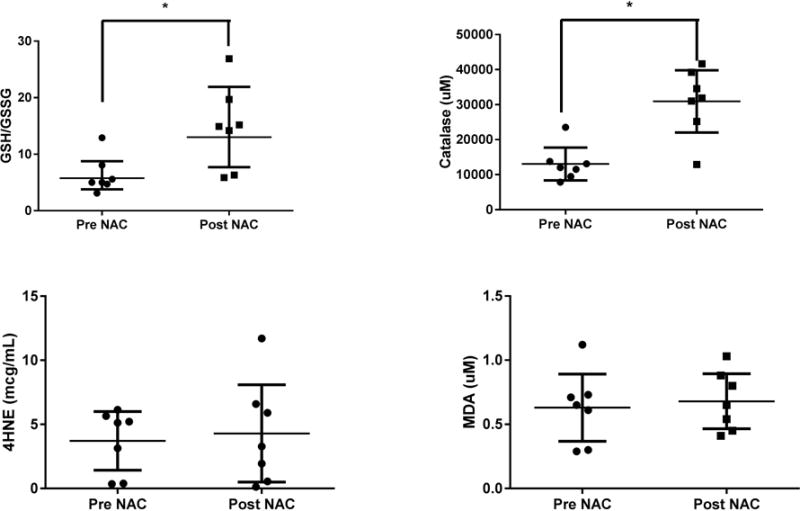
Blood catalase and GSH/GSSG, measures of anti-oxidant capacity, significantly increased after NAC dosing (p <0.05, Wilcoxon rank test pre vs. post, Figure 4). Catalase concentrations ranged from 7837 to 23531 μM prior to dosing and 12906 to 41662 μM post-NAC. The average percent increase was 109% and 215% for the healthy and PD groups, respectively. GSH/GSSG ratios ranged from 3.1 to 13.1 prior to dosing and from 5.87 to 26.9 post-NAC. While the baseline ratios were similar for both groups, the average percent increases were 18% and 231% for the healthy and PD groups, respectively. While there was a significant increase from baseline to prior to the final dose, concentrations were relatively stable throughout the dose interval (data not shown). In addition, there was good agreement between the catalase and GSH/GSSG measures for all subjects with one exception. HC01 had increased catalase but decreased GSH/GSSG. Contrary to catalase and redox, 28 day NAC dosing did not result in significant changes in the measures of lipid peroxidation, 4-HNE and MDA (Figure 4). 4-HNE in particular was highly variable among individuals with a 17-fold difference in baseline values. 4-HNE concentrations ranged from 0.36 to 6.14 μg/mL prior to dosing and 0.13 to 11.7 μg/mL post-NAC. The average percent change was an increase of 6% for the healthy and 3% for the PD groups. Similarly, MDA levels did not change significantly with NAC therapy. MDA concentrations ranged from 0.3 to 1.1 μM prior to dosing and 0.45–1.0 μM post-NAC. The average percent changes were increases of 68% and 20% for the healthy and PD groups, respectively.
Figure 4.
Brain MRS Measurements
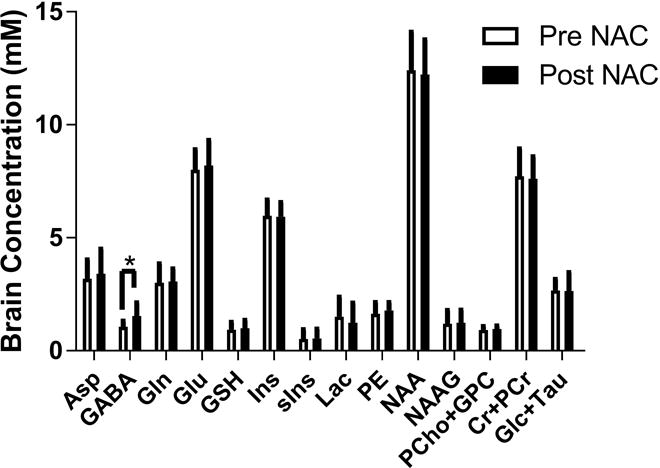
Oral NAC had no statistically significant effect on brain GSH concentrations; although a trend to increase was observed post NAC (Figure 5). The percent change in brain GSH using 7 T MRS was ~6% (p=0.3) and ~10% using 3 T MRS (p=0.06). In general, there was agreement (R2 = 0.78) between 3 T and 7 T GSH concentrations (Figure 5). The only change observed in the other neurochemicals was an increase in GABA at the p=0.04 level (Figure 6). One of the subjects did not complete a 3 T scan.
Figure 5.
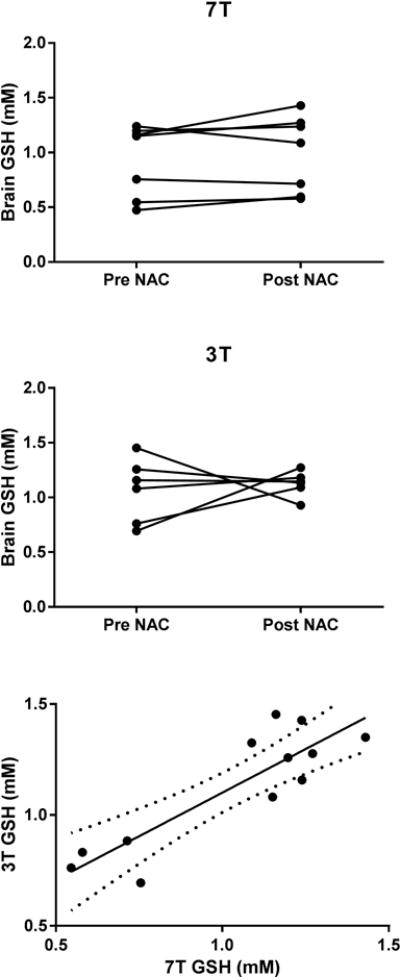
Figure 6.
Discussion
NAC’s primary mechanism of action is hypothesized to be through its deacetylated product Cys, which is the rate-limiting substrate for GSH synthesis. A 4-week, high oral NAC dose regimen resulted in significant increases in Cys, and the blood antioxidant measures: GSH/GSSG and catalase. However, it did not reduce the measures of oxidative damage in the blood: 4HNE and MDA. Additionally, NAC did not increase GSH brain concentrations. Finally, this study showed that some people with PD had worsening of their Parkinsonian symptoms with high doses of NAC that resolved with discontinuation of therapy.
The NAC PK parameter estimates were consistent with published literature26,27 and there were no discernable differences between patients with PD and healthy individuals. However, the limited number of subjects did not allow for robust comparisons. We showed that NAC exposure following oral dosing is much lower than after IV dosing19, which is consistent with previous reports of low oral bioavailability (~4–10%) and high first pass metabolism.24,28 The low oral NAC exposure may explain the lack of a significant increase in brain GSH that was observed in this study. This is in contrast to a previously reported ~30% increase in brain GSH when a single NAC dose was administered intravenously.17 The low oral NAC exposure may also explain the difference in blood GSH/GSSG outcomes between oral and IV dosing. Oral NAC significantly increased GSH/GSSG in blood by almost 2-fold, but this was much smaller than the increase seen with IV dosing (>100-fold). It is well documented that a primary role of NAC when administered orally is to act as a precursor to Cys, which is used in GSH synthesis. The results of our study are consistent with this mechanism in that increases in Cys concentration closely followed that of NAC. However, these substantial increases in plasma Cys did not translate into increased brain GSH suggesting that oral NAC may modulate brain GSH through other mechanisms.
One limitation of this study is that the sample size may not have been large enough to detect significant increases in brain GSH. The sensitivity of the 7 T approach to detect differences in GSH concentration for small sample sizes such as used in this study has been reported to be approximately 20%.38 Therefore it is possible that a brain response to oral NAC was below the detection threshold. However, the trend of increased brain GSH measured using the 7 T was in agreement with measurements using 3 T MRS, i.e. 10% (p = 0.06). This finding is noteworthy as agreement between GSH concentrations measured at 3 T and 7 T has been previously difficult to show due to limited distribution in subjects’ brain GSH concentrations. It is also possible that with further validation29 and possibly with appropriate management of multi-site issues30,31, brain GSH concentration response to NAC could be monitored using 3 T MRS, which is more widely available than 7 T MRS. An ancillary finding was a significant increase in GABA concentrations following 4 weeks NAC dosing. This change in GABA will need to be replicated in a larger study to determine if it is a robust finding and if there is a relationship between GABA any other laboratory or clinical features of subjects.
Oxidative stress has been implicated in the pathology of PD.32 While reactive oxidant species are necessary to maintain cellular homeostasis, oxidative stress either via an overabundance of reactive oxidant species or a decrease in antioxidant capacity can lead to cellular damage. We have shown that high dose oral NAC can increase peripheral antioxidant measures. In agreement with our observations, there are several reports of increased antioxidant GSH/GSSG ratios with oral NAC therapy.33–35 In our study, despite the observed increase in antioxidant capacity (GSH/GSSG and catalase), oral NAC did not appreciably alter peripheral measures of oxidative damage (4-HNE and MDA). However, given that these measures were not elevated in patients, we might not expect to see a modulating effect. The lack of effect on systemic oxidative damage may also be due to an inadequate duration of NAC therapy or suboptimal dosing. It is possible that the doses in our study are too high resulting in reductive stress.36 A better understanding of NACs role in modulating these measures after oral dosing is required to address this concern. Another important consideration is whether 4-HNE and MDA represent valid oxidative damage biomarkers in PD as there have been limited studies demonstrating their validity in neurological diseases. Prabhu et al, have shown that MDA is decreased with NAC during ischemic reperfusion, suggesting that this marker is sensitive to acute changes in free radical production.37 Animal models have shown decreases in HNE after 7 days of anti-oxidant therapy, again suggesting that the effects are fairly rapid.38
In general, high dose (6000mg/day) oral NAC was well tolerated in healthy individuals with only minor indigestion noted. However, symptomatic adverse events were reported in 3 of 5 subjects with PD. These side effects were mild to moderate and reversible; resolving within a few days or weeks of stopping NAC. It is possible that the adverse events are dose-dependent, as investigators using a lower dose (1200mg NAC/day) did not observe worsening of parkinsonian symptoms, but instead patients who took 1200 mg/day in combination with IV weekly dosing reported symptomatic improvement.16 A major difference between our study and that conducted by Monti et al. was that the later study used weekly IV doses in combination with relatively low oral daily doses. There is evidence that NAC’s actions differ based on the route of administration and thus, IV dosing may produce a different result that an oral regimen(ref). Katz et al also administered high oral doses of NAC to patients with PD for two days without any reports of adverse events.39 In our study, patients typically reported increased drooling around day 2 or 3 with increased tremor 1 or 2 days later. There was also a slight worsening in clinical parameters in patients as measured by UPDRS scores. It is possible that a drug-drug interaction may have contributed to the worsening of parkinsonian symptoms in our cohort. The two subjects with the most significant increases in tremor were also on amantadine, which is an N-methyl-D-aspartate glutamate receptor antagonist. A plausible explanation is that NAC, through increased brain Cys concentrations, modulates glutamate transport. The net effect of this putative interaction would be increased extracellular glutamate which has an adverse effect on symptom control.40 Alternatively, NAC may alter the pharmacokinetics of amantadine (or other PD medications, Table 2). This could occur through interactions of enzyme systems or transporters of the intestinal or blood-brain barrier (BBB). However, a search of literature failed to reveal any reports showing that NAC effects BBB transport or the pharmacokinetics of anti-parkinsonian medications. A larger trial is needed to determine if these findings are reproducible and if they can be attributed to NAC.
Limitations of this study included the small number of individuals, the sensitivity of the brain MRS quantification approach, and the short study duration. This study adds to the mixture of patient responses to NAC that have been reported using various doses and suggests that the oral 6000mg/day dose, due to the risk of AEs, may need to be avoided. It remains unknown whether boosting antioxidant mechanisms will have a beneficial effect on PD or alter disease progression. Given the numerous failed studies using antioxidant therapies, mitigation of oxidative damage may need to focus on prevention of generation of free radicals through strategies such as stabilization of mitochondrial function.41 Further inquiry into this matter may require cellular and animal models as well as human studies to better understand these concepts.
In summary, we did not detect any changes in brain chemistry. Future studies of NAC in PD would require much larger sample sizes likely necessitating multiple sites and must take into consideration the route of administration, dosage regimen, duration of therapy, and selection of an optimal biomarker and methods for monitoring.Further, a rigorous data and safety monitoring plan should be part of any study design, so that adverse effects can be quickly identified and managed. With the considerations above in mind, well-controlled clinical trials may yet determine if NAC is beneficial in the treatment of PD.
Acknowledgments
We would like to acknowledge Laurie Hovde for measurement of 4HNE, catalase and MDA.
Sources of Support
Financial support was provided by Parkinson’s UK, NIH R01AG039396, and the University of Minnesota Foundation. The Center for Magnetic Resonance Research is supported by the National Institute of Biomedical Imaging and Bioengineering (NIBIB) grant P41 EB015894 and the Institutional Center Cores for Advanced Neuroimaging award P30 NS076408. Research reported in this publication was also supported by the National Center for Advancing Translational Sciences of the National Institutes of Health Award Number UL1TR000114. The content is solely the responsibility of the authors and does not necessarily represent the official views of the National Institutes of Health.
Footnotes
Declaration of Conflicting Interests
None of the authors have any relevant conflicts of interest to disclose.
References
- 1.Dorsey ER, Constantinescu R, Thompson JP, et al. Projected number of people with Parkinson disease in the most populous nations, 2005 through 2030. Neurology. 2007 Jan 30;68(5):384–386. doi: 10.1212/01.wnl.0000247740.47667.03. [DOI] [PubMed] [Google Scholar]
- 2.Sian J, Dexter DT, Lees AJ, et al. Alterations in glutathione levels in Parkinson’s disease and other neurodegenerative disorders affecting basal ganglia. Ann Neurol. 1994 Sep;36(3):348–355. doi: 10.1002/ana.410360305. [DOI] [PubMed] [Google Scholar]
- 3.Deganuto M, Pittis MG, Pines A, et al. Altered intracellular redox status in Gaucher disease fibroblasts and impairment of adaptive response against oxidative stress. J Cell Physiol. 2007 Jul;212(1):223–235. doi: 10.1002/jcp.21023. [DOI] [PubMed] [Google Scholar]
- 4.Beal MF. Oxidatively modified proteins in aging and disease. Free Radic Biol Med. 2002 May 01;32(9):797–803. doi: 10.1016/s0891-5849(02)00780-3. [DOI] [PubMed] [Google Scholar]
- 5.Sian J, Dexter DT, Lees AJ, Daniel S, Jenner P, Marsden CD. Glutathione-related enzymes in brain in Parkinson’s disease. Ann Neurol. 1994 Sep;36(3):356–361. doi: 10.1002/ana.410360306. [DOI] [PubMed] [Google Scholar]
- 6.Smeyne M, Smeyne RJ. Glutathione metabolism and Parkinson’s disease. Free Radic Biol Med. 2013 Sep;62:13–25. doi: 10.1016/j.freeradbiomed.2013.05.001. [DOI] [PMC free article] [PubMed] [Google Scholar]
- 7.Carvalho C, Correia SC, Cardoso S, et al. The role of mitochondrial disturbances in Alzheimer, Parkinson and Huntington diseases. Expert Rev Neurother. 2015;15(8):867–884. doi: 10.1586/14737175.2015.1058160. [DOI] [PubMed] [Google Scholar]
- 8.Jenner P. Altered mitochondrial function, iron metabolism and glutathione levels in Parkinson’s disease. Acta Neurol Scand Suppl. 1993;146:6–13. [PubMed] [Google Scholar]
- 9.Johnson WM, Wilson-Delfosse AL, Mieyal JJ. Dysregulation of glutathione homeostasis in neurodegenerative diseases. Nutrients. 2012 Oct 09;4(10):1399–1440. doi: 10.3390/nu4101399. [DOI] [PMC free article] [PubMed] [Google Scholar]
- 10.Cristalli DO, Arnal N, Marra FA, de Alaniz MJ, Marra CA. Peripheral markers in neurodegenerative patients and their first-degree relatives. J Neurol Sci. 2012 Mar 15;314(1–2):48–56. doi: 10.1016/j.jns.2011.11.001. [DOI] [PubMed] [Google Scholar]
- 11.Klepac N, Relja M, Klepac R, Hecimovic S, Babic T, Trkulja V. Oxidative stress parameters in plasma of Huntington’s disease patients, asymptomatic Huntington’s disease gene carriers and healthy subjects: a cross-sectional study. J Neurol. 2007 Dec;254(12):1676–1683. doi: 10.1007/s00415-007-0611-y. [DOI] [PubMed] [Google Scholar]
- 12.Babu GN, Kumar A, Chandra R, et al. Oxidant-antioxidant imbalance in the erythrocytes of sporadic amyotrophic lateral sclerosis patients correlates with the progression of disease. Neurochem Int. 2008 May;52(6):1284–1289. doi: 10.1016/j.neuint.2008.01.009. [DOI] [PubMed] [Google Scholar]
- 13.Piemonte F, Pastore A, Tozzi G, et al. Glutathione in blood of patients with Friedreich’s ataxia. Eur J Clin Invest. 2001 Nov;31(11):1007–1011. doi: 10.1046/j.1365-2362.2001.00922.x. [DOI] [PubMed] [Google Scholar]
- 14.Berman AE, Chan WY, Brennan AM, et al. N-acetylcysteine prevents loss of dopaminergic neurons in the EAAC1−/− mouse. Ann Neurol. 2011 Mar;69(3):509–520. doi: 10.1002/ana.22162. [DOI] [PMC free article] [PubMed] [Google Scholar]
- 15.Clark J, Clore EL, Zheng K, Adame A, Masliah E, Simon DK. Oral N-acetyl-cysteine attenuates loss of dopaminergic terminals in alpha-synuclein overexpressing mice. PLoS One. 2010 Aug 23;5(8):e12333. doi: 10.1371/journal.pone.0012333. [DOI] [PMC free article] [PubMed] [Google Scholar]
- 16.Monti DA, Zabrecky G, Kremens D, et al. N-Acetyl Cysteine May Support Dopamine Neurons in Parkinson’s Disease: Preliminary Clinical and Cell Line Data. PLoS One. 2016;11(6):e0157602. doi: 10.1371/journal.pone.0157602. [DOI] [PMC free article] [PubMed] [Google Scholar]
- 17.Holmay MJ, Terpstra M, Coles LD, et al. N-Acetylcysteine boosts brain and blood glutathione in Gaucher and Parkinson diseases. Clin Neuropharmacol. 2013 Jul-Aug;36(4):103–106. doi: 10.1097/WNF.0b013e31829ae713. [DOI] [PMC free article] [PubMed] [Google Scholar]
- 18.Tkac I, Oz G, Adriany G, Ugurbil K, Gruetter R. In vivo 1H NMR spectroscopy of the human brain at high magnetic fields: metabolite quantification at 4T vs. 7T. Magn Reson Med. 2009 Oct;62(4):868–879. doi: 10.1002/mrm.22086. [DOI] [PMC free article] [PubMed] [Google Scholar]
- 19.Terpstra M, Cheong I, Lyu T, et al. Test-retest reproducibility of neurochemical profiles with short-echo, single-voxel MR spectroscopy at 3T and 7T. Magn Reson Med. 2016 Oct;76(4):1083–1091. doi: 10.1002/mrm.26022. [DOI] [PMC free article] [PubMed] [Google Scholar]
- 20.Gruetter R, Tkac I. Field mapping without reference scan using asymmetric echo-planar techniques. Magn Reson Med. 2000 Feb;43(2):319–323. doi: 10.1002/(sici)1522-2594(200002)43:2<319::aid-mrm22>3.0.co;2-1. [DOI] [PubMed] [Google Scholar]
- 21.Oz G, Tkac I. Short-echo, single-shot, full-intensity proton magnetic resonance spectroscopy for neurochemical profiling at 4 T: validation in the cerebellum and brainstem. Magn Reson Med. 2011 Apr;65(4):901–910. doi: 10.1002/mrm.22708. [DOI] [PMC free article] [PubMed] [Google Scholar]
- 22.Provencher SW. Automatic quantitation of localized in vivo 1H spectra with LCModel. NMR Biomed. 2001 Jun;14(4):260–264. doi: 10.1002/nbm.698. [DOI] [PubMed] [Google Scholar]
- 23.Govindaraju V, Young K, Maudsley AA. Proton NMR chemical shifts and coupling constants for brain metabolites. NMR Biomed. 2000 May;13(3):129–153. doi: 10.1002/1099-1492(200005)13:3<129::aid-nbm619>3.0.co;2-v. [DOI] [PubMed] [Google Scholar]
- 24.Olsson B, Johansson M, Gabrielsson J, Bolme P. Pharmacokinetics and bioavailability of reduced and oxidized N-acetylcysteine. Eur J Clin Pharmacol. 1988;34(1):77–82. doi: 10.1007/BF01061422. [DOI] [PubMed] [Google Scholar]
- 25.Borgstrom L, Kagedal B, Paulsen O. Pharmacokinetics of N-acetylcysteine in man. Eur J Clin Pharmacol. 1986;31(2):217–222. doi: 10.1007/BF00606662. [DOI] [PubMed] [Google Scholar]
- 26.Holdiness MR. Clinical pharmacokinetics of N-acetylcysteine. Clin Pharmacokinet. 1991 Feb;20(2):123–134. doi: 10.2165/00003088-199120020-00004. [DOI] [PubMed] [Google Scholar]
- 27.Buur JL, Diniz PP, Roderick KV, KuKanich B, Tegzes JH. Pharmacokinetics of N-acetylcysteine after oral and intravenous administration to healthy cats. Am J Vet Res. 2013 Feb;74(2):290–293. doi: 10.2460/ajvr.74.2.290. [DOI] [PubMed] [Google Scholar]
- 28.Rodenstein D, DeCoster A, Gazzaniga A. Pharmacokinetics of oral acetylcysteine: absorption, binding and metabolism in patients with respiratory disorders. Clin Pharmacokinet. 1978 May-Jun;3(3):247–254. doi: 10.2165/00003088-197803030-00005. [DOI] [PubMed] [Google Scholar]
- 29.Deelchand DK, Marjanska M, Hodges JS, Terpstra M. Sensitivity and specificity of human brain glutathione concentrations measured using short-TE (1)H MRS at 7 T. NMR Biomed. 2016 May;29(5):600–606. doi: 10.1002/nbm.3507. [DOI] [PMC free article] [PubMed] [Google Scholar]
- 30.Oz G, Alger JR, Barker PB, et al. Clinical proton MR spectroscopy in central nervous system disorders. Radiology. 2014 Mar;270(3):658–679. doi: 10.1148/radiol.13130531. [DOI] [PMC free article] [PubMed] [Google Scholar]
- 31.Deelchand DK, Adanyeguh IM, Emir UE, et al. Two-site reproducibility of cerebellar and brainstem neurochemical profiles with short-echo, single-voxel MRS at 3T. Magn Reson Med. 2015 May;73(5):1718–1725. doi: 10.1002/mrm.25295. [DOI] [PMC free article] [PubMed] [Google Scholar]
- 32.Jenner P, Olanow CW. Oxidative stress and the pathogenesis of Parkinson’s disease. Neurology. 1996 Dec;47(6 Suppl 3):S161–170. doi: 10.1212/wnl.47.6_suppl_3.161s. [DOI] [PubMed] [Google Scholar]
- 33.Wink LK, Adams R, Wang Z, et al. A randomized placebo-controlled pilot study of N-acetylcysteine in youth with autism spectrum disorder. Mol Autism. 2016;7:26. doi: 10.1186/s13229-016-0088-6. [DOI] [PMC free article] [PubMed] [Google Scholar]
- 34.da Silva ND, Jr, Roseguini BT, Chehuen M, et al. Effects of oral N-acetylcysteine on walking capacity, leg reactive hyperemia, and inflammatory and angiogenic mediators in patients with intermittent claudication. Am J Physiol Heart Circ Physiol. 2015 Sep;309(5):H897–905. doi: 10.1152/ajpheart.00158.2015. [DOI] [PubMed] [Google Scholar]
- 35.James JS. NAC: first controlled trial, positive results. AIDS Treat News. 1996 Jul 05;(250):1–3. [PubMed] [Google Scholar]
- 36.Singh F, Charles AL, Schlagowski AI, et al. Reductive stress impairs myoblasts mitochondrial function and triggers mitochondrial hormesis. Biochim Biophys Acta. 2015 Jul;1853(7):1574–1585. doi: 10.1016/j.bbamcr.2015.03.006. [DOI] [PubMed] [Google Scholar]
- 37.Prabhu A, Sujatha DI, Kanagarajan N, Vijayalakshmi MA, Ninan B. Effect of N-acetylcysteine in attenuating ischemic reperfusion injury in patients undergoing coronary artery bypass grafting with cardiopulmonary bypass. Ann Vasc Surg. 2009 Sep-Oct;23(5):645–651. doi: 10.1016/j.avsg.2008.12.005. [DOI] [PubMed] [Google Scholar]
- 38.Pandya JD, Readnower RD, Patel SP, et al. N-acetylcysteine amide confers neuroprotection, improves bioenergetics and behavioral outcome following TBI. Exp Neurol. 2014 Jul;257:106–113. doi: 10.1016/j.expneurol.2014.04.020. [DOI] [PMC free article] [PubMed] [Google Scholar]
- 39.Katz M, Won SJ, Park Y, et al. Cerebrospinal fluid concentrations of N-acetylcysteine after oral administration in Parkinson’s disease. Parkinsonism Relat Disord. 2015 May;21(5):500–503. doi: 10.1016/j.parkreldis.2015.02.020. [DOI] [PubMed] [Google Scholar]
- 40.Van Laar VS, Roy N, Liu A, et al. Glutamate excitotoxicity in neurons triggers mitochondrial and endoplasmic reticulum accumulation of Parkin, and, in the presence of N-acetyl cysteine, mitophagy. Neurobiol Dis. 2015 Feb;74:180–193. doi: 10.1016/j.nbd.2014.11.015. [DOI] [PMC free article] [PubMed] [Google Scholar]
- 41.Poljsak B. Strategies for reducing or preventing the generation of oxidative stress. Oxid Med Cell Longev. 2011;2011:194586. doi: 10.1155/2011/194586. [DOI] [PMC free article] [PubMed] [Google Scholar]