

SUMMARY
Menopause results in a progressive decline in 17β-estradiol (E2) levels, increased adiposity, decreased insulin sensitivity, and a higher risk for type-2 diabetes. Estrogen therapies can help reverse these effects, but the mechanism(s) by which E2 modulates susceptibility to metabolic disease is not well understood. In young C57BL/6N mice, short-term ovariectomy decreased, whereas E2 therapy restored, mitochondrial respiratory function, cellular redox state (GSH/GSSG) and insulin sensitivity in skeletal muscle. E2 was detected by LC/MS in mitochondrial membranes and varied according to whole body E2 status independent of ERα. Loss of E2 increased mitochondrial membrane microviscosity and H2O2 emitting potential, whereas E2 administration in vivo and in vitro restored membrane E2 content, microviscosity, complex I and I+III activities, H2O2 emitting potential and submaximal OXPHOS responsiveness. These findings demonstrate that E2 directly modulates membrane biophysical properties and bioenergetic function in mitochondria, offering a novel mechanism by which E2 status broadly influences energy homeostasis.
ETOC Blurb
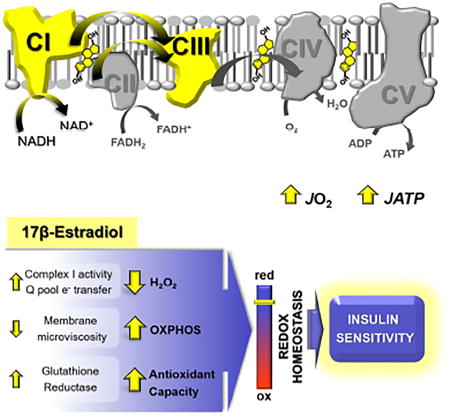
Loss of estrogen from menopause increases the risk of developing metabolic diseases. Torres et al. show that 17β-estradiol (E2) localizes to mitochondrial membranes consistent with whole body E2 status. The presence of E2 decreases microviscosity which improves bioenergetic function, thus offering a biophysical mechanism by which E2 influences energy homeostasis.
INTRODUCTION
17β-estradiol (E2) is a key regulator of energy and glucose homeostasis with direct effects in muscle, liver, pancreas, adipose tissue, immune cells and brain (Mauvais-Jarvis et al., 2013). Thus, the substantial reduction in circulating E2 that accompanies menopause has effects beyond reproductive health, characterized by central adiposity and declining insulin sensitivity (IS), predisposing women to the development of type 2 diabetes, metabolic syndrome, and cardiovascular disease (Janssen et al., 2008). In addition, women who enter menopause before 40 (Brand et al., 2013), undergo hysterectomy/bilateral oophorectomy (Appiah et al., 2014), or present estrogen receptor (ER) gene polymorphisms that impair E2 function (Lo et al., 2006) show further elevated risk for the metabolic syndrome. The link between E2 deficiency and metabolic dysfunction is recapitulated in rodent models where ovariectomy (OVX) (Jackson et al., 2013), knock out of aromatase (Jones et al., 2000), or genetic ablation of ERα globally (Bryzgalova et al., 2006; Ribas et al., 2010) or specifically in skeletal muscle (Ribas et al., 2016) also lead to increased body fat and impaired IS. However, E2 administration restores insulin action in chow- and high fat-fed OVX rodents (Bryzgalova et al., 2008; Riant et al., 2009), and hormone therapies, including estrogens +/− progestins, reduce new-onset diabetes in healthy women as well as insulin resistance in diabetic women (Margolis et al., 2004; Salpeter et al., 2006). Notably, the molecular mechanisms behind E2 actions on metabolism remain poorly understood and inopportunely under-explored.
E2 mediates both genomic and non-genomic actions through ERs (ERα, ERβ, GPER) that activate nuclear gene transcription, cell signaling (Gupte et al., 2015), mitochondrial biogenesis (Mattingly et al., 2008) and processing of RNA transcripts that encode for components of the electron transport system (ETS) (Sanchez et al., 2015). In addition to ER-mediated effects (Chen et al., 2005), E2 has also been implicated in the direct regulation of various aspects of mitochondrial function, including ATP production (Moreno et al., 2013), membrane potential (Wang et al., 2001), and reactive oxygen species (ROS) production (Yao et al., 2014), although the precise mechanism(s) of action remains poorly-defined. Elevated mitochondrial-derived ROS has been established as at least one contributing mechanism to the development of insulin resistance (Anderson et al., 2009; Hoehn et al., 2009; Houstis et al., 2006), and E2 is known to exert antioxidant effects across many non-reproductive tissues, preventing ROS generation or upregulating redox buffering systems (Arias-Loza et al., 2013; Bellanti et al., 2013). The progressive loss of E2 and consequent decline in mitochondrial and/or redox functions could therefore lead to a resetting of glucose homeostasis and relative loss of peripheral IS.
Skeletal muscle (SM) is particularly important to whole-body metabolic balance due to its high metabolic activity, its size relative to total body mass, and its primary role in insulin-stimulated glucose disposal. Using a combination of in-vivo and in-vitro physiological, molecular, and biophysical experimental approaches, the aims of the present study were (1) to determine whether short-term ovarian E2 depletion and E2 therapy acutely alter mitochondrial and redox functions in SM concomitantly with IS, and (2) to investigate the underlying mechanism(s) by which E2 regulates mitochondrial bioenergetic function.
RESULTS
Ovarian E2 depletion induces a pro-diabetogenic state before inducing obesity
To investigate the primary effects of ovarian E2 depletion in SM apart from obesity and aging, young sexually mature (10 week-old) female C57BL/6N mice were studied on a standard chow diet 2 weeks after OVX (OVX-2w), and compared with normally cycling females in the Proestrus stage (NC-Pro) (Figure S1). Loss of ovarian E2 was confirmed by a reduction in uterine weight (Figure S2A). Despite no change in body composition (Figure S2B), OVX-2w mice presented with fasting hyperglycemia (Figure S2C), a trend (p=0.052) for higher fasting insulin levels (not shown), and consequently higher insulin resistance index scores (HOMA-IR) (Figure S2E). Whole body glucose (Figure S2C) and insulin (Figure S2D) tolerance (per lean mass) wer not different. However, ex-vivo insulin-stimulated SM glucose uptake in extensor digitorum longus (EDL) muscles was reduced in OVX-2w (Figure S2F), indicating the early development of insulin resistance. Similar to previous reports (Jackson et al., 2013; Rogers et al., 2009), food intake was not altered and activity levels in the dark cycle were reduced post-OVX (Figure S2G–L).
Ovarian E2 depletion decreases SM mitochondrial respiratory function
To determine whether mitochondrial respiratory and redox functions are acutely impacted in SM by ovarian E2 withdrawal, permeabilized fiber bundles (PmFbs) from the red portion of the gastrocnemius were prepared for high resolution respirometry. Citrate synthase activity, an index of mitochondrial content, was unchanged in OVX-2w mice (Figure 1A). However, the rate of state 4 Complex (C) I-linked (glutamate/malate, no ADP) respiration (JO2) and state 3 (+ADP) C I- and C I + II-linked respiration (+succinate) were reduced by ~25% in OVX-2w (Figure 1B). C IV maximal JO2 was ~20% lower in PmFbs from OVX-2w mice under both coupled (+ADP) and uncoupled (+FCCP) conditions. Interestingly, C II-linked JO2 (+rotenone) was not changed. Fatty acid-supported JO2 was reduced by ~45% in OVX-2w mice under state 3 (+ADP) coupled and uncoupled (+FCCP) conditions (Figure 1C).
Figure 1. 2 week-OVX decreases mitochondrial function and induces an oxidative shift in SM cellular redox environment.

(A) Citrate synthase activity in RG. (B) JO2 measured in PmFbs from RG. (C) Fatty acid-supported JO2. Abbreviations: glutamate/malate (G/M), succinate (Succ), rotenone (Rot), antimycin A (AmA), ascorbate (Asc), N,N,N′,N′-Tetramethyl-p-phenylenediamine dihydrochloride (TMPD), palmitoyl-carnitine (PC), almitoyl-CoA (P-CoA), L-carnitine (L-Carn). (D–F) Mitochondrial respiratory kinetics. Pyruvate titrations in the presence of malate and ADP (D), and ADP titrations in the presence of G/M (E) or pyruvate/malate (F). Kinetic parameters KM and Vmax were determined from fitting to Michaelis Menten functions. Changes in Vmax were significant (*p<0.05). (G) Total GSH and GSSG concentration and resulting GSH/GSSG ratios (H) in RG. (I) JH2O2 measured in PmFbs pre-incubated with or without 1-chloro-2,4-dinitrobenzene (CDNB) for GSH depletion, then added pyruvate. Values are means ± SEM; * p<0.05; ** p<0.005; *** p<0.0005, N = 8-15 mice/group.
Given the pyruvate dehydrogenase (PDH) complex is also a target of E2 action (Brinton, 2008), the kinetic parameters of pyruvate-supported JO2 were examined. In the presence of malate and maximal ADP (Figure 1D), the Vmax decreased by ~24% in OVX-2w mice without changes in the apparent Km for pyruvate. The mitochondria’s ability to match metabolic demand was assessed by titrating ADP in the presence of saturating pyruvate/malate (requires flux through PDH and CI) (Figure 1E) or glutamate/malate (requires flux through CI only) (Figure 1F). In both conditions, the Vmax was decreased in OVX-2w mice by ~24% with no change in the Km. Collectively, these findings suggest that loss of ovarian E2 induces a rapid decline in mitochondrial respiratory capacity, likely mediated primarily by changes in C I function.
Ovarian E2 depletion induces an oxidative-shift in the SM cellular redox environment
The glutathione redox couple (GSH/GSSG) serves as an indicator of the overall cellular redox environment (Schafer and Buettner, 2001). Ovarian E2 depletion resulted in a ~40% reduction in the GSH/GSSG ratio (Figures 1G and 1H) and a >2-fold increase in H2O2 emission by the PDH complex, which is highly sensitive to mitochondrial glutathione redox status (Fisher-Wellman et al., 2013) (Figure 1I, left). This difference disappeared when glutathione was depleted by pre-treatment with CDNB (Figure 1I, right), suggesting the reduced GSH/GSSG ratio at least partially accounted for the elevated H2O2 emission by the PDH complex upon OVX.
E2 therapy prevents fat gain and restores glucose homeostasis
A subset of OVX-2w mice were randomized for 2 weeks of E2 therapy (OVX-4w[E2]) or placebo (OVX-4w[ctl]) (Figure 2A). Re-establishment of circulating E2 was confirmed by hypertrophy of the uterus (Figure 2B). OVX-4w[ctl] mice had a ~7% increase in body fat with enlarged peri-visceral fat depots (Figure S3A–B) and persistent fasting hyperglycemia (+12% vs NC-Pro). However, E2 therapy prevented fat gain and restored fasting blood glucose levels to pre-OVX values (Figures 2C–D). OVX-4w[ctl] mice also presented with lower glucose and insulin tolerance compared to the E2-treated mice (p<0.05, Figures 2E–F). HOMA-IR scores remained 70% higher in OVX-4w[ctl], but were restored in OVX-4w[E2] mice (Figure 2G). Moreover, ex-vivo insulin-stimulated glucose uptake was reduced by 35% in EDL muscles of OVX-4w[ctl] mice compared with controls, but also rescued by E2 therapy (Figure 2H). Insulin stimulation in soleus showed similar trends (Figure 2I). Food intake, activity levels, and energy expenditure remained unchanged +/− E2 (Figure S3C–H).
Figure 2. E2 therapy reverses the OVX-induced pro-diabetogenic state.

(A) Study design. (B) Uterine mass at sacrifice. (C) Body Composition. (D) Fasting blood glucose. ! p<0.05, !! p<0.005 vs. pre-OVX for each group, and # p<0.05 vs. OVX-4w[ctl]. (E) Glucose tolerance test. Inset: Area under the curve (AUC). (F) Insulin tolerance test. Inset: slope of the least-squared-regression line calculated from the first 20 min. (G) HOMA-IR scores calculated as in Figure S2E. (H–I) Ex-vivo basal and insulin-stimulated 3H-2-Deoxy-glucose uptake in whole EDL (H) and soleus (I) muscles. Values are means ± SEM, * p<0.05, ** p<0.005 vs. NC-Pro and # p<0.05, ## p<0.005 vs. OVX-4w[ctl], N = 6 mice/group.
E2 therapy rescues carbohydrate- but not fat-supported mitochondrial respiratory function
At 4 week-OVX, C I-linked state 4 and state 3 respiration were decreased by −38% (Figure 3A; compare with −25% in OVX-2w in Figure 1B). E2 treatment restored JO2 values in all carbohydrate-based substrate conditions (Figure 3A). C II-linked respiration was not different in OVX-4w mice (p=0.06). Lipid-supported JO2 fell by >70% in OVX-4w[ctl] mice, but surprisingly was not rescued by E2 therapy under either coupled (+ADP) or uncoupled (+FCCP) conditions (Figure 3B).
Figure 3. E2 therapy restores mitochondrial function and cellular redox balance in SM.

(A) JO2 measured in PmFbs from RG. C I-supported JO2 measured by the sequential addition of pyruvate/malate (Pyr/Mal) and ADP (left panel); or glutamate/malate (G/M) and ADP (middle panel), and C II-supported JO2 measured in the presence of rotenone (Rot), succinate (Succ), and ADP (right panel). (B) Fatty acid-supported JO2 in RG PmFbs, as in Figure 1C. (C) Total GSH and GSSG levels in whole gastrocnemius. (D) Resulting 2GSH/GSSG ratios. (E) Left: JH2O2 measured after the addition of Pyr, followed by 1,3-bis(2-chloroethyl)-1-nitrosourea (BCNU). !! p<0.005 vs Pyr. Right: PmFBs were pre-incubated with 1-chloro-2,4-dinitrobenzene (CDNB), then added pyruvate. (F) JH2O2 measured after the addition of succinate, auranofin. (G) Mitochondrial free radical leak (JH2O2/JO2*2) under succinate-supported respiration. Values are means ± SEM, * p<0.05; ** p<0.005; *** p<0.0005 vs. NC-Pro, and # p<0.05, ## p<0.005 vs. OVX-4w[ctl], N = 6 mice/group.
E2 therapy restores cellular redox homeostasis in SM
An oxidative shift in the cellular redox environment was also observed at 4 week-OVX, with a drop in GSH/GSSG ratio (Figures 3C–D) and a 3-fold higher PDH-derived JH2O2 emission (left panel Figure 3E). Both parameters were rescued by E2 therapy. Interestingly, including an inhibitor of glutathione reductase (GR), BCNU, increased JH2O2 in NC-Pro and OVX-4w[E2], but not in OVX-4w[ctl] mice, whereas pre-treatment of PmFBs with CDNB to deplete GSH increased JH2O2 equally across groups (right panel Figure 3E). This raises the possibility that OVX negatively impacts the GSH redox buffering circuit in SM. In agreement, RT-PCR analysis revealed a >90% decline (p<0.05) in mRNA level for GR after OVX that was rescued by E2 therapy (Figure S3I). Mitochondrial JH2O2 emission (Figure 3F left) and JH2O2 production supported by succinate (+auranofin to inhibit thioredoxin reductase, Figure 3F right) was increased at 4 wk-OVX, but restored by E2. Mitochondrial free radical leak (mFRL%; JH2O2 produced per molecular oxygen consumed JO2*2, per min) thus followed the same trend (Figure 3G).
C I activity and electron transfer at the Q pool are sensitive to E2 status
The E2-mediated short-term effects on mitochondrial function were not linked to changes in mitochondrial content (Figure 4A–B). Thus, to further explore the potential mechanism(s) underlying E2 action, specific activities of the respiratory complexes I−IV, I+III, and II+III were determined spectrophotometrically in isolated SM mitochondria (Figure 4C, and Figure S4). OVX reduced the relative specific activity of C I, as well as the electron transfer between I / II and III by ~35–50%, while E2 therapy completely reversed these changes. C III relative specific activity was lower only in OVX-2w. These results suggest the protective effects of E2 are mainly targeted to C I and electron transfer at the Q pool.
Figure 4. E2 therapy restores OVX-induced loss of C I, C I/II+III activities.

(A) Western blot analysis of OXPHOS complexes and (B) citrate synthase activity in isolated mitochondria. (C) Relative specific activity of respiratory complexes normalized to CS activity (1 CSU = 1 µmol/min/mg prot). See Figure S4. Values are means ± SEM, * p<0.05, ** p<0.005 vs. NC-Pro, and # p<0.05, ## p<0.005 vs. OVX-4w[ctl], N = 4-5 mice/group.
E2 decreases microviscosity in biomimetic mitochondrial membranes
Protein activity in lipid bilayers is tightly regulated by the membrane phospholipids (Andersen and Koeppe, 2007), which in the mitochondria could influence respiratory function. To determine whether E2 directly alters mitochondrial membrane microviscosity and function, the effect of E2 on lipid packing was first tested using biomimetic small and large unilamellar lipid vesicles (SUVs, LUVs) to allow tight control over membrane biophysical parameters. SUVs were made with dipalmitoyl-phosphatidylcholine (DPPC) (Figure S5), and biomimetic mitochondrial LUVs were prepared with a lipid mixture of phosphatidyl-choline, -ethanolamine, and -serine (PC:PE:PS) in relative mol% ratios similar to those found in mitochondrial membranes (Horvath and Daum, 2013) (Figure 5). Both SUVs and LUVs were incubated with merocyanine (MC-540), a fluorescent probe sensitive to lipid packing whose peak spectra fluorescence increases with decreased viscosity (Stillwell et al., 1993; Zeczycki et al., 2014). As expected by its condensation effect of surrounding phospholipids (Ohvo-Rekila et al., 2002), inclusion of cholesterol decreased MC-540 peak fluorescence intensity in LUVs (Figure 5A–B). However, MC-540 peak fluorescence progressively increased with increasing E2 mol% ratios in both SUVs and biomimetic LUVs, suggesting a lower degree of lipid packing (i.e. microviscosity) in the bilayer. Incorporation of E2 in the vesicles was confirmed by LC/MS (Figure S6A).
Figure 5. E2 decreases microviscosity in biomimetic mitochondrial membranes.

(A) Sample fluorescence MC-540 emission spectra from LUVs made with PC:PE:PS and increasing [E2], or cholesterol (negative control). (B) Peak MC-540 F values from (A). Values are means ± SEM, from 3 independent LUVs preparations. * p<0.05; ** p<0.005 vs [E2] 0%. (C) Representative pressure-area (π-A) isotherms of DPPC monolayers containing 5 mol% E2 or cholesterol. (D) Average mean molecular area (Mma) at relevant surface pressures extrapolated from 3 independent π-A isotherms. (E) The surface elasticity moduli (Cs−1) as a function of Mma, corresponding to the respective π-A isotherms shown in panel C. (F) Cs−1 calculated from 3 independent π-A isotherms (dotted lines). Values are means +/− SEM.
To further examine how the presence of E2 versus cholesterol targets membrane biophysical organization, pressure-area (π-A) isotherms were collected upon compression of a DPPC monolayer, which allows for precise measurements of lipid packing at the Angstrom (1 Å = 1×10⁻⁷ mm) level (Pennington et al., 2016). π-A isotherms of DPPC and cholesterol alone were consistent with previous reports (Gong et al., 2002; Pennington et al., 2016), but this was not possible for E2 (Figure S5C), indicating that unlike cholesterol, E2 does not form a monolayer. The incorporation of 5 mol% E2 in the DPPC monolayer caused a right-ward shift in the π-A isotherm when compared with cholesterol present in the same mol% (Figure 5C), indicating E2 increased the mean molecular area (MmA) of the monolayer at physiologically relevant surface pressures (Figure 5D). This suggests E2 causes the average DPPC molecule to occupy more area within the monolayer (lateral space), reducing the level of packing and thereby decreasing both the order and the amount of lipid-lipid interactions. Secondary analysis of the π-A isotherms provides the surface elasticity moduli (Cs−1), an indicator of the elastic response upon compression (compressibility). As shown in Figure 5E, the presence of E2 shifted the Cs−1 curve rightward. The Cs−1 at relevant surface pressures was determined by extrapolation of the MmA values from Figure 5C to Cs−1 values in Figure 5E (dotted lines connecting graphs). DPPC-E2 monolayers tended to have lower Cs−1 values across different surface pressures (Figure 5F), implying that a monolayer containing E2 is more elastic, and can be compressed more. These results are consistent with the reduced microviscosity detected via MC-540 fluorescence spectra.
E2 localizes to mitochondrial membranes and decreases microviscosity
In-vivo exposure of OVX rats to titrated E2 results in translocation of the hormone from the plasmalemma to the mitochondria (75%) in liver, adrenal gland, and spleen tissues (Moats and Ramirez, 1998). To determine if E2 localizes to mitochondrial membranes, E2 was extracted from isolated mitochondrial membranes via a solid phase extraction and analyzed by LC/MS (see STAR Methods). Consistent with the mitochondrial functional data, SM mitochondrial membrane E2 content was progressively decreased at 2 (−60%, p<0.05) and 4 wk post-OVX (−90%, p<0.0005) (Figures 6A–B). In fact, E2 was undetected in 6 out of 15 samples from OVX-4w[ctl] mice. Loss of E2 from the mitochondrial membranes was associated with a decrease in MC-540 peak fluorescence. E2 therapy restored E2 levels in membranes and reversed the OVX-induced loss of microviscosity (Figures 6A–D).
Figure 6. E2 localizes to mitochondrial membranes and decreases microviscosity independent of ER α.

(A) Representative extracted ion chromatograms for E2. (B) E2 content in mitochondrial membrane extracts measured by LC/MS. (C) Fluorescence MC-540 emission spectra in intact SM mitochondria. (D) Peak MC-540 F values from C. Data are means +/− SEM, * p<0.05, ** p<0.005, *** p<0.0005 vs NC-Pro, and # p<0.05, ## p<0.005 vs. OVX-4w[ctl], n=6-8 mice/group. (E) E2 content and respective CI relative specific activity (F). Values are means +/− SEM, * p<0.05 vs. NC-skmERαKO, and # p<0.05 vs. OVX-skmERαKO, N = 3-4 mice/group.
ERα is not required for incorporation of E2 into mitochondrial membranes
ERs are reportedly expressed in mitochondria (Klinge, 2017), and recent findings from SM-specific ERα knock out mice suggest ERα participates in the maintenance of mitochondrial function (Ribas et al., 2016). To determine if the localization of E2 to mitochondrial membranes is dependent on ERα, E2 levels were measured in SM mitochondrial membranes from normally cycling ERα-floxed (skmERαNC) and SM-specific ERα-knock out (skmERαKO) mice subjected to OVX +/− E2 therapy. Mitochondrial E2 content was not different between skmERαNC and skmERαKO mice (Figure 6E). In skmERαKO mice, OVX decreased whereas E2 therapy restored both mitochondrial E2 content (Figure 6E) and C I specific activity (Figure 6F). These findings demonstrate that mitochondrial membrane E2 content in SM varies with whole-body E2 status independent of ERα, and can directly affect C I function.
Acute in-vitro E2 exposure of mitochondria from OVX mice restores membrane E2 content, microviscosity, and multiple aspects of mitochondrial function
To determine whether acute exposure to E2 in-vitro is sufficient to reverse the changes in mitochondrial function and membrane microviscosity induced by ovarian E2 loss, fresh isolated mitochondria from NC-Pro and OVX-4w mice were incubated with 3 nM E2 (an E2 concentration ~10x greater than the E2 concentration measured in mitochondria by LC/MS), re-pelleted and re-suspended in medium alone (Figure 7A). Exposure to E2 increased membrane E2 content in mitochondria from OVX-4w mice to ~0.45 ng E2/mg mitochondrial protein, a value comparable to NC-Pro (Figure 7B) and OVX-4w mice treated in vivo with E2 (Figure 6B). E2 incorporation into membranes increased only slightly in mitochondria from NC-Pro incubated with E2 (~0.5 ng E2/mg mitochondrial protein). Incubation with higher levels of E2 did not further increase E2 content in mitochondrial membranes (Figure S6C–D), suggesting its incorporation may be limited.
Figure 7. In-vitro E2 exposure of OVX mitochondria restores membrane microviscosity JH2O2 emitting potential and OXPHOS steady-state flux.

(A) Experimental design. (B) E2 content in mitochondrial membranes. Values are means +/− SEM, N = 7-14 mice/group. (C) Peak F values from MC-540 emission spectra in fresh intact SM mitochondria pre-incubated +/− 3 nM E2. Values are means +/− SEM of three replicate measures, N = 8 mice/group. (D) Specific activities of complexes, measured as in Figure 4. N = 7 mice/group. (E) JH2O2 and (F) maximal JO2 capacity measured in isolated mitochondria as in Figure 1B. (G) JO2, (H) JATP, and (I) resulting ATP/O ratios (JATP/JO2), in the presence of G/M/Pyr/Succ and ADP. Values are means ± SEM. For all panels, * p<0.05, ** p<0.005 vs. NC-Pro, and ! p<0.05, !! p<0.005 vs. OVX-4w. N = 7 mice/group.
Consistent with E2 administration in-vivo, re-introduction of E2 in OVX-4w mitochondria in-vitro restored membrane microviscosity (Figure 7C), C I and C I+III specific activities (Figure 7D), as well as succinate-supported JH2O2 emission (Figure 7E). Interestingly, and in contrast to E2 therapy in-vivo, acute in-vitro re-introduction of E2 in OVX-4w mitochondria did not restore maximal JO2 (Figure 7F), possibly reflecting the absence of E2-ER-mediated gene regulatory responses. These findings nevertheless support the concept that the presence of E2 in mitochondrial membranes lowers membrane microviscosity and improves the activity of specific complexes within the ETS.
To further explore the potential effects of E2-mediated changes in microviscosity on oxidative phosphorylation (OXPHOS), steady-state rates of JO2 and ATP synthesis (JATP) were measured simultaneously at a “clamped” submaximal rate of respiratory demand (~40% of max) (Lark et al., 2016). OVX mice presented ~20% lower steady-state rates of JO2 and JATP relative to NC-Pro, whereas restoration of E2 in-vitro increased JO2 and JATP rates nearly matching control values (Figure 7G–H). Thus, while the ATP/O ratio (i.e., efficiency of OXPHOS) was unchanged in OVX-4w mitochondria +/−E2 (Figure 7I), the ability of the OXPHOS system to respond, as effectively, to a given rate of metabolic demand was directly affected by the absence/presence of E2. Overall, these findings demonstrate that E2 localizes to mitochondrial membranes and optimizes OXPHOS responsiveness.
DISCUSSION
Herein we investigated the impact of acute ovarian E2 depletion and E2 treatment on mitochondrial bioenergetics and membrane biophysics. We report two main findings. First, the acute loss of ovarian E2 induces a pro-diabetogenic state, with decreased mitochondrial function, higher JH2O2 emitting potential, and an oxidative shift in the cellular redox environment, all conditions previously linked to the etiology of insulin resistance in SM (Anderson et al., 2009; Hoehn et al., 2009; Houstis et al., 2006). With the exception of SM fatty acid oxidative capacity, E2 therapy rescued all of these parameters without affecting mitochondrial content. The former possibly reflects a dependence on longer-acting E2-mediated regulation of peroxisome proliferator-activated receptor-δ expression and downstream lipid metabolism genes (Campbell et al., 2003; D’Eon et al., 2005; Fu et al., 2009). Second, E2 localizes to mitochondrial membranes in an ERα-independent manner where it influences membrane microviscosity and bioenergetic function.
Regulation of cellular redox homeostasis is increasingly recognized as a critical factor for the maintenance of IS (Fisher-Wellman and Neufer, 2012; Rindler et al., 2013). An oxidative shift in the redox environment reflects a change in the balance between oxidant production and scavenging by redox circuits. OVX elicited both a marked decline in mRNA expression of glutathione reductase (GR) and an increased/dysregulated oxidant production by the ETS. In mammalian mitochondria, the two largest contributing sites of electron leak in the ETS are the ubiquinone reduction site of C I and the outer quinone-binding site in C III (Brand, 2010). C I activity is highly sensitive to perturbation of thiol redox homeostasis as its glutathionylation by GSSG results in inhibition and increased superoxide production (Taylor et al., 2003). Hence, the ability of E2 to promote GR expression, increase C I and C I/II + III activities, and reduce mitochondrial JH2O2 emitting potential suggests a role in promoting cellular redox homeostasis and thereby IS in SM.
Steroid hormones such as testosterone, progesterone, and estradiol are derived from cholesterol, a major constituent of biomembranes. In a lipid bilayer, cholesterol increases the orientational order of the phospholipid hydrocarbon tails, which increases the degree of phospholipid packing leading to a more condensed membrane (Ohvo-Rekila et al., 2002). The substitution of cholesterol’s hydrophobic tail with polar groups (i.e. hydroxyl groups (−OH)) explains the difference in free-energy (ΔG) of interaction with lipid membranes, and hence the different behavior of these hormones with membranes (Oren et al., 2004). The importance of the −OH groups in the structure/activity relationship of steroid hormones was first evidenced with the antiestrogen drug tamoxifen (TAM), the main metabolite of which, 4-hydroxyl-tamoxifen (but not TAM), partitions into biomembranes due to the −OH group weakening effect in lipid packing (Custodio et al., 1991). In a similar manner, E2 passive diffusion and translocation across biomembranes is thermodynamically favored (Oren et al., 2004), and has also been shown to decrease microviscosity in DPPC multilamellar liposomes (Boyar and Severcan, 1996) and several cell models (Dicko et al., 1999; Kumar et al., 2011; Tsuda et al., 2003; Whiting et al., 2000). The structure of steroid hormones can be used to predict their behavior within a lipid membrane (Wenz, 2012). In the E2 molecule, the presence of −OH groups on both ends of the ring system and the absence of the double bond between C5 and C6 inhibit van der Waals interactions, weakening lipid packing (Wenz, 2012). Accordingly, solid-state NMR studies suggest that although E2 is stably inserted into the lipid bilayer, it is highly dynamic and may undergo rapid reorientation/rotations (Scheidt et al., 2010).
Fluid properties of biological membranes are decisive for cell functions (Andersen and Koeppe, 2007), particularly in mitochondrial membranes where altered phospholipid composition and packing can affect membrane dynamics and ultimately electron transfer (Mileykovskaya and Dowhan, 2014; Shaikh et al., 2014; Shi et al., 2013; Wenz et al., 2009). Cholesterol enrichment in mitochondria has been shown to increase membrane microviscosity (Colell et al., 2003) and impair ATP production (Yu et al., 2005). Interestingly, estrogen-containing hormone therapy decreases membrane viscosity of erythrocytes in postmenopausal women (Tsuda et al., 2003). The identification of E2 in mitochondrial membrane extracts via LC/MS supports the concept that E2 may comprise a key component of mitochondrial membranes, “fine-tuning” ETS function. The ability of E2 to alter mitochondrial membrane microviscosity appears to be independent of ERα, as 1) E2 was detected in mitochondrial membranes from skmERαKO with levels decreasing only upon OVX, 2) E2 decreased microviscosity in membrane models which lack ERα (i.e. DPPC-SUVs, DPPC monolayers, and biomimetic mitochondrial LUVs), and 3) direct translocation of E2 occurred spontaneously in-vitro in isolated mitochondria. In agreement with these findings, direct uptake of E2 into mitochondria has been reported in HepG2 cells (Moats and Ramirez, 2000) which do not express ERα (Harnish et al., 1998).
Alternatively, E2-mediated changes in mitochondrial membrane microviscosity could also be a function of redox biology. Mitochondrial phospholipids are enriched in polyunsaturated fatty acids that decrease lipid packing, possibly promoting the efficiency of electron transport by enhancing the lateral movement of proteins within the bilayer (Valentine and Valentine, 2004). However, polyunsaturated phospholipids are particularly vulnerable to lipid peroxidation (Catala, 2012), which can ultimately increase membrane viscosity (Choe et al., 1995; Solans et al., 2000). E2 itself can be metabolized to form quinones (Bolton and Thatcher, 2008), and has been shown to act as a neuroprotective antioxidant independent of ER activation (Behl et al., 1997; Prokai et al., 2003). Thus, the localization of the hormone in the mitochondrial inner membrane could potentially have a direct role in limiting lipid peroxidation, thereby preserving the biophysical properties of the membrane and the overall function of the ETS (Irwin et al., 2008).
Collectively, the data demonstrate that E2 levels in mitochondria directly modulate the microviscosity of the inner membrane, contributing to mitochondrial bioenergetic function. The present study focused on SM, but E2 is likely to be a component of mitochondrial membranes in many (if not all) tissues, influencing bioenergetic activity locally, and energy homeostasis collectively. The impact of E2 on membranes is a function of its structure and potentially also not unique to E2. Indeed, several steroid hormones other than E2 (i.e. testosterone, DHEA, estrone) have been reported to improve bioenergetic activity in neuronal cells by increasing mitochondrial and redox function (Grimm et al., 2014). This novel action of E2 provides additional insights as to the mechanisms by which natural/surgical menopause sets, and E2 therapy reverses, a pro-diabetogenic state. The present findings unveil a potential new therapeutic target for the development of novel pharmacological interventions to prevent metabolic dysfunction in menopause, as well as disease states characterized by excess mitochondrial ROS production in both women and men.
STAR
 METHODS
KEY RESOURCES TABLE
| REAGENT or RESOURCE | SOURCE | IDENTIFIER |
|---|---|---|
| Antibodies | ||
| Monoclonal Anti-Tr/Ms Total OxPhos Complex Kit | Invitrogen | Cat#458099 |
| Biological Samples | ||
| Skeletal muscle from C57Bl/6N female mice | East Carolina University and University of Minnesota | N/A |
| Chemicals | ||
| Crystal Violet | Sigma-Aldrich | CAS#548-62-9 |
| Na2HPO4 | Sigma-Aldrich | CAS#7558-79-4 |
| NaH2PO4 | Sigma-Aldrich | CAS#10049-21-5 |
| NaHCO3 | Sigma-Aldrich | CAS#144-55-8 |
| NaOH | TCI America | CAS#1310-73-2 |
| KH2PO4 | J.T. Baker | P#3252-01 |
| Trizma-Base | Sigma-Aldrich | CAS#77-86-1 |
| K-MES | Sigma-Aldrich | CAS#39946-25-3 |
| KCl | Sigma-Aldrich | CAS#7447-40-7 |
| NaCl | Sigma-Aldrich | CAS#7647-14-5 |
| CaCl2 | Sigma-Aldrich | CAS#10043-52-4 |
| HEPES | Sigma-Aldrich | CAS#7365-45-9 |
| MgCl2-6H2O | Sigma-Aldrich | CAS#7791-18-6 |
| MgSO4-7H2O | Sigma-Aldrich | CAS#10034-99-8 |
| EDTA | Sigma-Aldrich | CAS#6381-92-6 |
| EGTA | Sigma-Aldrich | CAS#67-42-5 |
| D-Sucrose | Fisher | Cat#EC200-334-9 |
| BSA | Chem Cruz | CAS#9048-46-8 |
| Dextrose 50% | Pfizer Injectables | NDC# 00409-6648 |
| Insulin Human injection, USP | Eli Lilly | NDC#0002-8215 |
| 14C-D-mannitol | Perkin Elmer | P#NEC314050UC |
| 3H-2-Deoxy-glucose | Perkin Elmer | P#NET549A250UC |
| 2-Deoxy-D-glucose | Sigma-Aldrich | CAS#154-17-6 |
| D-Mannitol | Sigma-Aldrich | CAS#69-65-8 |
| Creatine monohydrate | Sigma-Aldrich | CAS#6020-87-7 |
| Imidazole | Sigma-Aldrich | CAS#288-32-4 |
| Taurine | Sigma-Aldrich | CAS#107-35-7 |
| Phosphocreatine | Sigma-Aldrich | CAS#19333-65-4 |
| Saponin | Sigma-Aldrich | CAS#8047-15-2 |
| D-Glutamic acid | Sigma-Aldrich | CAS#6893-26-1 |
| DL-Malic acid | Sigma-Aldrich | CAS#676-46-0 |
| Succinic acid | Sigma-Aldrich | CAS#110-15-6 |
| Sodium Pyruvate | Sigma-Aldrich | CAS#113-24-6 |
| Palmitoyl-L-carnitine-chloride | Sigma-Aldrich | CAS#18877-64-0 |
| Palmitoyl coenzyme A | Sigma-Aldrich | CAS#188174-64-3 |
| L-carnitine hydrochloride | Sigma-Aldrich | CAS#6645-46-1 |
| Cytochrome C | Sigma-Aldrich | CAS#9007-43-6 |
| NADH | RPI | CAS# 606-68-8 |
| n-Dodecyl β-D-maltoside | Sigma-Aldrich | CAS# 69227-93-6 |
| Rotenone | Sigma-Aldrich | CAS#83-79-4 |
| Malonic acid | Sigma- Aldrich | CAS#141-82-2 |
| Antimycin A | Sigma- Aldrich | CAS#1397-94-0 |
| KCN | Sigma- Aldrich | CAS#151-50-8 |
| 2,6-Dichloroindophenol sodium salt | Sigma- Aldrich | CAS# 620-45-1 |
| 2,3,5,6-Tetramethyl-p-phenylenediamine (TMPD) | Sigma- Aldrich | CAS#100-22-1 |
| Carbonyl cyanide p-(trifluro-methoxy)phenyl-hydazone (FCCP) | Sigma- Aldrich | CAS#370-86-5 |
| Decylubiquinone (DCU) | Enzo | Cat#CM115-0010 |
| L-ascorbate | Sigma-Aldrich | CAS#134-03-2 |
| ADP | Sigma-Aldrich | CAS#72696-48-1 |
| ATP | Sigma-Aldrich | CAS#34369-07-8 |
| Blebbistatin | Sigma-Aldrich | CAS#856925-71-8 |
| Amplex UltraRed | Thermo Fisher | Cat#A36006 |
| CuZn Superoxide Dismutase | Sigma-Aldrich | CAS# 9054-89-1 |
| Auranofin | Sigma-Aldrich | CAS#251-801-9 |
| 1,3-Bis(2-chloroethyl)-1-nitrosourea (BCNU) | Sigma-Aldrich | CAS#154-93-8 |
| 1-chloro-2,4-dinitrobenzene (CDNB) | Sigma-Aldrich | CAS#97-00-7 |
| P1,P5-di(adenosine-5’)pentaphosphate (Ap5A) | Sigma-Aldrich | CAS#4097-04-5 |
| Glucose-phosphate dehydrogenase | Sigma-Aldrich | CAS#9001-40-5 |
| Hexokinase (HK) | Sigma-Aldrich | CAS#9001-51-8 |
| β-Nicotinamide adenine dinucleotide phosphate (NADP+) | Sigma-Aldrich | CAS#53-59-8 |
| D-Glucose | Sigma-Aldrich | CAS#50-99-7 |
| Merocyanine 540 | Thermo Fisher | Cat#M24571 |
| Cholesterol, ovine wool >98% | Avanti Polar Lipids | Cat#700000P |
| 1,2-dipalmitoyl-sn-glycero-3-phosphocholine (DPPC) | Avanti Polar Lipids | Cat#850355P |
| 1,2-dioleoyl-sn-glycero-3-phosphoethanolamine | Avanti Polar Lipids | Cat#850725P |
| 1,2-dioleoyl-sn-glycero-3-phospho-L-serine | Avanti Polar Lipids | Cat# 840035P |
| Chloroform (HPLC grade) | Fisher Scientific | Cat#C607SK |
| Water, Optima LC/MS grade | Fisher Scientific | Cat#W6 |
| Acetonitrile, Optima LC/MS grade Methanol, Optima LC/MS grade | Fisher Scientific Fisher Scientific | Cat#A-955 Cat#A-456 |
| Isopropanol, Optima LC/MS grade | Fisher Scientific | Cat#A-461 |
| 1-methyl-2-vinylpyridinium trifluoromethanesulfonate | Sigma-Aldrich | CAS#339530-78-8 |
| n-ethylnaleimide (NEM) | Sigma-Aldrich | CAS#128-53-0 |
| o-phthalaldehyde (OPA) | Sigma-Aldrich | CAS#643-79-8 |
| Acivicin | Sigma-Aldrich | CAS# 42228-92-2 |
| Glacial Acetic Acid | EMDmillipore | Cat#AX0074-6 |
| Trichloroacetic acid (TCA) | Crescent Chemical | 36910.01 |
| Perchloric Acid (70%) | Sigma-Aldrich | CAS#7601-90-3 |
| Boric acid | Sigma-Aldrich | CAS#10043-35-3 |
| L-serine | Sigma-Aldrich | CAS#56-45-1 |
| L-glutathione oxidized | Sigma-Aldrich | CAS#27025-41-8 |
| L-glutathione reduced | Sigma-Aldrich | CAS#70-18-8 |
| Water-soluble 17β-estradiol | Sigma-Aldrich | Cat#E4389 |
| 17(5-estradiol | Sigma-Aldrich | Cat#E8875 |
| 17(5-estradiol-D5 (100 µg/mL) Internal Standard | Cerilliant | Cat#E061 |
| Critical Commercial Assays | ||
| Pierce BCA Protein Assay Kit | Thermo Fisher | Cat#23225 |
| Ultra-Sensitive Mouse Insulin ELISA Kit | Crystal Chem Inc. | Cat#90080 |
| Reduced and oxidized glutathione Kit | Oxis Research | Cat#21040 |
| Citrate Synthase Activity Kit | Sigma-Aldrich | Cat#CS0720 |
| IScriptTM cDNA synthesis Kit | BioRad | Cat#1725037 |
| Experimental Models: Organisms/Strains | ||
| 8 week-old female C57Bl/6N mice | The Jackson Laboratory | Stock#005304 |
| Male HSA-Cre79 mice | The Jackson Laboratory | Stock#006149 |
| Female ERα-floxed mice | (Hewitt et al., 2010) | |
| Oligonucleotides (pre-validated primers for qPCR) | ||
| mouse thioredoxin 2 (ref NM_013711) forward primer: 5’- GCTTCTGGCAAGGAAGACAC-3’ reverse primer: 5’- CCAGCCTTCTCCAGATTCAA-3’ | Invitrogen | N/A |
| mouse glutathione reductase (ref NM_010344) forward primer: 5’- TGGTGGAGAGTCACAAGCTG −3’ reverse primer: 5’- TTGAAAGCCGTAATCCACG −3’ | Invitrogen | N/A |
| mouse superoxide dismutase 2 (ref NM_013671) forward primer: 5’- ACTGAAGTTCAATGGTGGGG-3’ reverse primer: 5’- GCTTGATAGCCTCCAGCAAC-3’ | Invitrogen | N/A |
| mouse ribosomal protein L32 (ref NM_172086) forward primer: 5’-TTCCTGGTCCACAATGTCAA-3’ reverse primer: 5’-GGCTTTTCGGTTCTTAGAGGA-3’ | Invitrogen | N/A |
| Floxed ERα: Forward primer: 5’-TCACATGGAGTGAATGCTCTG-3’ Reverse Primer: 5’-AGTGAACACCAGGCCAGTTT-3’ | Invitrogen | N/A |
| Other | ||
| Micro-osmotic pump | Alzet | Model#1002 |
| Estradiol 60-day release pellet | Inn Res of America | Cat#SE-121 |
| SPE strata™-X 33 µm Polymeric Reversed Phase 10 mg/1mL tubes | Phenomenex | Cat#8B–S100-AAK |
CONTACT FOR REAGENT AND RESOURCE SHARING
Further information and requests for resources and reagents should be directed to and will be fulfilled by the Lead Contact, P. Darrell Neufer (neuferp@ecu.edu).
EXPERIMENTAL MODEL
All animal studies were approved by the Institutional Animal Care and Use Committees at East Carolina University or the University of Minnesota in accordance with international regulations. C57BL/6NJ female mice were housed in a temperature-controlled (22 °C) facility with a 12 hr light/dark cycle, and free access to food (standard chow diet) and water. Body composition was determined using Echo MRI, and metabolic characterization was performed in metabolic cages (Phenomaster/labmaster, TSE Systems, Chesterfield, MO) after a 48 hr acclimatization period. Mice were ovariectomized at 10 weeks of age and sacrificed 2 weeks later (OVX-2w), or implanted with a subcutaneous micro-osmotic pump to receive 2 weeks of E2 therapy (OVX-4w[E2]) or control saline solution (OVX-4w[ctl]). The short-term interventions were selected based on previous observations that support early onset of E2 administration for rescue of metabolic parameters (Lopez-Grueso et al., 2014). A control group included normally cycling females in the Proestrus stage of the estrus cycle at the time of sacrifice (NC-Pro), to ensure high physiological E2 plasma levels (Figure S1). Mini-osomotic pumps were removed at sacrifice to measure the remaining volume of solution in the compartment. Exclusion criteria included any pump that failed to deliver >85% of the intended estrogen dose (only one pump failed/mouse excluded). At sacrifice, mice were anesthetized with an intraperitoneal ketamine injection prior to tissue collection. Portions of the red gastrocnemius (RG) muscles were dissected for permeabilized fiber bundles (PmFBs) preparations. Soleus and EDL muscles were dissected for ex-vivo measurement of insulin-stimulated 2-deoxyglucose uptake.
Mice lacking ERα specifically in skeletal muscle (skmERαKO) were generated by breeding ERα-floxed mice (Hewitt et al., 2010) with human skeletal actin cre (HSAcre) mice. Genotype was determined by PCR using primers for floxed ERα and HSAcre. At 12–16 weeks of age, mice underwent OVX or sham surgeries, and a subgroup of OVX mice received E2 treatment (OVX+E2) after OVX via implantation of 60-day time-release pellets containing 0.18 mg of 17β-estradiol. At 6–7 weeks post-surgery, mice were anesthetized by intraperitoneal injection of pentobarbital sodium (100 mg/kg body mass), and quadriceps and hamstrings muscles were collected for mitochondria isolation. Normally cycling, age-matched ERα-floxed littermates were used as controls.
METHOD DETAILS
Animal use
Estrus cycle was monitored daily via vaginal lavage with distilled water and cytology (Frasier et al., 2013) (See Figure S1). Normally-cycling females in Proestrus were assigned to sacrifice and tissue collection the same day, and represented the control group. The ovariectomy (OVX) mouse model has been used extensively to study the impact of E2 loss, and the development of glucose intolerance and IR in long-term (8+ weeks) OVX mice is well established (Bailey and Ahmed-Sorour, 1980; Riant et al., 2009). However, long-term OVX also leads to increased adiposity, inflammation, and decreased energy expenditure (Rogers et al., 2009). Mice were randomized for OVX. Uterine mass at sacrifice was reported as a biomarker of circulating estrogen levels (Wood et al., 2007). OVX mice were randomized to receive E2 therapy or a control solution. Because the pumps are not compatible with organic solvents, water-soluble 17β-estradiol was dissolved in sterile saline. The E2 solution was made fresh the day of pump implantation, and filtered through a 0.2 µm Millipore membrane. Each pump contained 100 µL of a 0.743 mM E2 solution (calculated based on a 46.7mg/g solid purity), set up at a release rate of 0.25 µL/hr, thus delivering ~1.2 µg E2 per day, an amount previously shown to restore circulating physiological levels and protect against glucose intolerance and muscle insulin resistance in mice (Camporez et al., 2013; Ingberg et al., 2012; Riant et al., 2009).
Glucose and insulin tolerance tests (GTTs, ITTs), and plasma insulin measurements
Experiments and analyses were performed based on recommendations from McGuiness et al. (McGuinness et al., 2009). Mice were fasted for 5 hrs, and administered an intraperitoneal glucose injection (2.5 g/kg fat-free mass) of a 50% dextrose saline solution. Blood glucose was measured from the tail vein using an AlphaTrak 2 animal glucometer (Abbott laboratories) at 0, 15, 30, 60, and 90 min post-injection. Glucose tolerance was assessed by calculating the area under the curve (AUC) after normalizing to fasting blood glucose levels. For insulin tolerance tests (ITTs), mice were fasted for 5 hrs and administered an intra-peritoneal injection of insulin (0.5 U/Kg lean mass). Glucose levels were determined at 0, 10, 20, 30, and 40 min time points. Insulin sensitivity was calculated from the slope 0–30 min. Blood samples collected after a 5 hr fast (using hepinarized capillary tubes) were used to measure insulin.
Ex-vivo insulin-stimulated muscle glucose uptake
Ex vivo basal and insulin stimulated 3H-2-Deoxy-glucose uptake were measured as previously reported (Fisher-Wellman et al., 2016). Muscles were carefully dissected and pre-incubated in Krebs-Henseleit buffer supplemented with 1 mM pyruvate and oxygenated at 95% O2, 5% CO2, at 37 °C for 20 min. Next, muscles were incubated with insulin (50 mU/mL) for 30 min, and finally transferred to incubation wells containing 1 mM 2-DOG and 0.2 µCi/mL 3H-2-DOG to quantify glucose transport, and 2 mM mannitol and 0.1 µCi/mL 14C-D-mannitol to determine extracellular space with or without insulin (50 mU/mL) for 15 min while continuously gassed with 95% O2, 5% CO2. Muscles were freeze-dried in liquid N2, weighed, solubilized in 0.5 mL of 0.5 N NaOH and stabilized in scintillation fluid. Simultaneous counting of 14C and 3H channels was performed in a Perkin Elmer Tri-Carb 2800TR liquid scintillation counter.
Permeabilized muscle fiber bundle (PmFB) preparation
PmFBs were prepared as previously described (Anderson et al., 2009). Briefly, portions of red gastrocnemius (RG) muscle were dissected and immediately placed in ice-cold buffer X (50 mM K-MES, 35 mM KCl, 7.23 mM K2EGTA, 2.77 mM CaK2EGTA, 20 mM imidazole, 20 mM taurine, 5.7 mM ATP, 14.3 mM phosphocreatine, and 6.56 mM MgCl2-6H2O, pH=7.1) for separation under microscope. Separated fiber bundles were incubated on a rocker in buffer X containing 30 µg/mL saponin for 30 min at 4 °C, and finally transferred to buffer Z (105 mM K-MES, 30 mM KCl, 1mM EGTA, 10 mM K2HPO4, 5 mM MgCl2-6H2O, 0.5 mg/mL BSA, pH=7.1) at 4 °C for 15 min, or until experimentation. At the conclusion of the experiment, fibers were rinsed in dH2O and freeze-dried to determine dry weight.
Mitochondrial respiration (JO2) and JH2O2 measurements
JO2 was measured by high-resolution respirometry (O2K, OROBOROS Innsbruck, Austria), in buffer Z supplemented with 20 mM creatine monohydrate and 25 µM blebbistatin. Concentrations of substrates added: 10 mM glutamate, 2 mM malate, 4 mM ADP, 10 mM succinate, 10 µM rotenone, 10 µM antimycin A, 2 mM ascorbate, 0.5 mM TMPD (N,N,N′,N′-Tetramethyl-p-phenylenediamine dihydrochloride), 0.5 µM FCCP. For fatty acid-supported JO2: 20 µM palmitoyl-carnitine (PC), 20 µM palmitoyl-CoA (P-CoA), 5 mM L-carnitine (L-Carn), 1 mM ADP, 0.5 µM FCCP. L-carnitine was added to facilitate export of acetyl-CoA (product of β-oxidation) out of the mitochondrial matrix via the carnitine-acetyltransferase enzyme (Muoio et al., 2012). JH2O2 was measured using the Amplex UltraRed/Horseradish Peroxidase fluorescence system in FluoroMax/Fluorolog spectrofluorometers (HORIBA Jobin Yvon). All JH2O2 experiments were performed in buffer Z supplemented with 10 µM Amplex UltraRed (Invitrogen), 20 U/mL CuZn SOD, and 25 µM Blebbistatin. Substrate concentrations utilized: 1 mM pyruvate or 10 mM succinate, 1 µM 1,3-bis(2-chloroethyl)-1-nitrosourea (BCNU), 1 µM auranofin, 1 µM 1-chloro-2,4-dinitrobenzene (CDNB). Alternatively, for experiments using isolated mitochondria, JO2 and JH2O2 measurements were performed using the same buffer conditions and 20 µg of total mitochondrial protein. For in-vitro E2 exposure experiments, isolated mitochondria were re-suspended in sucrose isolation medium +/− E2 at a final concentration of 3 nM (2 ng E2/mg mitochondrial protein) and incubated for 10 min at 37 °C. After a last centrifugation step (10 min, at 10,000 G, at 4 °C), the final pellet was re-suspended in 200 µL sucrose medium.
Glutathione redox state
Reduced (GSH) and oxidized (GSSG) glutathione concentrations were measured by a standard assay or HPLC adapted from (Giustarini et al., 2013; Kand’ar et al., 2007). For the standard assay, frozen RG muscles were homogenized in 500 µL TE buffer (10 mM Tris-base, 1 mM EDTA, pH=7) previously bubbled with N2 (g) and with protease and phosphatase inhibitor cocktails added. Immediately following, a 200 µL aliquot was added to a tube containing the alkylating agent, 1-methyl-2-vinylpyridinium trifluoromethanesulfonate (M2VP, final concentration 0.5 mM). Both the original sample and the sample treated with M2VP were centrifuged (10,000 rpm, 4°C) and the supernatants were used to measure GSH and GSSG using the reagents and calibration set provided by the kit. For GSH/GSSG determination by HPLC, GSH was measured as its conjugate with n-ethylmaleimide (NEM), which binds thiol groups on GSH as well as potently inhibiting glutathione reductase to prevent changes in GSSG levels through reductions and auto-oxidation of GSH to GSSG. NEM was added to the homogenization buffer, and whole gastrocnemius was homogenized immediately after collection. GS-NEM conjugate was measured by UV-detection, in which two diasteriomers are visible as equally-sized peaks in the chromatogram. GSSG was measured in a parallel sample of the muscle homogenate using fluorescent detection of GSSG binding to o-phthalaldehyde (OPA) at pH=12.
Mitochondrial isolation and relative specific activity of mitochondrial OXPHOS complexes
Quadriceps, hamstrings, plantaris, soleus and whole gastrocnemius muscles were harvested and immediately homogenized in mitochondrial isolation medium (0.3 M sucrose, 10 mM HEPES, 1 mM EGTA) containing 1 mg/mL BSA, on ice (adapted from (Frezza et al., 2007)). Specific activities of individual ETS complexes, and I/II+III were measured spectrophotometrically (Barrientos, 2002). Muscle homogenates were subjected to a first centrifugation step (800 G/ 10 min/ 4 °C). The supernatant was again centrifuged (1,200 G/10 min/4 °C), and the pellet was re-suspended in mitochondrial isolation media (no BSA) for a last centrifugation step (1,200 G/10 min/4 °C). The final pellet was re-suspended in 150 µL mitochondrial isolation medium, and protein quantification was assessed using the BCA Protein assay kit. A representative Western showing molecular markers of mitochondria (cytochrome oxidase 2, Cox2), peroxisome (Pex16), sarcoplasmic reticulum (SERCA1), plasma membrane (Na/K-ATPase), and cytoskeleton (α-tubulin) in various fractions collected during isolation of mitochondria is shown in Fig S7. Isolated mitochondria were diluted in hypotonic medium (25 mM K2HPO4, 5.3 mM MgCl2, pH=7.2) giving a final concentration of 0.8 mg/mL, and further subjected to 3–4 freeze-thaw cycles. Complex I activity was determined in 5 mM Tris, 0.5 mg/mL BSA, 24 µM KCN, 0.4 µM antimycin A, pH=8, following the oxidation of NADH (0.8 mM) at 340nm (ε340 = 6220 M−1 cm−1) for 3 min using oxidized decyl-ubiquinone (50 µM DCUox) as the electron acceptor. Rotenone (4 µM) was added to measure rotenone-sensitive NADH-DCU oxidoreductase activity. Complex II activity was measured in SQR medium (10 mM KH2PO4, 2 mM EDTA, 1 mg/mL BSA) in the presence of 10 mM succinate, following the reduction of dichlorophenolindophenol (80 µM DCPIP) at 600 nm (ε340 = 19100 M−1cm−1) for 3 min, using DCUox as the electron acceptor. The reaction was inhibited by the addition of the competitive substrate malonate (10 mM). Complex III activity was measured in SQR medium supplemented with 200 µM ATP, and 240 µM KCN, using DCUred (80 mM) as electron donor and Cyt Cox as acceptor (40 µM). The reaction was followed measuring the reduction of Cyt C at 550 nm (ε340 = 18500 M−1cm−1) for 3 min, and finally inhibited by the addition of 0.4 µM antimycin A. Activity of complex I+III was determined in the same medium as complex I (without antimycin A), in the presence of 40 µM Cyt Cox and 0.8 mM NADH, following the reduction of Cyt C at 550 nm. Complex II+III activity was determined in SQR medium supplemented with 0.2 mM ATP, 4 µM rotenone, and 10 mM succinate, following the reduction of Cyt C (40 µM) for 5 min at 550 nm, and stopped with the addition of the competitive inhibitor malonate (10 mM).
Mitochondrial content
Citrate synthase activity was measured by kit in RG homogenates or isolated mitochondria. OXPHOS complexes expression was measured in isolated mitochondria by reducing Western blot analysis using Anti-Rt/Ms total OXPHOS complex cocktail. Equal protein load (25 µg/well) and consistent gel transfer was verified by Ponceau-S stain. Blots were imaged using a Licor IR imager, and quantified with Image Studio Lite (V. 5.0, Li cor Bioscience).
Simultaneous real-time measurements of mitochondrial JO2 and JATP
ATP production was measured fluorometrically via the 1:1 stoichiometry with NADPH production from the glucose-dependent, hexokinase-catalyzed ATP hydrolysis following the glucose-phosphate dehydrogenase-catalyzed reduction of NADP+ (Lark et al., 2016). 1 U/mL hexokinase, 2.5 mM glucose, 2.5 mM glucose-phosphate dehydrogenase (G6PDH), and 2.5 mM NADP+ was added to 5 µg/mL isolated mitochondria in buffer Z, at 37 °C. To inhibit adenylate kinase, a potential alternative source of ATP synthesis, 0.2 mM Ap5A (P1,P5-di(adenosine-5’)pentaphosphate) was included in the experiments. Respiration was supported by 0.5 mM malate, 5 mM pyruvate, 5 mM glutamate, and 5 mM succinate. NADPH was measured by autofluorescence (λex = 340, λ em= 460) simultaneously with O2 consumption using a customized system integrating fluorescence (FluoroMax-3; Horiba Jobin Yvon, Edison, NJ) with high-resolution respirometry (Oroboros Oxygraph-2k, Innsbruck, Austria) via a fiber optic cable (Fiberguide Industries). Rates of ATP synthesis (JATP) were quantified using an ATP titration standard curve generated in the presence of the enzyme-coupled system and substrates. Steady-state OXPHOS flux rates (JO2 and JATP) were determined after a single addition of 20 µM ADP.
Synthesis of biomimetic mitochondrial membranes
Large-unilamellar vesicles (LUVs) were prepared as previously described (Shaikh et al., 2009), using phosphatidylcholine (PC), phosphatidylethanolamine (PE), and phosphatidylserine (PS) in relative ratios of approximately (50:40:6 (PC/PE/PS)), similar to the ratio found in heart inner mitochondrial membrane (Osman et al., 2011). Briefly, PC/PE/PS mixes were co-dissolved in chloroform, and dried under a gentle stream of N2 gas. Subsequently, 0.1 mg/mL 17P–estradiol in ethanol was added in increasing amounts to the dry lipids, and dried again under N2. Residual chloroform and ethanol were removed in the dark with vacuum pumping for 2 hrs. Lipids were hydrated in 2 mL of 10 mM sodium phosphate buffer pH=7.4, making E2 concentrations of 3.23 µM, 6.45 µM and 31.5 µM for the 0.5, 1 and 5 mol% E2 mixtures, and subjected to three freeze-thaw cycles followed by extrusion with a 1 µm membrane (Avanti Polar Lipids) to generate LUVs. All lipid mixtures contained 750 µg of total lipid, and thus E2 concentrations were set at 2.35 mg E2/g total lipid (0.5 mol% E2), 4.69 mg E2/g total lipid (1 mol% E2), and 22.8 mg E2/g total lipid. LUVs containing 12 mol% cholesterol (60 mg cho/g total lipid) served as a negative control. Studies were conducted to assess the impact of increasing E2 mass in LUVs on MC-540 fluorescence.
Monolayer Studies
Pressure-area (π-A) isotherms were collected according to (Pennington et al., 2016; Shaikh et al., 2001). Chloroform was used as the solvent for the monolayer studies. Highly purified deionized water was used throughout the monolayer studies and was purified via Mili-Q Water Purification System (Millipore, Milford, MA). Monolayer studies were performed using a custom Langmuir-Blodgett Trough (KSV Instruments, Helsinki Finland), and a paper Wilhelmy plate. Lipid monolayers composed of DPPC and cholesterol / E2 were spread onto a sterile sub-phase (filtered with 10 mM NaH2PO4 buffer, pH=7.4) using chloroform at 23 °C. The organic solvent was allowed to evaporate prior to compression (3.0 mm/min), and all isotherms were collected in triplicates. For each π-A isotherm, the (Mma)/molecule was determined by extrapolation from target surface pressures (15 and 30 mN/m). Each π-A isotherm was used to determine the monolayer compressibility by calculating the surface elasticity moduli (Cs−1): Cs−1 = (−A)(dπ/dA)π, where A is the Mma/molecule of the lipid mixture at a surface pressure π.
Membrane microviscosity assessment by fluorescence spectra of merocyanine (MC540)
As previously described in (Zeczycki et al., 2014). Fresh isolated mitochondria (200 µg), was equilibrated with 100 nM MC540 in sucrose isolation media for 5 min at 37 °C. Fluorescence spectra (λex = 495, λem = 540–660nm) were collected in a FluoroMax spectrofluorometer (HORIBA Jobin Yvon). Peak values were reported for analysis.
Solid-phase extraction of estradiol from mitochondrial membranes
The protocol was modified from the recommendations by Phenomenex® (Huq et al., 2008; Wei et al., 2016). To take into account the efficiency of the extraction step, isolated skeletal muscle mitochondria (500 µg mitochondrial protein) were freeze-fractured and spiked with 20 µL of deuterated E2 internal standard (ISTD, 1 µg/µL), diluted with 1 mL of water, and subjected to a solid phase extraction using Phenomenex Strata™-X 33 µm Polymeric Reversed Phase, 10 mg/1 mL columns. For control experiments, selected samples were also spiked with 20 µL of 1 mg/mL E2 for confirmation, and selected E2 standards were spiked with 20 µL of 1 M NaCl to measure and verify the chloride adduct observed (described below). A Biotage-48 position positive pressure solid-phase extraction (SPE) manifold was connected to a high purity nitrogen tank and was designed for 1 mL SPE cartridges. The manifold was set to a low pressure approximately 10 psi for conditioning and sample extractions. The SPE cartridges were conditioned using 400 µL methanol and 400 µL water. After sample loading, the cartridges were washed with water 2× 800 µL and dried with nitrogen flow 30 psi. The E2 was eluted and collected in 15 mL glass culture tubes using 2× 200 µL methanol and 200 µL acetonitrile. The 600 µL sample was evaporated to dryness under nitrogen and reconstituted in 50 µL acetonitrile. The samples were set on a shaker for ~5 min and centrifuged at 800 RPM for 2 min. The volume was transferred using glass pipettes into a 1.5 mL autosampler vial with a 200 µL vial insert and analyzed using liquid chromatography-mass spectrometry (10 µL was injected).
Quantification of E2 via LC / MSMS
Analysis was conducted on either a Waters Acquity UPLC/Waters Micromass quadrupole time-of-flight mass spectrometer, or an ExionLC/AB Sciex 3200 triple quadrupole mass spectrometer (LC/MSMS). Samples and standards in autosampler vials were placed in a refrigerated holder (4 °C). LC was performed at 40 °C using a Kinetex C18 2.6 µm column (2.1 × 50 mm) with a SecurityGuard™ ULTRA cartridges for C18 UHPLC, sub-2µm and core-shell columns with 2.1mm internal diameters (Phenomenex). The mobile phase consisted of 95/5 water / acetonitrile (A) and 60:20:20 of acetonitrile / isopropanol / methanol (B) delivered as a gradient as follows: 0–2 min 5% B, 2–6 min 60% B, 6–11 min 90% B, 11–13 min 95%B, 13–15 min 5%B, and 18 min 5%B. The flow rate was set at 0.3 mL/min and 10 µL of sample was injected. For data quantification, the integration of peak areas (E2 and ISTD) was conducted using MassLynx 4.1 (Waters), and from the ratio of the E2 to the deuterated internal standard, as well as an internal standard curve, the E2 concentration in ng E2 per mg of mitochondrial protein was calculated. The background signal in the sucrose isolation medium (blank) was subtracted from all samples.
The LC/MSMS mass spectrometer ExionLC/AB Sciex 3200 triple quadrupole was operated in negative ionization mode using multiple reaction monitoring (MRM) scans. The source temperature was maintained at 500 °C and a dwell time of 50 ms was used per each scan. The following MRM scans were monitored:
| Q1 Mass (Da) | Q3 Mass (Da) | Collision Energy | Declustering/entrance/collision entrance/collision exit Potentials |
|---|---|---|---|
| 276.2 | 147.1 | −56 | −85/-10/-24/-2 |
| 276.2 | 187.0 | −58 | −85/-10/-22/0 |
| 271.2 | 145.1 | −56 | −85/-7/-22/-2 |
| 271.2 | 169.1 | −62 | −85/-7/-30/-6 |
| 271.2 | 183.1 | −59 | −85/-7/-30/-1 |
| 307.2 | 183.1 | −34 | −5/-3.5/-18/0 |
In the Waters Acquity UPLC/Waters Micromass QTOF MS, electrospray ionization mass spectrometry was collected using negative ionization mode. Instrument parameters: capillary voltage 3000 V, sample cone 30 V, extraction cone 1 V, desolvation temperature 200 °C, source temperature 120 °C, and the desolvation flow rate set to 500 L/hr. In this platform, the E2 molecule was measured as a chloride adduct in the mitochondrial extracts due to the high levels of salt present, thus identified as a m/z of 307.4 Da (= E2 (271 Da) + Cl (35.4 Da)). The chloride adduct was confirmed to be 500 times more abundant than the deprotonated molecular ion in the mitochondrial samples, explaining why the m/z 271 Da of E2 was easily detected in the LUV samples, but the m/z 307 Da was stronger in mitochondrial samples in isolation media. Control experiments that involved the addition of sodium chloride prior to extraction (Figure S6B), as well as validation in a more sensitive LC/MS platform (performed by SCIEX®), confirmed the identification of the m/z 271 Da in the mitochondrial extracts (see below “Confirmation of E2-Cl adduct”). Mass spectra was collected over the mass range 20–1500 Da and MSMS for 271 and 307 Da was also collected. The CID was set to 20 and 35 for 271 and 307 Da, respectively.
Confirmation of E2-Cl adduct
To confirm identification of the E2-chloride adduct, a second LC-MS was utilized for select samples including two from each group. The LC-MS was a Shimadzu LC/Sciex 6500 plus QTRAP. The same chromatography conditions as listed above were applied to a Phenomenex Kinetex XB-C18, 2.1×30 mm, 2.6 µm, 100 Å. Three MRM transitions for the [M-H]− and one transition for the [M+Cl]− was monitored for estradiol and are shown below:
| Molecular ion(Da) |
Fragment | Collision Energy |
|---|---|---|
| 271 | 143 | −53 |
| 271 | 145 | −53 |
| 271 | 183 | −70 |
| 307 | 183 | −53 |
Quantitative PCR
70–80 mg of white gastrocnemius was homogenized in TRIzol reagent to extract total RNA, and 1 µg RNA was reverse-transcribed using IScriptTM cDNA synthesis kit. Quantitative PCR was performed in a ViiaTM 7 Real-Time PCR System (Life Technologies, Grand Island, NY) using SYBR® Green reagent. Assays were performed in triplicates and final values were normalized to ribosomal L32 mRNA levels. Pre-validated primers were purchased from Invitrogen:
QUANTIFICATION AND STATISTICAL ANALYSIS
Data are presented as means ± SEM. The data displayed normal distributions which allowed for parametric analyses. Comparisons between 2 groups were performed by independent (* vs. NC-Pro) or paired (! vs OVX-4w) when applicable, Student’s t-tests. Comparisons between 3 or 4 groups were performed with one-way ANOVA, followed by Sidak’s multiple comparisons test (* vs. NC-Pro, and # vs. OVX-4w[ctl]). Graph Pad Prism 7 was used for statistical analysis and data presentation. Statistical parameters can be found in figure legends.
Supplementary Material
HIGHLIGHTS.
E2 restores redox balance and insulin sensitivity in skeletal muscle after ovariectomy
E2 localizes to mitochondria independently of ERα and lowers membrane microviscosity
E2 promotes bioenergetic function through complex I, electron transfer and OXPHOS
The fine-tuning effect of E2 in mitochondria influences energy homeostasis
Acknowledgments
We would like to acknowledge SCIEX® application specialist Robert Proos (Framingham, MA), for his help on further validation of MS/MS data and analysis. This work was supported by U.S. Public Health Services grant R01 HL123647, R01 AT008375 (S.R.S.), ADA (BS-1-15-170 (E.E.S.), R01 AG031743 (D.A.L), and R01 DK096907 (P.D.N.).
Footnotes
Publisher's Disclaimer: This is a PDF file of an unedited manuscript that has been accepted for publication. As a service to our customers we are providing this early version of the manuscript. The manuscript will undergo copyediting, typesetting, and review of the resulting proof before it is published in its final citable form. Please note that during the production process errors may be discovered which could affect the content, and all legal disclaimers that apply to the journal pertain.
AUTHOR CONTRIBUTIONS
Conceptualization and Methodology, M.J.T. and P.D.N.; Investigation, M.J.T., T.E.R, A.M.F., C.A.S., C.T.L. and K.A.B. Lipid vesicles and monolayer studies were performed by S.R.S. and E.R.P. Estrogen extractions and LC/MS studies were performed by K.A.K. and M.J.T.; studies with skmERαKO mice were performed by S.K., M.J.T and D.A.L.; Validation and Formal Analysis, M.J.T.; Writing–Original Draft, M.J.T.; Reviewed, L.A.G., E.E.S., T.N.Z., S.R.S.; Reviewed and edited, P.D.N.
Supplemental information includes seven supplemental figures.
CONFLICTS OF INTEREST
The authors report no conflicts of interest.
References
- Andersen OS, Koeppe RE., 2nd Bilayer thickness and membrane protein function: an energetic perspective. Annu Rev Biophys Biomol Struct. 2007;36:107–130. doi: 10.1146/annurev.biophys.36.040306.132643. [DOI] [PubMed] [Google Scholar]
- Anderson EJ, Lustig ME, Boyle KE, Woodlief TL, Kane DA, Lin CT, Price JW, 3rd, Kang L, Rabinovitch PS, Szeto HH, et al. Mitochondrial H2O2 emission and cellular redox state link excess fat intake to insulin resistance in both rodents and humans. J Clin Invest. 2009;119:573–581. doi: 10.1172/JCI37048. [DOI] [PMC free article] [PubMed] [Google Scholar]
- Appiah D, Winters SJ, Hornung CA. Bilateral oophorectomy and the risk of incident diabetes in postmenopausal women. Diabetes Care. 2014;37:725–733. doi: 10.2337/dc13-1986. [DOI] [PubMed] [Google Scholar]
- Arias-Loza PA, Muehlfelder M, Pelzer T. Estrogen and estrogen receptors in cardiovascular oxidative stress. Pflugers Arch. 2013;465:739–746. doi: 10.1007/s00424-013-1247-7. [DOI] [PubMed] [Google Scholar]
- Bailey CJ, Ahmed-Sorour H. Role of ovarian hormones in the long-term control of glucose homeostasis. Effects of insulin secretion. Diabetologia. 1980;19:475–481. doi: 10.1007/BF00281829. [DOI] [PubMed] [Google Scholar]
- Barrientos A. In vivo and in organello assessment of OXPHOS activities. Methods. 2002;26:307–316. doi: 10.1016/S1046-2023(02)00036-1. [DOI] [PubMed] [Google Scholar]
- Behl C, Skutella T, Lezoualc’h F, Post A, Widmann M, Newton CJ, Holsboer F. Neuroprotection against oxidative stress by estrogens: structure-activity relationship. Mol Pharmacol. 1997;51:535–541. [PubMed] [Google Scholar]
- Bellanti F, Matteo M, Rollo T, De Rosario F, Greco P, Vendemiale G, Serviddio G. Sex hormones modulate circulating antioxidant enzymes: Impact of estrogen therapy. Redox Biol. 2013;1:340–346. doi: 10.1016/j.redox.2013.05.003. [DOI] [PMC free article] [PubMed] [Google Scholar]
- Bolton JL, Thatcher GR. Potential mechanisms of estrogen quinone carcinogenesis. Chem Res Toxicol. 2008;21:93–101. doi: 10.1021/tx700191p. [DOI] [PMC free article] [PubMed] [Google Scholar]
- Boyar H, Severcan F. Oestrogen-phospholipid membrane interactions: an FTIR study. J Mol Structure. 1996;408-409:269–272. [Google Scholar]
- Brand JS, van der Schouw YT, Onland-Moret NC, Sharp SJ, Ong KK, Khaw KT, Ardanaz E, Amiano P, Boeing H, Chirlaque MD, et al. Age at menopause, reproductive life span, and type 2 diabetes risk: results from the EPIC-InterAct study. Diabetes Care. 2013;36:1012–1019. doi: 10.2337/dc12-1020. [DOI] [PMC free article] [PubMed] [Google Scholar]
- Brand MD. The sites and topology of mitochondrial superoxide production. Exp Gerontol. 2010;45:466–472. doi: 10.1016/j.exger.2010.01.003. [DOI] [PMC free article] [PubMed] [Google Scholar]
- Brinton RD. The healthy cell bias of estrogen action: mitochondrial bioenergetics and neurological implications. Trends Neurosci. 2008;31:529–537. doi: 10.1016/j.tins.2008.07.003. [DOI] [PMC free article] [PubMed] [Google Scholar]
- Bryzgalova G, Gao H, Ahren B, Zierath JR, Galuska D, Steiler TL, Dahlman-Wright K, Nilsson S, Gustafsson JA, Efendic S, et al. Evidence that oestrogen receptor-alpha plays an important role in the regulation of glucose homeostasis in mice: insulin sensitivity in the liver. Diabetologia. 2006;49:588–597. doi: 10.1007/s00125-005-0105-3. [DOI] [PubMed] [Google Scholar]
- Bryzgalova G, Lundholm L, Portwood N, Gustafsson JA, Khan A, Efendic S, Dahlman-Wright K. Mechanisms of antidiabetogenic and body weight-lowering effects of estrogen in high-fat diet-fed mice. Am J Physiol Endocrinol Metab. 2008;295:E904–912. doi: 10.1152/ajpendo.90248.2008. [DOI] [PMC free article] [PubMed] [Google Scholar]
- Campbell SE, Mehan KA, Tunstall RJ, Febbraio MA, Cameron-Smith D. 17beta-estradiol upregulates the expression of peroxisome proliferator-activated receptor alpha and lipid oxidative genes in skeletal muscle. J Mol Endocrinol. 2003;31:37–45. doi: 10.1677/jme.0.0310037. [DOI] [PubMed] [Google Scholar]
- Camporez JP, Jornayvaz FR, Lee HY, Kanda S, Guigni BA, Kahn M, Samuel VT, Carvalho CR, Petersen KF, Jurczak MJ, et al. Cellular mechanism by which estradiol protects female ovariectomized mice from high-fat diet-induced hepatic and muscle insulin resistance. Endocrinology. 2013;154:1021–1028. doi: 10.1210/en.2012-1989. [DOI] [PMC free article] [PubMed] [Google Scholar]
- Catala A. Lipid peroxidation modifies the picture of membranes from the “Fluid Mosaic Model” to the “Lipid Whisker Model”. Biochimie. 2012;94:101–109. doi: 10.1016/j.biochi.2011.09.025. [DOI] [PubMed] [Google Scholar]
- Chen JQ, Yager JD, Russo J. Regulation of mitochondrial respiratory chain structure and function by estrogens/estrogen receptors and potential physiological/pathophysiological implications. Biochim Biophys Acta. 2005;1746:1–17. doi: 10.1016/j.bbamcr.2005.08.001. [DOI] [PubMed] [Google Scholar]
- Choe M, Jackson C, Yu BP. Lipid peroxidation contributes to age-related membrane rigidity. Free Radic Biol Med. 1995;18:977–984. doi: 10.1016/0891-5849(94)00217-8. [DOI] [PubMed] [Google Scholar]
- Colell A, Garcia-Ruiz C, Lluis JM, Coll O, Mari M, Fernandez-Checa JC. Cholesterol impairs the adenine nucleotide translocator-mediated mitochondrial permeability transition through altered membrane fluidity. J Biol Chem. 2003;278:33928–33935. doi: 10.1074/jbc.M210943200. [DOI] [PubMed] [Google Scholar]
- Custodio JB, Almeida LM, Madeira VM. A reliable and rapid procedure to estimate drug partitioning in biomembranes. Biochem Biophys Res Commun. 1991;176:1079–1085. doi: 10.1016/0006-291x(91)90394-m. [DOI] [PubMed] [Google Scholar]
- D’Eon TM, Souza SC, Aronovitz M, Obin MS, Fried SK, Greenberg AS. Estrogen regulation of adiposity and fuel partitioning. Evidence of genomic and non-genomic regulation of lipogenic and oxidative pathways. J Biol Chem. 2005;280:35983–35991. doi: 10.1074/jbc.M507339200. [DOI] [PubMed] [Google Scholar]
- Dicko A, Morissette M, Ben Ameur S, Pezolet M, Di Paolo T. Effect of estradiol and tamoxifen on brain membranes: investigation by infrared and fluorescence spectroscopy. Brain Res Bull. 1999;49:401–405. doi: 10.1016/s0361-9230(99)00066-0. [DOI] [PubMed] [Google Scholar]
- Fisher-Wellman KH, Gilliam LA, Lin CT, Cathey BL, Lark DS, Darrell Neufer P. Mitochondrial glutathione depletion reveals a novel role for the pyruvate dehydrogenase complex as a key HO-emitting source under conditions of nutrient overload. Free Radic Biol Med. 2013;65C:1201–1208. doi: 10.1016/j.freeradbiomed.2013.09.008. [DOI] [PMC free article] [PubMed] [Google Scholar]
- Fisher-Wellman KH, Neufer PD. Linking mitochondrial bioenergetics to insulin resistance via redox biology. Trends Endocrinol Metab. 2012;23:142–153. doi: 10.1016/j.tem.2011.12.008. [DOI] [PMC free article] [PubMed] [Google Scholar]
- Fisher-Wellman KH, Ryan TE, Smith CD, Gilliam LA, Lin CT, Reese LR, Torres MJ, Neufer PD. A Direct Comparison of Metabolic Responses to High-Fat Diet in C57BL/6J and C57BL/6NJ Mice. Diabetes. 2016;65:3249–3261. doi: 10.2337/db16-0291. [DOI] [PMC free article] [PubMed] [Google Scholar]
- Frasier CR, Brown DA, Sloan RC, Hayes B, Stewart LM, Patel HD, Lust RM, Rosenbaum MD. Stage of the Estrous cycle does not influence myocardial ischemia-reperfusion injury in rats (Rattus norvegicus) Comparative Medicine. 2013;63:416–421. [PMC free article] [PubMed] [Google Scholar]
- Frezza C, Cipolat S, Scorrano L. Organelle isolation: functional mitochondria from mouse liver, muscle and cultured fibroblasts. Nat Protoc. 2007;2:287–295. doi: 10.1038/nprot.2006.478. [DOI] [PubMed] [Google Scholar]
- Fu MH, Maher AC, Hamadeh MJ, Ye C, Tarnopolsky MA. Exercise, sex, menstrual cycle phase, and 17beta-estradiol influence metabolism-related genes in human skeletal muscle. Physiol Genomics. 2009;40:34–47. doi: 10.1152/physiolgenomics.00115.2009. [DOI] [PubMed] [Google Scholar]
- Giustarini D, Dalle-Donne I, Milzani A, Fanti P, Rossi R. Analysis of GSH and GSSG after derivatization with N-ethylmaleimide. Nat Protoc. 2013;8:1660–1669. doi: 10.1038/nprot.2013.095. [DOI] [PubMed] [Google Scholar]
- Gong K, Feng S-S, Go ML, Soew PH. Effects of pH on the stability and compressibility of DPPC/cholesterol monolayers at the air-water interface. Colloids and Surfaces A: Physicochemical and Engineering Aspects. 2002;207:113–125. [Google Scholar]
- Grimm A, Schmitt K, Lang UE, Mensah-Nyagan AG, Eckert A. Improvement of neuronal bioenergetics by neurosteroids: implications for age-related neurodegenerative disorders. Biochim Biophys Acta. 2014;1842:2427–2438. doi: 10.1016/j.bbadis.2014.09.013. [DOI] [PubMed] [Google Scholar]
- Gupte AA, Pownall HJ, Hamilton DJ. Estrogen: an emerging regulator of insulin action and mitochondrial function. J Diabetes Res. 2015;2015:916585. doi: 10.1155/2015/916585. [DOI] [PMC free article] [PubMed] [Google Scholar]
- Harnish DC, Evans MJ, Scicchitano MS, Bhat RA, Karathanasis SK. Estrogen regulation of the apolipoprotein AI gene promoter through transcription cofactor sharing. J Biol Chem. 1998;273:9270–9278. doi: 10.1074/jbc.273.15.9270. [DOI] [PubMed] [Google Scholar]
- Hewitt SC, Kissling GE, Fieselman KE, Jayes FL, Gerrish KE, Korach KS. Biological and biochemical consequences of global deletion of exon 3 from the ER alpha gene. FASEB J. 2010;24:4660–4667. doi: 10.1096/fj.10-163428. [DOI] [PMC free article] [PubMed] [Google Scholar]
- Hoehn KL, Salmon AB, Hohnen-Behrens C, Turner N, Hoy AJ, Maghzal GJ, Stocker R, Van Remmen H, Kraegen EW, Cooney GJ, et al. Insulin resistance is a cellular antioxidant defense mechanism. Proc Natl Acad Sci U S A. 2009;106:17787–17792. doi: 10.1073/pnas.0902380106. [DOI] [PMC free article] [PubMed] [Google Scholar]
- Horvath SE, Daum G. Lipids of mitochondria. Prog Lipid Res. 2013;52:590–614. doi: 10.1016/j.plipres.2013.07.002. [DOI] [PubMed] [Google Scholar]
- Houstis N, Rosen ED, Lander ES. Reactive oxygen species have a causal role in multiple forms of insulin resistance. Nature. 2006;440:944–948. doi: 10.1038/nature04634. [DOI] [PubMed] [Google Scholar]
- Huq S, Kallury K, Campognone M. Optimization of wash/elution conditions for automated solid-Phase Extraction of testosterone from plasma. Phenomenex Applications. 2008;TN-0017:1–4. [Google Scholar]
- Ingberg E, Theodorsson A, Theodorsson E, Strom JO. Methods for long-term 17beta-estradiol administration to mice. Gen Comp Endocrinol. 2012;175:188–193. doi: 10.1016/j.ygcen.2011.11.014. [DOI] [PubMed] [Google Scholar]
- Irwin RW, Yao J, Hamilton RT, Cadenas E, Brinton RD, Nilsen J. Progesterone and estrogen regulate oxidative metabolism in brain mitochondria. Endocrinology. 2008;149:3167–3175. doi: 10.1210/en.2007-1227. [DOI] [PMC free article] [PubMed] [Google Scholar]
- Jackson KC, Wohlers LM, Lovering RM, Schuh RA, Maher AC, Bonen A, Koves TR, Ilkayeva O, Thomson DM, Muoio DM, et al. Ectopic lipid deposition and the metabolic profile of skeletal muscle in ovariectomized mice. Am J Physiol Regul Integr Comp Physiol. 2013;304:R206–217. doi: 10.1152/ajpregu.00428.2012. [DOI] [PMC free article] [PubMed] [Google Scholar]
- Janssen I, Powell LH, Crawford S, Lasley B, Sutton-Tyrrell K. Menopause and the metabolic syndrome: the Study of Women’s Health Across the Nation. Arch Intern Med. 2008;168:1568–1575. doi: 10.1001/archinte.168.14.1568. [DOI] [PMC free article] [PubMed] [Google Scholar]
- Jones ME, Thorburn AW, Britt KL, Hewitt KN, Wreford NG, Proietto J, Oz OK, Leury BJ, Robertson KM, Yao S, et al. Aromatase-deficient (ArKO) mice have a phenotype of increased adiposity. Proc Natl Acad Sci U S A. 2000;97:12735–12740. doi: 10.1073/pnas.97.23.12735. [DOI] [PMC free article] [PubMed] [Google Scholar]
- Kand’ar R, Zakova P, Lotkova H, Kucera O, Cervinkova Z. Determination of reduced and oxidized glutathione in biological samples using liquid chromatography with fluorimetric detection. J Pharm Biomed Anal. 2007;43:1382–1387. doi: 10.1016/j.jpba.2006.11.028. [DOI] [PubMed] [Google Scholar]
- Klinge CM. Estrogens regulate life and death in mitochondria. J Bioenerg Biomembr. 2017 doi: 10.1007/s10863-017-9704-1. [DOI] [PubMed] [Google Scholar]
- Kumar P, Kale RK, Baquer NZ. Estradiol modulates membrane-linked ATPases, antioxidant enzymes, membrane fluidity, lipid peroxidation, and lipofuscin in aged rat liver. J Aging Res. 2011;2011:580245. doi: 10.4061/2011/580245. [DOI] [PMC free article] [PubMed] [Google Scholar]
- Lark DS, Torres MJ, Lin CT, Ryan TE, Anderson EJ, Neufer PD. Direct real-time quantification of mitochondrial oxidative phosphorylation efficiency in permeabilized skeletal muscle myofibers. Am J Physiol Cell Physiol. 2016;311:C239–245. doi: 10.1152/ajpcell.00124.2016. [DOI] [PMC free article] [PubMed] [Google Scholar]
- Lo JC, Zhao X, Scuteri A, Brockwell S, Sowers MR. The association of genetic polymorphisms in sex hormone biosynthesis and action with insulin sensitivity and diabetes mellitus in women at midlife. Am J Med. 2006;119:S69–78. doi: 10.1016/j.amjmed.2006.07.009. [DOI] [PubMed] [Google Scholar]
- Lopez-Grueso R, Gambini J, Abdelaziz KM, Monleon D, Diaz A, El Alami M, Bonet-Costa V, Borras C, Vina J. Early, but not late onset estrogen replacement therapy prevents oxidative stress and metabolic alterations caused by ovariectomy. Antioxid Redox Signal. 2014;20:236–246. doi: 10.1089/ars.2012.5112. [DOI] [PMC free article] [PubMed] [Google Scholar]
- Margolis KL, Bonds DE, Rodabough RJ, Tinker L, Phillips LS, Allen C, Bassford T, Burke G, Torrens J, Howard BV. Effect of oestrogen plus progestin on the incidence of diabetes in postmenopausal women: results from the Women’s Health Initiative Hormone Trial. Diabetologia. 2004;47:1175–1187. doi: 10.1007/s00125-004-1448-x. [DOI] [PubMed] [Google Scholar]
- Mattingly KA, Ivanova MM, Riggs KA, Wickramasinghe NS, Barch MJ, Klinge CM. Estradiol stimulates transcription of nuclear respiratory factor-1 and increases mitochondrial biogenesis. Mol Endocrinol. 2008;22:609–622. doi: 10.1210/me.2007-0029. [DOI] [PMC free article] [PubMed] [Google Scholar]
- Mauvais-Jarvis F, Clegg DJ, Hevener AL. The role of estrogens in control of energy balance and glucose homeostasis. Endocr Rev. 2013;34:309–338. doi: 10.1210/er.2012-1055. [DOI] [PMC free article] [PubMed] [Google Scholar]
- McGuinness OP, Ayala JE, Laughlin MR, Wasserman DH. NIH experiment in centralized mouse phenotyping: the Vanderbilt experience and recommendations for evaluating glucose homeostasis in the mouse. Am J Physiol Endocrinol Metab. 2009;297:E849–855. doi: 10.1152/ajpendo.90996.2008. [DOI] [PMC free article] [PubMed] [Google Scholar]
- Mileykovskaya E, Dowhan W. Cardiolipin-dependent formation of mitochondrial respiratory supercomplexes. Chem Phys Lipids. 2014;179:42–48. doi: 10.1016/j.chemphyslip.2013.10.012. [DOI] [PMC free article] [PubMed] [Google Scholar]
- Moats RK, 2nd, Ramirez VD. Rapid uptake and binding of estradiol-17beta-6-(O-carboxymethyl)oxime:125I–labeled BSA by female rat liver. Biol Reprod. 1998;58:531–538. doi: 10.1095/biolreprod58.2.531. [DOI] [PubMed] [Google Scholar]
- Moats RK, 2nd, Ramirez VD. Electron microscopic visualization of membrane-mediated uptake and translocation of estrogen-BSA:colloidal gold by hep G2 cells. J Endocrinol. 2000;166:631–647. doi: 10.1677/joe.0.1660631. [DOI] [PubMed] [Google Scholar]
- Moreno AJ, Moreira PI, Custodio JB, Santos MS. Mechanism of inhibition of mitochondrial ATP synthase by 17beta-estradiol. J Bioenerg Biomembr. 2013;45:261–270. doi: 10.1007/s10863-012-9497-1. [DOI] [PubMed] [Google Scholar]
- Muoio DM, Noland RC, Kovalik JP, Seiler SE, Davies MN, DeBalsi KL, Ilkayeva OR, Stevens RD, Kheterpal I, Zhang J, et al. Muscle-specific deletion of carnitine acetyltransferase compromises glucose tolerance and metabolic flexibility. Cell Metab. 2012;15:764–777. doi: 10.1016/j.cmet.2012.04.005. [DOI] [PMC free article] [PubMed] [Google Scholar]
- Ohvo-Rekila H, Ramstedt B, Leppimaki P, Slotte JP. Cholesterol interactions with phospholipids in membranes. Prog Lipid Res. 2002;41:66–97. doi: 10.1016/s0163-7827(01)00020-0. [DOI] [PubMed] [Google Scholar]
- Oren I, Fleishman SJ, Kessel A, Ben-Tal N. Free diffusion of steroid hormones across biomembranes: a simplex search with implicit solvent model calculations. Biophys J. 2004;87:768–779. doi: 10.1529/biophysj.103.035527. [DOI] [PMC free article] [PubMed] [Google Scholar]
- Osman C, Voelker DR, Langer T. Making heads or tails of phospholipids in mitochondria. J Cell Biol. 2011;192:7–16. doi: 10.1083/jcb.201006159. [DOI] [PMC free article] [PubMed] [Google Scholar]
- Pennington ER, Fix A, Sullivan EM, Brown DA, Kennedy A, Shaikh SR. Distinct membrane properties are differentially influenced by cardiolipin content and acyl chain composition in biomimetic membranes. Biochim Biophys Acta. 2016;1859:257–267. doi: 10.1016/j.bbamem.2016.11.012. [DOI] [PMC free article] [PubMed] [Google Scholar]
- Prokai L, Prokai-Tatrai K, Perjesi P, Zharikova AD, Perez EJ, Liu R, Simpkins JW. Quinol-based cyclic antioxidant mechanism in estrogen neuroprotection. Proc Natl Acad Sci U S A. 2003;100:11741–11746. doi: 10.1073/pnas.2032621100. [DOI] [PMC free article] [PubMed] [Google Scholar]
- Riant E, Waget A, Cogo H, Arnal JF, Burcelin R, Gourdy P. Estrogens protect against high-fat diet-induced insulin resistance and glucose intolerance in mice. Endocrinology. 2009;150:2109–2117. doi: 10.1210/en.2008-0971. [DOI] [PubMed] [Google Scholar]
- Ribas V, Drew BG, Zhou Z, Phun J, Kalajian NY, Soleymani T, Daraei P, Widjaja K, Wanagat J, de Aguiar Vallim TQ, et al. Skeletal muscle action of estrogen receptor alpha is critical for the maintenance of mitochondrial function and metabolic homeostasis in females. Sci Transl Med. 2016;8:334ra354. doi: 10.1126/scitranslmed.aad3815. [DOI] [PMC free article] [PubMed] [Google Scholar]
- Ribas V, Nguyen MT, Henstridge DC, Nguyen AK, Beaven SW, Watt MJ, Hevener AL. Impaired oxidative metabolism and inflammation are associated with insulin resistance in ERalpha-deficient mice. Am J Physiol Endocrinol Metab. 2010;298:E304–319. doi: 10.1152/ajpendo.00504.2009. [DOI] [PMC free article] [PubMed] [Google Scholar]
- Rindler PM, Crewe CL, Fernandes J, Kinter M, Szweda LI. Redox regulation of insulin sensitivity due to enhanced fatty acid utilization in the mitochondria. American Journal of Physiology - Heart and Circulatory Physiology. 2013;305:H634–H643. doi: 10.1152/ajpheart.00799.2012. [DOI] [PubMed] [Google Scholar]
- Rogers NH, Perfield JW, 2nd, Strissel KJ, Obin MS, Greenberg AS. Reduced energy expenditure and increased inflammation are early events in the development of ovariectomy-induced obesity. Endocrinology. 2009;150:2161–2168. doi: 10.1210/en.2008-1405. [DOI] [PMC free article] [PubMed] [Google Scholar]
- Salpeter SR, Walsh JM, Ormiston TM, Greyber E, Buckley NS, Salpeter EE. Meta-analysis: effect of hormone-replacement therapy on components of the metabolic syndrome in postmenopausal women. Diabetes Obes Metab. 2006;8:538–554. doi: 10.1111/j.1463-1326.2005.00545.x. [DOI] [PubMed] [Google Scholar]
- Sanchez MI, Shearwood AM, Chia T, Davies SM, Rackham O, Filipovska A. Estrogen-mediated regulation of mitochondrial gene expression. Mol Endocrinol. 2015;29:14–27. doi: 10.1210/me.2014-1077. [DOI] [PMC free article] [PubMed] [Google Scholar]
- Schafer FQ, Buettner GR. Redox environment of the cell as viewed through the redox state of the glutathione disulfide/glutathione couple. Free Radic Biol Med. 2001;30:1191–1212. doi: 10.1016/s0891-5849(01)00480-4. [DOI] [PubMed] [Google Scholar]
- Scheidt HA, Badeau RM, Huster D. Investigating the membrane orientation and transversal distribution of 17beta-estradiol in lipid membranes by solid-state NMR. Chem Phys Lipids. 2010;163:356–361. doi: 10.1016/j.chemphyslip.2010.02.001. [DOI] [PubMed] [Google Scholar]
- Shaikh SR, Dumaual AC, Jenski LJ, Stillwell W. Lipid phase separation in phospholipid bilayers and monolayers modeling the plasma membrane. Biochim Biophys Acta. 2001;1512:317–328. doi: 10.1016/s0005-2736(01)00335-2. [DOI] [PubMed] [Google Scholar]
- Shaikh SR, Locascio DS, Soni SP, Wassall SR, Stillwell W. Oleic- and docosahexaenoic acid-containing phosphatidylethanolamines differentially phase separate from sphingomyelin. Biochim Biophys Acta. 2009;1788:2421–2426. doi: 10.1016/j.bbamem.2009.08.019. [DOI] [PMC free article] [PubMed] [Google Scholar]
- Shaikh SR, Sullivan EM, Alleman RJ, Brown DA, Zeczycki TN. Increasing mitochondrial membrane phospholipid content lowers the enzymatic activity of electron transport complexes. Biochemistry. 2014;53:5589–5591. doi: 10.1021/bi500868g. [DOI] [PubMed] [Google Scholar]
- Shi C, Wu F, Xu J. Incorporation of beta-sitosterol into mitochondrial membrane enhances mitochondrial function by promoting inner mitochondrial membrane fluidity. J Bioenerg Biomembr. 2013;45:301–305. doi: 10.1007/s10863-012-9495-3. [DOI] [PubMed] [Google Scholar]
- Solans R, Motta C, Sola R, La Ville AE, Lima J, Simeon P, Montella N, Armadans-Gil L, Fonollosa V, Vilardell M. Abnormalities of erythrocyte membrane fluidity, lipid composition, and lipid peroxidation in systemic sclerosis: evidence of free radical-mediated injury. Arthritis Rheum. 2000;43:894–900. doi: 10.1002/1529-0131(200004)43:4<894::AID-ANR22>3.0.CO;2-4. [DOI] [PubMed] [Google Scholar]
- Stillwell W, Wassall SR, Dumaual AC, Ehringer WD, Browning CW, Jenski LJ. Use of merocyanine (MC540) in quantifying lipid domains and packing in phospholipid vesicles and tumor cells. Biochim Biophys Acta. 1993;1146:136–144. doi: 10.1016/0005-2736(93)90348-4. [DOI] [PubMed] [Google Scholar]
- Taylor ER, Hurrell F, Shannon RJ, Lin TK, Hirst J, Murphy MP. Reversible glutathionylation of complex I increases mitochondrial superoxide formation. J Biol Chem. 2003;278:19603–19610. doi: 10.1074/jbc.M209359200. [DOI] [PubMed] [Google Scholar]
- Tsuda K, Kinoshita-Shimamoto Y, Mabuchi Y, Nishio I. Hormone replacement therapy improves membrane fluidity of erythrocytes in postmenopausal women: an electron paramagnetic resonance investigation. Am J Hypertens. 2003;16:502–507. doi: 10.1016/s0895-7061(03)00841-0. [DOI] [PubMed] [Google Scholar]
- Valentine RC, Valentine DL. Omega-3 fatty acids in cellular membranes: a unified concept. Prog Lipid Res. 2004;43:383–402. doi: 10.1016/j.plipres.2004.05.004. [DOI] [PubMed] [Google Scholar]
- Wang J, Green PS, Simpkins JW. Estradiol protects against ATP depletion, mitochondrial membrane potential decline and the generation of reactive oxygen species induced by 3-nitroproprionic acid in SK-N-SH human neuroblastoma cells. J Neurochem. 2001;77:804–811. doi: 10.1046/j.1471-4159.2001.00271.x. [DOI] [PubMed] [Google Scholar]
- Wei X, Orlowicz S, Parnell K. Increased capabilities for the analysis of hormones in drinking and waste water using solid phase extraction and LC/MS/MS. Phenomenex Applications. 2016;TN-1184:1–8. [Google Scholar]
- Wenz JJ. Predicting the effect of steroids on membrane biophysical properties based on the molecular structure. Biochim Biophys Acta. 2012;1818:896–906. doi: 10.1016/j.bbamem.2011.12.021. [DOI] [PubMed] [Google Scholar]
- Wenz T, Hielscher R, Hellwig P, Schagger H, Richers S, Hunte C. Role of phospholipids in respiratory cytochrome bc(1) complex catalysis and supercomplex formation. Biochim Biophys Acta. 2009;1787:609–616. doi: 10.1016/j.bbabio.2009.02.012. [DOI] [PubMed] [Google Scholar]
- Whiting KP, Restall CJ, Brain PF. Steroid hormone-induced effects on membrane fluidity and their potential roles in non-genomic mechanisms. Life Sci. 2000;67:743–757. doi: 10.1016/s0024-3205(00)00669-x. [DOI] [PubMed] [Google Scholar]
- Wood GA, Fata JE, Watson KL, Khokha R. Circulating hormones and estrous stage predict cellular and stromal remodeling in murine uterus. Reproduction. 2007;133:1035–1044. doi: 10.1530/REP-06-0302. [DOI] [PubMed] [Google Scholar]
- Yao X, Wigginton JG, Maass DL, Ma L, Carlson D, Wolf SE, Minei JP, Zang QS. Estrogen-provided cardiac protection following burn trauma is mediated through a reduction in mitochondria-derived DAMPs. American Journal of Physiology - Heart and Circulatory Physiology. 2014;306:H882–H894. doi: 10.1152/ajpheart.00475.2013. [DOI] [PubMed] [Google Scholar]
- Yu W, Gong JS, Ko M, Garver WS, Yanagisawa K, Michikawa M. Altered cholesterol metabolism in Niemann-Pick type C1 mouse brains affects mitochondrial function. J Biol Chem. 2005;280:11731–11739. doi: 10.1074/jbc.M412898200. [DOI] [PubMed] [Google Scholar]
- Zeczycki TN, Whelan J, Hayden WT, Brown DA, Shaikh SR. Increasing levels of cardiolipin differentially influence packing of phospholipids found in the mitochondrial inner membrane. Biochem Biophys Res Commun. 2014;450:366–371. doi: 10.1016/j.bbrc.2014.05.133. [DOI] [PubMed] [Google Scholar]
Associated Data
This section collects any data citations, data availability statements, or supplementary materials included in this article.