

Abstract
Objective
To elucidate the genetic architecture of gene expression in pancreatic tissues.
Design
We performed expression quantitative trait locus (eQTL) analysis in histologically normal pancreatic tissue samples (n=95) using RNA-sequencing and the corresponding 1000 Genomes imputed germline genotypes. Data from pancreatic tumor-derived tissue samples (n=115) from The Cancer Genome Atlas (TCGA) was included for comparison.
Results
We identified 38,615 cis-eQTLs (in 484 genes) in histologically normal tissues and 39,713 cis-eQTL (in 237 genes) in tumor-derived tissues (FDR<0.1), with the strongest effects seen near transcriptional start sites (TSS). Approximately 23% and 42% of genes with significant cis-eQTLs appeared to be specific for tumor and normal derived tissues, respectively. Significant enrichment of cis-eQTL variants was noted in noncoding regulatory regions, in particular for pancreatic tissues (1.53–3.12 fold, P≤0.0001), indicating tissue-specific functional relevance. A common pancreatic cancer risk locus on 9q34.2 (rs687289) was associated with ABO expression in histologically normal (P=5.8×10⁻⁸) and tumor-derived (P=8.3×10⁻⁵) tissues. The high linkage disequilibrium (LD) between this variant and the O blood group generating deletion variant in ABO (exon 6) suggested that nonsense-mediated decay (NMD) of the “O” mRNA might explain this finding. However, knockdown of crucial NMD regulators did not influence decay of the ABO “O” mRNA, indicating that a gene regulatory element influenced by pancreatic cancer risk alleles may underlie the eQTL.
Conclusions
We have identified cis-eQTLs representing potential functional regulatory variants in the pancreas and generated a rich dataset for further studies on gene expression and its regulation in pancreatic tissues.
Keywords: gene expression, eQTL, pancreas, RNA-seq, allele specific expression
INTRODUCTION
Pancreatic cancer is currently the third leading cause of cancer-related deaths in the United States[1]. The majority of patients present with advanced disease at time of diagnosis resulting in a 5-year survival rate of 7%[2]. In contrast to most other cancers, mortality rates for pancreatic cancer are not improving in the United States or in Europe. In the U.S., it is predicted to become the second leading cause of cancer related deaths by 2030[3, 4].
Most of the human genome consists of DNA that does not encode proteins. This DNA is, however, rich in functional elements that influence higher order chromatin structure and gene expression in tissue and disease specific settings. Cataloging these elements across multiple tissues has been spearheaded by the ENCyclopedia Of DNA Elements (ENCODE) and National Institutes of Health (NIH) Roadmap Epigenomics Mapping Consortia using epigenetic approaches that investigate patterns of modified histones, transcription factors, open chromatin and DNA methylation that mark genomic regions in an active or repressed conformation[5, 6]. An important question in human genetics is to what degree germline variation influences these functional elements and the relevance of such regulation to complex traits and diseases. Addressing this question benefits greatly from advances in genotyping and massively parallel sequencing techniques, that are increasingly being used to assess quantitative trait loci (QTL) across the whole genome for gene expression, splicing, DNase hypersensitivity and chromatin interactions[7, 8, 9, 10, 11, 12, 13, 14].
Although expression quantitative trait locus (eQTL) analyses on a genome wide scale using RNA-sequencing in lymphoblastoid cell lines were first published several years ago [15, 16], the Genotype-Tissue Expression (GTEx) consortium has recently expanded this work greatly by generating publicly available data for eQTL analysis in 43 human tissues[9]. A high degree of eQTL sharing has been described across tissues and individuals[9, 17, 18]. However, to our knowledge, only one study has systematically compared eQTLs in normal and tumor-derived tissues, using 90 tissues from normal and tumor derived colon tissues[19].
To create a rich expression dataset for pancreatic tissues and establish a link between germline genetic variants and gene expression in the pancreas, we undertook an eQTL study in histologically normal and tumor-derived pancreatic tissue samples. We investigated the impact of genetic variants on gene expression across the whole genome in pancreatic tissues and assessed enrichment of eQTL variants in functional elements defined by us and others [5, 20]. Furthermore, to begin interrogating the influence of common inherited pancreatic cancer risk variants on gene expression, we evaluated eQTLs for published pancreatic cancer risk alleles identified by genome wide association studies (GWAS) in populations of European ancestry[21, 22, 23, 24].
RESULTS
Identification of eQTLs in histologically normal and tumor-derived pancreatic tissues
We sequenced the transcriptome of fresh frozen, histologically normal, pancreatic tissue samples from individuals of European ancestry. Matched DNA samples (from blood or histologically normal tissue samples) were scanned on SNP arrays followed by imputation using the 1000 Genomes reference panel (Phase 1, version 3). After quality control, 95 histologically normal samples (79 were adjacent to pancreatic tumors and 16 from non-cancerous organ donors at time of death) with high quality mRNA-seq and genotype data (Laboratory of Translational Genomics, LTG, sample set) were included in the eQTL analysis (see Supplementary Methods). The same analysis was performed for tumor-derived pancreatic tissue samples (pancreatic ductal adenocarcinoma, PDAC) using The Cancer Genome Atlas (TCGA) mRNA-seq and genotype data from matched blood derived DNA samples; 115 pancreatic ductal adenocarcinoma samples (TCGA PAAD dataset) were included after quality control. The tumor percentage in these samples ranged from 5–73% (average 31%). Procedures for RNA-seq alignment, data processing and analysis are summarized in Figure 1 and detailed in Supplementary Figure 1.
Figure 1. Pancreatic tissue expression Quantitative Trait Locus (eQTL) workflow.
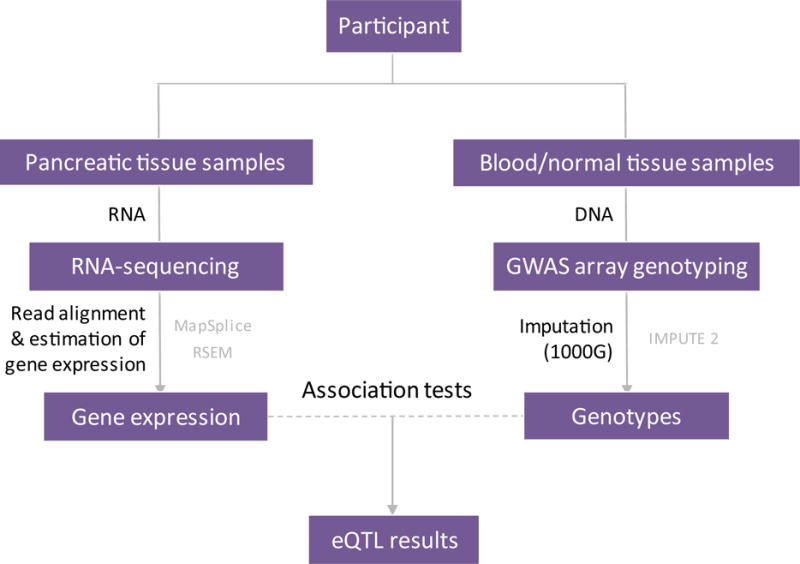
This schematic figure describes a simplified analysis workflow (detailed workflow and quality thresholds is depicted in Supplementary Figure 1). Participants included 95 subjects that donated histologically normal pancreatic tissue samples (LTG sample set) and 115 subjects that donated pancreatic tumors (TCGA PAAD sample set) for the analysis. RNA was isolated from fresh frozen pancreatic tissue samples and DNA from matched blood or normal derived tissue samples. RNA-sequence read alignment was performed using the MapSplice software package and gene expression estimation with RSEM. DNA samples were genotyped on genotyping arrays (GWAS array genotyping) and imputation performed using the 1000 Genomes (1000G) imputation reference dataset and the IMPUTE2 program.
We first assessed regulation of gene expression in cis (within +/− 1Mb from the transcriptional start site, TSS, for each tested gene) and identified 38,615 cis-eQTLs for the histologically normal tissue samples and 39,713 cis-eQTLs for the tumor-derived samples (Table 1) at a false discovery rate (FDR) <0.1. This threshold corresponded to nominal P values <3.0×10⁻⁶ and <1.5×10⁻⁶ for normal and tumor-derived samples, respectively. Approximately half of the eQTLs (n=17,707) were shared between histologically normal and tumor-derived tissues at this threshold.
Table 1.
Cis-eQTLs and eGenes identified in histologically normal (LTG) and tumor-derived (TCGA/PAAD) pancreatic tissue samples.
| Normal (n=95) |
Tumor (n=115) |
|||
|---|---|---|---|---|
| eQTLs | eGenes | eQTLs | eGenes | |
| Cis-eQTLs at FDR<0.1 | 38,615 | 484 | 39,713 | 237 |
| Cross-replicated at P<0.05* | 30,621 | 270 | 34,396 | 169 |
| Cross-replicated at FDR<0.1** | 17,707 | 107*** | 17,707 | 107*** |
Cis-eQTLs from analysis in histologically normal derived tissue samples (FDR<0.01) that replicated in tumor derived tissue samples with same direction at P<0.05, and vice versa.
Cis-eQTLs found in both histologically normal and tumor derived tissue samples, in the same direction (FDR<0.1).
eGenes that were shared in normal and tumor derived samples
For each gene with significant eQTL(s), the variant with the smallest P-value (Pmin) was used to represent the cis-eQTL for that gene (eGene; defined as a single SNP-gene pair). This resulted in 484 and 237 cis-eQTL genes (eGenes) in histologically normal and tumor-derived tissues, respectively (Table 2, Supplementary Tables 1 and 2). A total of 107 eGenes were noted in both histologically normal and tumor-derived samples (FDR<0.1) and therefore considered shared eGenes (Supplementary Table 3). At nominal significance (P<0.05), 58% of eGenes (270 out of 464 eGenes tested in both sets) observed in the histologically normal samples replicated in the tumor set and 76% of eGenes (169 out of 222 eGenes tested in both sets) seen in the tumor set replicated in the histologically normal set. One eGene each in the normal and tumor sets, showed an effect in the opposite direction in the other set (at P<0.05): ALOX5 (arachidonate 5-lipoxygenase; rs11239465: βTumor = −0.71, P=6.8×10⁻⁷; βNormal =0.52, P=3.8×10⁻⁴ ; Figure 2A) and MYADML2 (myeloid-associated differentiation marker-like 2; rs7503637 βNormal= −0.77, P=1.6×10⁻⁶; βTumor=0.55, P=0.0017). The remaining eGenes were defined as being specific for the histologically normal (n=193, 42%) or tumor-derived (n=52, 23%) tissues, respectively. Shared eGenes had similar effect sizes in the two sample sets (r2=0.90–0.95) indicating strong preservation of the direction of effect in tumors. In comparison, eGenes specific to one group were not as highly correlated (r2=0.25 for normal specific eGenes, and r2=0.18 for tumor specific eGenes; Figure 2B). P value distributions for eGenes observed in histologically normal samples tested in tumor tissues (Figure 2C and Supplementary Figure 2 left panels), and vice versa (Figure 2C and Supplementary Figure 2, right panels), also indicated a high degree of sharing between the two sets of tissues. We also performed the eQTL analysis in tumor samples with additional adjustments for local copy number variations (CNV) and DNA methylation and noted similar results (39,713 cis-eQTLs and 271 eGenes at P<1.5×10⁻⁵, Supplementary Methods and Supplementary Table 4)
Table 2. The most significant cis-eQTLs identified in histologically normal pancreatic tissue samples (LTG) and pancreatic tumor derived tissue samples (TCGA/PAAD).
The top 20 most significant cis-eQTLs identified in histologically normal pancreatic tissue samples (LTG) are shown in the top half of the table, with replication in in histologically normal pancreatic tissue samples (GTEx data) and in pancreatic tumor derived tissue samples (TCGA/PAAD). The top 20 most significant cis-eQTLs identified in pancreatic tumor derived tissue samples (TCGA/PAAD) are shown in the bottom half of the table with replication in histologically normal pancreatic tissue samples (GTEx and LTG samples).
| Top 20 cis-eQTLs identified in histologically normal pancreatic tissue samples (LTG)
| ||||||||||
|---|---|---|---|---|---|---|---|---|---|---|
| Gene | SNP | Alleles (reference/effect) |
Chr | Location** | LTG (n=95) |
GTEx (n=149)* |
TCGA/PAAD (n=115) |
|||
| Beta (β) |
P-value | Beta (β) |
P-value | Beta (β) |
P-value | |||||
| DDX11 | rs1974752 | C/T | 12 | 31,258,728 | −0.97 | 8.50E-27 | −1.25 | 6.25E-48 | −0.83 | 8.02E-11 |
| RPL9 | rs2125313 | A/G | 4 | 39,458,051 | −1.32 | 9.64E-27 | −1.26 | 1.55E-53 | −1.05 | 4.88E-20 |
| ERAP2 | rs2432142 | G/A | 5 | 96,275,201 | 1.02 | 2.82E-26 | 1.15 | 9.69E-43 | 1.14 | 4.48E-22 |
| GBP3 | rs10922533 | C/G | 1 | 89,456,659 | −0.99 | 1.30E-23 | −1.09 | 1.69E-29 | −1.09 | 4.01E-27 |
| EFCAB2 | rs61844237 | G/C | 1 | 245,133,662 | −1.04 | 1.26E-22 | −1.09 | 9.33E-34 | −0.90 | 6.07E-13 |
| ART3 | rs12510335 | G/A | 4 | 76,980,539 | −1.13 | 3.31E-22 | −1.07 | 1.39E-41 | −0.41 | 1.93E-03 |
| GSTT2 | rs5742303 | C/T | 22 | 24,299,147 | −0.97 | 1.06E-21 | −1.04 | 8.82E-21 | −1.05 | 1.50E-21 |
| ST7L | rs6666579 | A/G | 1 | 113,132,393 | 1.06 | 1.40E-21 | 0.62 | 3.83E-14 | 0.50 | 5.05E-05 |
| C2orf74 | rs1665258 | G/A | 2 | 61,385,100 | 1.00 | 2.13E-21 | NA | NA | 1.07 | 5.38E-22 |
| FN3KRP | rs2246577 | T/C | 17 | 80,680,394 | 1.16 | 2.29E-21 | 0.92 | 7.20E-25 | 0.87 | 4.84E-09 |
| LOC642846 | rs10743636 | T/C | 12 | 9,434,060 | −0.96 | 2.40E-21 | NA | NA | −0.58 | 5.54E-07 |
| RFWD3 | rs4888266 | C/T | 16 | 74,687,804 | −1.04 | 2.44E-21 | −1.13 | 4.86E-41 | −0.43 | 1.72E-03 |
| LOC253039 | rs12684934 | C/T | 9 | 123,593,159 | −1.04 | 3.37E-21 | NA | NA | −0.81 | 1.55E-14 |
| XRRA1 | rs4944965 | G/A | 11 | 74,698,676 | 1.17 | 8.08E-21 | 1.28 | 2.94E-43 | 1.00 | 3.27E-18 |
| LQK1 | rs7528505 | A/G | 1 | 213,051,521 | 1.08 | 1.39E-20 | NA | NA | 1.09 | 3.17E-30 |
| ERAP1 | rs27527 | C/A | 5 | 96,151,968 | −1.05 | 3.41E-20 | −0.70 | 3.05E-17 | −0.36 | 1.26E-02 |
| ZNF880 | rs1993531 | T/A | 19 | 52,884,886 | 0.95 | 9.04E-20 | 0.59 | 3.01E-09 | 0.79 | 1.34E-11 |
| C9orf130 | rs67383717 | C/A | 9 | 98,626,548 | 1.08 | 1.16E-19 | NA | NA | 0.80 | 1.65E-11 |
| C17orf97 | rs11150882 | G/A | 17 | 259,648 | 1.28 | 8.70E-19 | 1.28 | 6.61E-44 | 1.19 | 7.22E-11 |
| TYW1B | rs7806991 | G/A | 7 | 72,200,923 | 1.26 | 9.68E-19 | 1.56 | 8.11E-31 | 1.24 | 1.76E-22 |
|
| ||||||||||
| Top 20 cis-eQTLs identified in pancreatic tumor derived tissue samples (TCGA/PAAD)
| ||||||||||
| Gene | SNP | Alleles (reference/effect) |
Chr | Location** | TCGA/PAAD (n=115) |
GTEx (n=149)* |
LTG (n=95) |
|||
| Beta (β) |
P-value | Beta (β) |
P-value | Beta (β) |
P-value | |||||
|
| ||||||||||
| LQK1 | rs10779593 | A/G | 1 | 213,053,179 | 1.10 | 1.56E-30 | NA | NA | 1.08 | 2.77E-20 |
| GBP3 | rs10493821 | C/T | 1 | 89,475,135 | −1.08 | 1.72E-27 | −1.08 | 9.73E-29 | −0.98 | 1.68E-23 |
| PPIL3 | rs2136600 | C/T | 2 | 201,742,345 | −1.22 | 1.91E-25 | −1.17 | 4.30E-36 | −1.15 | 1.07E-13 |
| RPS28 | rs1057232 | G/A | 19 | 8,387,207 | −1.11 | 1.55E-23 | −1.37 | 8.38E-50 | −0.97 | 1.50E-12 |
| TYW1B | rs56412572 | T/C | 7 | 72,239,964 | 1.25 | 3.31E-23 | 1.52 | 7.59E-32 | 1.25 | 1.69E-18 |
| ERAP2 | rs2910686 | T/C | 5 | 96,252,589 | 1.14 | 8.86E-23 | 1.15 | 9.01E-48 | 0.98 | 5.07E-26 |
| GSTT2 | rs5751776 | A/C | 22 | 24,266,954 | −1.06 | 1.80E-22 | NA | NA | −0.96 | 4.52E-20 |
| C2orf74 | rs12999245 | G/T | 2 | 61,393,890 | 1.08 | 4.77E-22 | NA | NA | 1.00 | 2.44E-21 |
| DDX11L2 | rs145623386 | CCA/C | 2 | 114,425,697 | 1.18 | 2.03E-20 | 0.75 | 1.04E-10 | 0.80 | 1.80E-07 |
| RPL9 | rs2608824 | A/G | 4 | 39,447,779 | −1.06 | 4.01E-20 | −1.23 | 5.93E-49 | −1.32 | 1.44E-26 |
| XRRA1 | rs10899052 | T/C | 11 | 74,646,213 | 1.00 | 9.93E-20 | 1.28 | 2.17E-49 | 1.15 | 1.26E-20 |
| HLA-DRB5 | rs9270601 | G/C | 6 | 32,561,743 | −1.43 | 3.81E-19 | −1.43 | 3.01E-28 | −1.05 | 2.15E-17 |
| GLIPR1L2 | rs111393259 | G/A | 12 | 75,803,574 | −0.96 | 1.33E-18 | −0.97 | 3.73E-22 | −0.81 | 3.65E-10 |
| LOC644172 | rs112535292 | G/T | 17 | 44,344,300 | 1.10 | 1.81E-17 | NA | NA | 0.57 | 4.29E-04 |
| POMZP3 | rs11772694 | G/A | 7 | 76,195,020 | 0.93 | 6.45E-17 | 1.05 | 7.22E-16 | 1.13 | 3.04E-17 |
| HLA-DQB1 | rs17612852 | G/A | 6 | 32,620,572 | −1.13 | 9.28E-17 | −1.33 | 1.86E-28 | −0.51 | 2.42E-08 |
| CYP4F11 | rs12985091 | G/A | 19 | 16,045,749 | −0.90 | 1.32E-16 | −1.20 | 2.87E-43 | −0.93 | 1.00E-11 |
| RPS26 | rs11171739 | C/T | 12 | 56,470,625 | −0.90 | 1.51E-16 | −0.28 | 2.46E-03 | −0.85 | 8.80E-14 |
| ULK4 | rs75108967 | C/A | 3 | 41,869,230 | 1.26 | 3.22E-16 | 0.68 | 4.20E-07 | 0.55 | 6.52E-03 |
| SNHG5 | rs9450287 | A/G | 6 | 86,211,984 | 1.03 | 5.47E-16 | 0.62 | 2.40E-14 | 0.85 | 1.90E-09 |
NA indicates SNP-gene pairs not tested in the replication sets. Beta (β) is the eQTL effect size. The complete lists of significant cis-eQTLs observed in histologically normal pancreatic tissue samples (LTG) and pancreatic tumor-derived tissue samples (TCGA/PAAD) are shown in Supplementary Tables 1 and 2. The LD (r2) for the different eQTL variants representing the same gene in the normal and tumor analyses are shown in Supplementary Table 3.
Genomic location is based on hg19 (Human Genome version 19).
Figure 2. Cis-eQTL genes (eGenes) in pancreatic tissues.
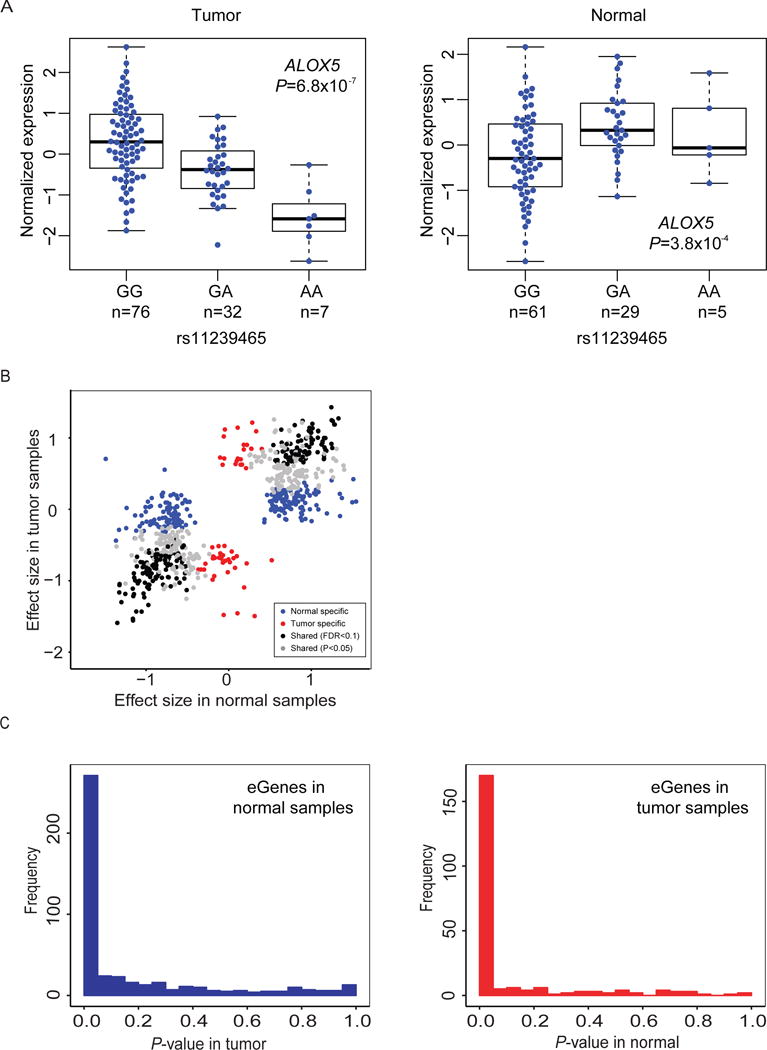
(A) Expression QTLs for ALOX5 in tumor-derived (Tumor, TCGA/PAAD sample set, left) and histologically normal (Normal, LTG sample set, right) sample groups. Normalized mRNA gene expression is shown according to genotypes of rs11239465. (B) Correlation of effect sizes for eGenes observed in histologically normal (LTG) and tumor-derived (TCGA) pancreatic tissue samples. Black dots indicate shared eGenes (FDR<0.1 in both sample sets, r2=0.95) and grey dots indicate eGenes with FDR<0.1 in one sample set and with nominal significance (P<0.05) in the other (r2=0.90). Blue and red dots indicate tissue specific eGenes in histologically normal and tumor-derived samples, respectively (FDR<0.1 in one set and P>0.05 in the other set). (C) P-value distributions for eGenes detected in histologically normal samples in tumor derived samples (left panel) and vice versa (right panel). Figure 2C is also shown on a log scale in Supplementary Figure 2.
We attempted to replicate our findings in the publicly available Genotype Tissue Expression (GTEx) project eQTL dataset[9] generated with 149 histologically normal postmortem pancreatic tissue samples (http://www.gtexportal.org/). A higher number of eGenes was detected in this dataset, likely due to differences in sample size as well as a considerably larger number of cis-eQTLs tested (LTG: 72 million, TCGA: 75 million, GTEx: 150–170 million [9], see Methods). Despite this difference, the majority of eGenes observed in the LTG and TCGA/PAAD samples replicated in GTEx. After excluding SNP-gene pairs not reported in GTEx, 82% of eGenes (323 out of 394 eGenes that were tested in both sets) observed in the histologically normal LTG samples and 79% of eGenes (146 out of 185 eGenes tested in both sets; 78.9%) observed in the tumor-derived TCGA samples replicated in GTEx at P<0.05 (Supplementary Tables 1 and 2). All shared eGenes replicated in GTEx (90 out of 107 shared eGenes were tested in GTEx). High correlation was noted between effect sizes in our set and GTEx (r2=0.90 for eGenes in the histologically normal samples and r2=0.89 in pancreatic tumor tissues). Of the 2,243 overlapping eGenes in GTEx (at the GTEx defined FDR≤0.05), 51% (n=1,154) replicated in the histologically normal pancreatic samples at P<0.05 (effect size correlation r2=0.91). The replication rate was lower in tumor samples, where 28% (n=608) out of 2,201 GTEx eGenes replicated with marginal significance (effect size correlation r2=0.87).
Examples of eGenes that were highly specific to histologically normal pancreatic samples (LTG set and GTEx) include PPIL1 (peptidylprolyl isomerase like 1; rs6909988: PLTG=1.8×10⁻¹⁸, β= −1.01; PGTEx=1.0×10−42, β= −1.01; PTCGA=0.82, β=0.03), CDCA7 (cell division cycle associated 7; rs6712331: PLTG=1.9×10⁻¹¹, β=1.06; PGTEx =7.3×10⁻²⁶, β=1.25; PTCGA=0.71, β=0.06) and DSCC1 (DNA replication and sister chromatid cohesion 1; rs76414504: PLTG =3.5×10⁻⁹, β= −0.94;PGTEx =5.8×10⁻²¹, β= −1.02; PTCGA=0.83, β=0.04) (Supplementary Table 1). Likewise, eGenes highly specific for pancreatic tumor derived samples included two zinc finger containing transcription factors ZNF777 (zinc finger protein 777; PTCGA=1.4×10⁻⁸, β= −1.49; PLTG=0.17, β=0.31; PGTEx=0.13, β=0.24) and ZNF746 (zinc finger protein 746; PTCGA =8.1×10⁻⁸, β= −1.46; PLTG=0.66, β=0.11; PGTEx=0.99, β=0) (Supplementary Table 2).
We next assessed pair-wise sharing of cis-eQTLs identified in pancreatic tissues in our study with those identified across multiple tissue types by GTEx. The highest degree of eQTL sharing for the histologically normal LTG samples was observed for the GTEx pancreatic samples (π1=0.99), and the lowest for brain (π1=0.78). On the other hand, eQTL sharing for TCGA/PAAD samples was lower when compared to GTEx pancreas (π1=0.92) and highest for esophagus, heart, thyroid, muscle and artery (π1=0.97–0.99), thus possibly reflecting the low tumor cellularity and increased tissue heterogeneity in the tumor samples (Supplementary Table 5). A high degree of sharing was noted for the eQTLs with a pancreatic endocrine eQTL dataset generated with 118 islets [25], in particular for the histologically normal samples (LTG: π1=0.94; TCGA/PAAD: π1=0.75) (Supplementary Table 6).
Enrichment of eQTLs in putative functional regions
We next examined the distribution of cis-eQTL variants identified in this study (LTG and TCGA sample sets) with regard to specific genomic features and enrichment in regions bound by transcription factors (TF), presence of modified histones, or DNA sites marked by DNase hypersensitivity (DHS) using ENCODE data [5]. Cis-eQTLs observed in normal and tumor-derived tissues were enriched in promoters (0–3kb upstream of TSS, ~4–5 fold), 5’ untranslated regions (5’ UTR; ~10–21 fold), exons (~3–6 fold) and 3’ UTR (~3–4 fold), and depleted in distal intergenic regions (Figure 3A). We found stronger eQTL effects closer to transcriptional start sites (TSS) (median -log10 P-value = 18.1 and median absolute effect size = 0.81 for eQTLs within 50 kb from TSS) as compared to those located farther away (median -log10 P-value = 15.0 and median absolute effect size = 0.77 for eQTLs over 50 kb from TSS) (Figure 3B). In particular, shared cis-eQTLs had stronger effects (median -log10 P-value 23.8 vs. 15.7; median absolute effect size 0.90 vs. 0.76) and tended to be located closer to TSSs (average distance 32kb vs. 110kb) than tumor and normal tissue specific eQTLs (Figure 3B).
Figure 3. Characteristics of cis-eQTLs.
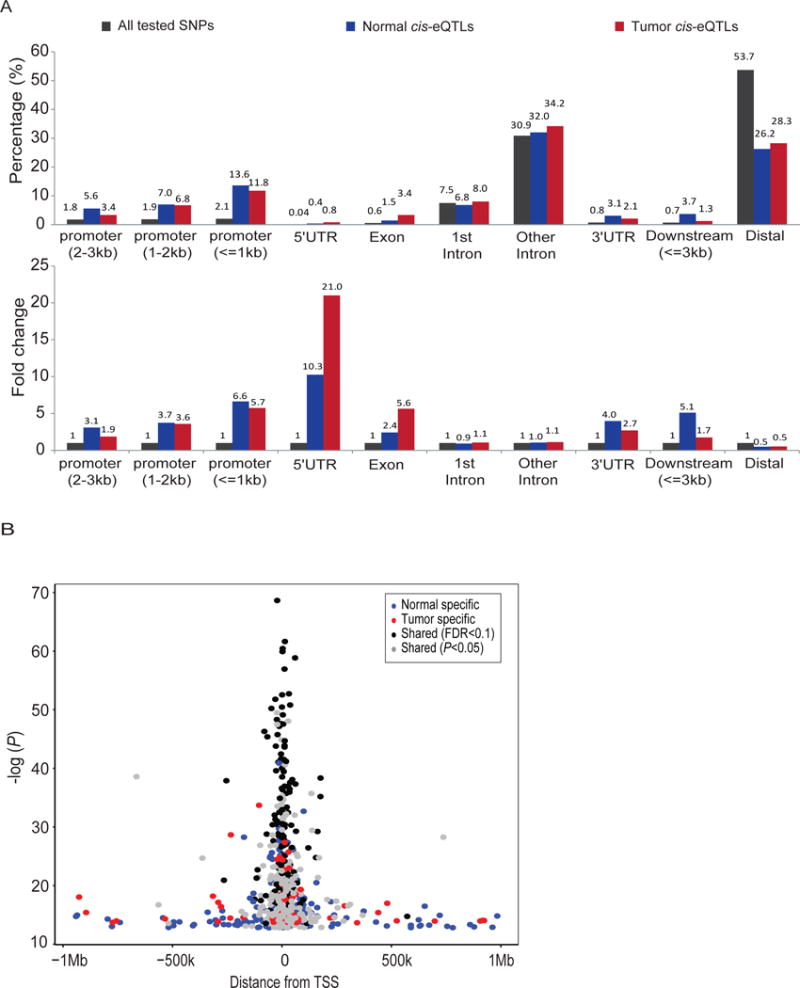
(A) Distribution of eQTLs in promoters, UTRs, exons, introns and nongenic regions as compared to all tested variants. Cis-eQTLs are shown for histologically normal (blue, LTG sample set) and tumor-derived (red, TCGA sample set) samples and compared to all tested variants (black). The upper panel shows percentages of eQTLs in each category and the lower panel shows fold change as compared to all tested SNPs for each region. The distance for the three promoter classes (<=1 kb, 1–2 kb and 2–3 kb) refers to the TSS. (B) Distance of eQTLs (Pmin variants per gene) to transcriptional start sites (TSS) and the significance of each eQTL association. Black and grey dots indicate shared eGenes with FDR<0.1 and P<0.05, respectively, whereas blue and red dots indicate eGenes that were not shared at nominal significance (P<0.05) in histologically normal and tumor-derived samples, respectively.
Based on available ChIP-seq and DNase-seq datasets from ENCODE[5], we observed significant enrichment of cis-eQTLs in DHS and genomic regions bound by modified histones that mark active chromatin, RNA Polymerase II and transcription factors in the pancreatic cancer cell line PANC-1 (Table 3A). This enrichment replicated in ChIP-seq datasets generated by our laboratory for H3K4me1 and H3K4me3 in tumor (PANC-1) and normal-derived (hTERT-HPNE) pancreatic cell lines[20] with similar magnitudes (Table 3B). Among three TFs with ChIP-seq data available for PANC-1 cells in ENCODE, the greatest enrichment for cis-eQTLs was observed for paired amphipathic helix protein Sin3a (SIN3A), a transcriptional regulator and epigenetic modifier most frequently associated with gene silencing[26]. Likewise, we observed prominent enrichment for cis-eQTLs in regions bound by transcription factor 7-like 2 (TCF7L2), a key transcription factor of the canonical Wnt signaling pathway[27]. Enrichment of eQTLs in regions bound by the three TFs combined (SIN3A, TCF7L2 and NRSF/REST) in PANC-1 cells (1.79 and 1.80 fold, P<0.0001, for normal and tumor eQTLs, respectively) was more prominent than for a combined dataset of 161 TFs tested in 91 cell types from multiple other tissues (1.09 fold, P=0.01, and 1.05 fold, P=0.16, for normal and tumor eQTLs respectively). Enrichment of cis-eQTLs in DHS was assessed in the three pancreatic cell lines (PANC-1, PA-TU-8988T and HPDE6-E6E7). We observed an overall 1.45-fold enrichment (P<0.0001) for histologically normal tissue cis-eQTLs and 1.32-fold enrichment (P=0.001) for tumor tissue cis-eQTLs in the three pancreatic cell lines (range 1.53–2.10 for normal eQTLs and 1.71–2.02 for tumor eQTLs), which was higher than the enrichment in a combined DHS dataset that included 125 cell types (1.06 fold, P=0.03 for normal tissue eQTLs and 1.01, P=0.44 for tumor tissue eQTLs).
Table 3.
Enrichment of cis-eQTLs from histologically normal (LTG) and tumor-derived pancreatic (TCGA/PAAD) tissue samples in putative functional regions.
| A. ENCODE PANC-1* | ||||
|---|---|---|---|---|
|
| ||||
| Epigenetic Mark | Normal tissue eQTLs**
|
Tumor tissue eQTLs***
|
||
| Fold enrichment | P-value | Fold enrichment | P-value | |
| DNase I HS | 1.53 | 0.0001 | 1.85 | <0.0001 |
| NRSF | 1.72 | 0.07 | 1.66 | 0.18 |
| RNA PolII | 2.86 | <0.0001 | 3.4 | <0.0001 |
| SIN3A | 3.12 | <0.0001 | 2.88 | <0.0001 |
| TCF7L2 | 2.32 | <0.0001 | 2.22 | <0.0001 |
| H3K4Me1 | 1.65 | <0.0001 | 1.59 | 0.0001 |
| H3K4Me3 | 2.56 | <0.0001 | 2.6 | <0.0001 |
| H3K27Ac | 2.09 | <0.0001 | 1.86 | <0.0001 |
|
| ||||
| B. In-house replication# | ||||
|
| ||||
| Epigenetic Mark |
Normal tissue eQTLs**
|
Tumor tissue eQTLs***
|
||
| Fold enrichment | P-value | Fold enrichment | P-value | |
|
| ||||
| PANC-1 | ||||
| H3K4Me1 | 1.41 | 0.0002 | 1.48 | 0.001 |
| H3K4Me3 | 2.57 | <0.0001 | 2.53 | <0.0001 |
| RNA PolII | 0.73 | 1 | 0.77 | 1 |
| hTERT-HPNE | ||||
| H3K4Me1 | 1.11 | 0.1 | 1.19 | 0.001 |
| H3K4Me3 | 2.52 | <0.0001 | 2.43 | <0.0001 |
| RNA PolII | 1.52 | 0.04 | 1.43 | 0.03 |
DNase I hypersensitivity sites and histone modification marks/transcription factor binding sites are based on DNase-seq and ChIP-seq data generated in the PANC-1 pancreatic cancer cell line (PANC-1) and provided by the Encyclopedia of DNA Elements (ENCODE) project.
Cis-eQTLs from the analysis in histologically normal pancreatic tissue samples (LTG).
Cis-eQTLs from the analysis in pancreatic tumor tissue samples (TCGA/PAAD). The official (UniProt) name for NRSF is REST: RE1-silencing transcription factor; RNA PolII: RNA polymerase II; SIN3A: Paired amphipathic helix protein Sin3a; TCF7L2: Transcription factor 7-like 2.
The in-house replication was performed in two pancreatic cell lines: PANC-1 (tumor derived) and hTERT-HPNE (normal derived cell line) (Reference 20).
Enrichment of cis-eQTLs was also tested in genomic regions of accessible chromatin in endocrine pancreatic tissues [28, 29]. Strong enrichment was observed for promoters (1.53–1.97 fold) and transcriptionally active regions (1.53–1.56 fold) in pancreatic islets; no significant enrichment was seen in insulators or repressed chromatin (Supplementary Table 7).
eQTLs for common pancreatic cancer susceptibility loci from GWAS
To investigate if the biological mechanisms underlying common pancreatic cancer risk loci identified by GWAS relate to gene expression regulation in cis, we tested the association between published pancreatic cancer susceptibility variants[21, 22, 23, 24] and expression levels of nearby genes (Supplementary Table 8). The most significant eQTL was seen for a pancreatic cancer risk locus on chromosome 9q34.2 in the ABO (ABO blood group transferase) gene[23]. The SNP that marks this locus (rs687289)[21] was associated with ABO gene expression in histologically normal (P=5.8×10⁻⁸, β=0.85; Figure 4A) and tumor derived (P=8.3×10⁻⁵, β=0.51) samples (Figure 4B). This association replicated in the GTEx pancreatic samples (n=149, P=3.4×10⁻¹², β=0.89; Supplementary Figures 3 and 4) as well as in most other tissues in GTEx (Supplementary Table 9). The protective allele at rs687289 (C) is highly correlated (r2=0.97 in the 1000 Genomes EUR samples) with a single base pair insertion/deletion (indel) variant in exon 6 of ABO (rs8176719: -/G) which characterizes the human O blood group[30]. The deletion allele at rs8176719 shifts the reading frame of the ABO gene at amino acid 87 (Figure 4C, filled blue circle) and introduces a stop codon ~30 amino acids downstream (Figure 4C, filled red circles), leading to a nonfunctional protein with regard to glycosyltransferase activity. The presence of such a premature termination codon (PTC) prompted us to ask whether the nonfunctional O blood group (ABO “O”) mRNA is a substrate for the nonsense mediated decay (NMD) mRNA degradation pathway[31] as this could explain why “O” variant ABO mRNA levels are lower than “non-O” ABO mRNA levels. The major feature that predicts whether an mRNA is subjected to NMD is a stop codon situated >50 nucleotides upstream of the last exon-exon junction[31, 32]. In the ABO “O” mRNA, the PTC is situated 19 nucleotides upstream of the last exon-exon junction, which means that it is not predicted to be a NMD substrate based on this criterion. However, a stop codon followed by a long 3’ untranslated region (3’ UTR) can also trigger NMD in some cases, although this feature is not generally correlated with NMD[31, 32]. Mapping the 3’ end of the ABO mRNAs by 3’ rapid amplification of cDNA ends (3’ RACE) showed that the 3’ UTR (2,148–2,858 nucleotides) is significantly longer than currently annotated by RefSeq or UCSC (Figure 4C). The long 3’UTR could mean that both mRNAs are NMD substrates. To formally test whether NMD reduces the levels of the ABO mRNAs, we used siRNA-mediated knockdown of two crucial NMD genes, SMG6 and UPF1, in pancreatic cancer cell lines that are either homozygous (AsPC-1) or heterozygous (Capan-1) for the rs8176719 deletion allele. The ABO “non-O” mRNA is expressed at a higher level (5.3 +/−1.1 fold) level than the “O” mRNA in the Capan-1 cell line (Figure 4E, grey bar graph), reflecting the eQTL observations (Figure 4A–B). Knockdown of SMG6 and UPF1 was confirmed by western blotting (Figure 4D) and concomitant significant accumulation of the positive control NMD mRNA substrate GAS5 (Figure 4E) as expected. A significant ~2–2.5-fold accumulation of ABO “O” mRNA levels was also observed in both cell lines upon depletion of SMG6 (Figure 4E, colored bar graphs). However, since knockdown of UPF1, which acts upstream of SMG6[31], only had a modest effect on ABO “O” mRNA levels, it was not clear whether the observed low levels of this mRNA were due to NMD. We therefore assessed mRNA degradation using a pulse-chase approach, which revealed no distinctive differences in the decay profiles of the ABO “non-O” and “O” mRNAs under control and knockdown conditions. Additionally, no major difference between the decay profiles of the two ABO mRNAs could be observed (Figure 4E, line graphs). We therefore conclude that the observed differences in ABO “O” and “non-O” mRNA levels are likely not due to NMD or alterations in mRNA degradation rates in general.
Figure 4. eQTLs for pancreatic cancer GWAS risk variants on chromosome 9q34.2 and assessment of nonsense mediated decay for the ABO mRNA.
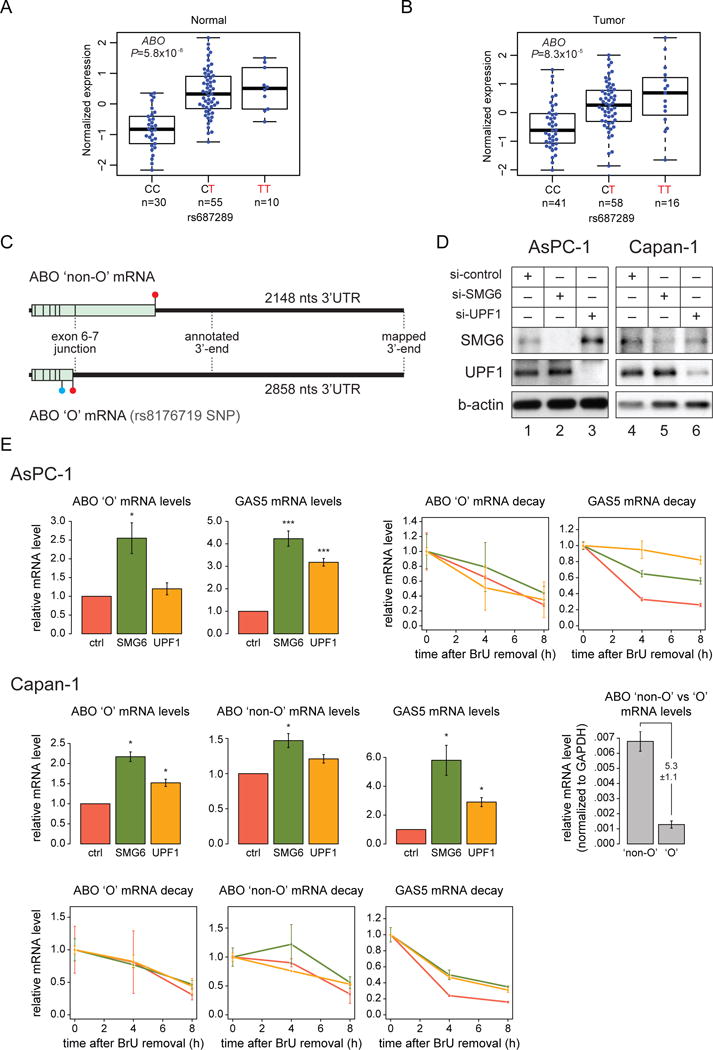
The association between rs687289 on chromosome 9q34.2 and ABO mRNA expression is shown for histologically normal samples (A) and tumor-derived samples (B). The risk increasing allele is shown in red and the number of samples in each group is indicated below each genotype. (C) Schematic figure of the ABO “non-O” and “O” mRNAs. The open reading frames are shown as light green boxes with exon-exon junctions indicated by vertical lines. 5’ and 3’UTRs are shown as black lines flanking the open reading frames. Termination codons are indicated by filled red circles and the position of the rs8176719 deletion variant in the ABO “O” mRNA is indicated with a filled blue circle. The position of the annotated and the RACE-mapped 3’end of the mRNAs and the lengths of the 3’UTRs are also shown. The drawing is to scale. Nts: nucleotides. (D) Western blots illustrating the siRNA-mediated knockdown of SMG6 and UPF1 proteins in AsPC-1 and Capan-1 cells. (E) RT-qPCR analyses of steady-state levels and decay profiles of the indicated mRNA species. Control, SMG6 and UPF1 knockdown data are shown in red, green and orange, respectively. Error-bars display standard error of mean (SEM) in histograms (n=5 for AsPC-1 and n=3 for Capan-1) and standard deviation from two technical replicates for the mRNA decay profile plots (2 experiments were performed for AsPC-1 and Capan-1 cells each; representative decay profiles are shown). *: P < 0.05, ***: P < 0.001 (based on two-tailed t-tests). ABO gene expression (in panels A and B above) is also shown by genotypes at both rs687289 (C/G) and rs8176719 (-/G) in Supplementary Figure 4.
Although we did not observe additional cis-eQTLs for pancreatic cancer risk loci identified by GWAS after corrections for multiple testing (FDR<0.1), nominally significant findings were seen for a number of risk loci. The most consistent of these was for rs16986825 on chr22q12.1 where lower XBP1 (X-box binding protein 1) expression was observed in carriers of pancreatic cancer risk-increasing alleles, both in pancreatic tumor samples (P=0.0058, β= −0.31) and in GTEx (P=0.00022, β= −0.38). This effect was not significant in histologically normal LTG samples (P=0.64, β= −0.065) (Supplementary Table 8).
Identification of ASE loci and ASE genes
We next assessed allele specific expression (ASE), whereby genetic loci with expressed heterozygous variants exhibit allelic ratio imbalances, as an alternate method to identify the presence of cis effects on gene regulation. We identified a total of 12,929 ASE loci across the 95 normal samples (LTG sample set) and 22,813 ASE loci across the 115 tumor samples (TCGA sample set) at FDR<0.1 (corresponding to nominal P<3.3×10⁻³ and P<0.01, respectively). This accounts for 3.3% and 13.6% of the heterozygous exonic loci tested (Supplementary Figure 5) and a total of 6,869 and 8,376 genes with at least one ASE locus (i.e. ASE gene) across the combined histologically normal or tumor-derived samples, respectively (Supplementary Figure 6). The higher number of ASE loci observed in tumor samples is likely due to somatic copy number alterations (CNA) and clonal heterogeneity. After excluding genes disrupted by CNA in specific tumor samples, this number dropped to 7,620 (FDR<0.1). The majority of eGenes observed in the histologically normal (76%) and tumor-derived (90%) samples had at least one significant ASE locus at FDR<0.1, which is 1.5 (P<0.001) and 1.13 (P=0.003) fold higher than expected by chance (Supplementary Tables 10 and 11).
Eight eGenes from the histologically normal sample eQTL analysis also presented with nominally significant ASE (Figure 5A through D; Supplementary Table 12) including BTN3A2 (butyrophilin subfamily 3 member A2, P=5.3×10⁻¹¹), FAM118A (family with sequence similarity 118 member A, P=4.4×10⁻¹⁰), PM20D1 (peptidase M20 domain containing 1, P=3.6×10⁻⁷) and RFWD3 (ring finger and WD repeat domain 3, P=2.6×10⁻⁴). The two pancreatic cancer GWAS risk loci that associated with gene expression by eQTL analysis also exhibited ASE in histologically normal samples with suggestive P values. Risk-increasing haplotypes at 9q34.2 and 22q12.1 were associated with more (ABO, P=0.07) or less (XBP1, P=0.052) expression in heterozygous samples, respectively (Figure 5E and F), in agreement with the eQTL results described above. The direction of ASE and eQTL effects were consistent for all these loci.
Figure 5. ASE in pancreatic cancer GWAS risk regions and eGenes in histologically normal pancreatic tissue samples (LTG sample set).
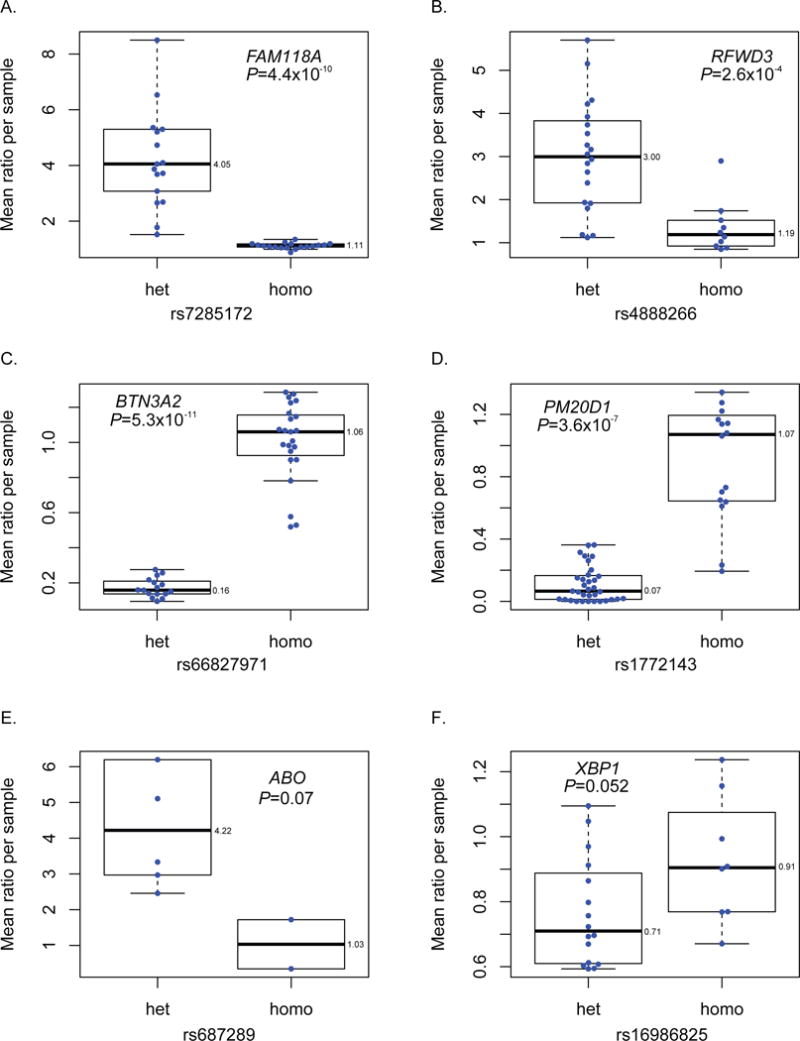
eGenes with strong ASE effects for BTN3A2 (A), PM20D1 (B), FAM118A (C) and RFWD3 (D). Mean allelic expression ratios for heterozygous (het) and homozygous (hom) coding variants in linkage disequilibrium (LD; D’=1) with pancreatic cancer risk alleles from GWAS for loci on chr9q34.2 (for ABO in E) and chr22q12.1 (for XBP1 in F). LD was based on the 1000G European (EUR) population. The direction of effect for ASE and cis-eQTLs were consistent for these genes.
DISCUSSION
Here, we describe an in-depth study of the impact of inherited genetic variants on the pancreatic transcriptome. By correlating genotypes with gene expression, we identified close to 40,000 cis-eQTLs in histologically normal and tumor derived pancreatic tissue samples, corresponding to 484 and 237 eGenes, respectively. A high degree of eQTL sharing has been described across tissues and individuals[9, 17, 18], but few studies have systematically compared this in normal and tumor-derived tissues[19]. In our study, 42% of eGenes were specific for the normal derived pancreatic tissue samples and 23% for pancreatic tumors. In comparison, a recent study using 90 paired colorectal cancer and histologically normal colon tissue samples estimated that 38% and 36% of eGenes were specific for the normal and tumor derived samples, respectively[19]. While the number of pancreatic tumor-specific eGenes in our samples may be underestimated due to a relatively low tumor content (range 5–73% in the TCGA pancreatic cancer set), these results indicate that the fraction of normal and tumor-specific eGenes may be comparable across tissues.
Genes whose genetic regulation appeared to be altered in pancreatic tumors include ALOX5, which encodes arachidonate 5-lipoxygenase, an integral enzyme in leukotriene biosynthesis. Leukotrienes are lipid mediators of inflammation that contribute to a number of diseases including asthma, arthritis, psoriasis, cardiovascular disease and cancer[33]. ALOX5 expression in pancreatic cancer cell lines induces growth, and is required for Kras mediated pancreatic tumorigenesis in mouse models[34, 35]. Genetic regulation of other genes was lost in the pancreatic cancer set; these include DSCC1, a gene involved in sister chromatid cohesion, DNA replication and maintenance of genome stability[36], and CDCA7, a cell division gene important for Notch mediated differentiation[37] and MYC dependent transformation and apoptosis[38]. Whether these genes are important for pancreatic cancer needs to be formally tested; however, expression of CDCA7 and ALOX5 was increased (4.7 fold, P=6.6×10⁻¹² and 2.3 fold, P=1.9×10⁻³, respectively) in pancreatic tumors in our study supporting a possible pro-tumorigenic role in this organ.
In agreement with previous studies, the majority of significant cis-eQTLs showed strong enrichment near TSSs[16, 39, 40]. Enrichment of eQTL variants was also observed in open chromatin and genomic regions bound by modified histones and transcription factors, and was more pronounced in pancreatic tissues, including pancreatic islet cells, as compared to other tissue types. Although the small number of transcription factor ChIP-seq datasets available for pancreatic tissues and cell lines does not permit broad assessment of enrichment for specific transcriptional regulators, these results suggest that the eQTLs we identified are relevant for transcriptional control in the pancreas. The greatest enrichment was noted for paired amphipathic helix protein Sin3a, a scaffold protein that brings together chromatin remodeling proteins and transcriptional regulators, including histone deacetylases (HDAC1 and HDAC2), into the SIN3 co-repressor complex and is important for multiple cellular roles including proliferation, development, differentiation and oncogenesis (reviewed by Kadamb et.al[26]). Notably, Sin3a antagonizes Myc activity, and the two proteins appear to be master transcriptional regulators that maintain a balance between cell growth and differentiation[41].
A common pancreatic cancer risk variant on chr9q34.2 was strongly associated with ABO expression in normal and tumor-derived samples. Although the marker SNP for this risk locus is noncoding[21], it is strongly correlated with the O blood group generating deletion variant in the ABO gene, indicating that the eQTL could be due to nonsense-mediated mRNA decay[31, 32] of the ABO “O” mRNA. However, we did not observe strong evidence of NMD for either the “O” or “non-O” ABO mRNAs. Germline alleles in the ABO gene locus influence risk of a number of traits, including cardiovascular diseases, metabolic traits, infectious diseases and cancer[42]. Although the underlying mechanism(s) of these associations are not clear, some studies have suggested that this relates to the glycosyltransferase activities of the “A” and “B” ABO proteins (lacking in the “O” protein variant) that could impact gut colonization by pathogens[43, 44], inflammation[45, 46], and/or blood von Willebrand factor (VWF)-factor VIII plasma levels[47]. In the absence of NMD for the ABO “O” mRNA, our results indicate that a gene regulatory element, whose strength depends on inherited pancreatic cancer risk variants, may influence expression of the ABO gene. The presence of an important gene regulatory element overlapping several highly significant and highly correlated ABO eQTL variants in the first intron of the gene is supported by active histone modification marks, an open chromatin structure and binding of multiple transcription factors in the ENCODE data. These findings suggest that future investigations of the molecular mechanism underlying disease risk mediated by susceptibility alleles at 9q34.2 should include a possible role for a gene regulatory mechanism on ABO gene expression and perhaps a yet undiscovered function for the ABO “O” mRNA and/or protein.
A suggestive eQTL was seen for a second pancreatic cancer risk locus on chr22q12.1 for XBP1 expression. This gene encodes X-box-binding protein 1 (XBP1) which is an important effector of the unfolded protein response (UPR). The UPR is a protective response to endoplasmic reticulum (ER) stress. Its components are constitutively expressed, and can be activated in the pancreas by inflammatory conditions such as pancreatitis, obesity and diabetes[48, 49, 50, 51]. Notably, these conditions represent known epidemiological risk factors for pancreatic cancer[52]. Likewise, perturbations in this mechanism of cellular recovery after ER stress may play a role in other cancers including breast cancer, glioma and colorectal cancer[53].
Taking advantage of the availability of allele-specific sequence read data, we investigated ASE to indirectly estimate the cis-regulatory effects of nearby genetic variants and identified 6,869 genes with ASE in normal tissues, which complemented our eQTL findings. This analysis is complicated in tumors by unevenly distributed allelic ratios in different regions of the genome due to copy number alterations, somatic mutations and tumor heterogeneity, thus likely inflating the ASE estimate. Although the number of ASE genes was reduced after excluding genes with CNAs, this analysis remains imperfect in tumor-derived samples. Nonetheless, the large overlap between eGenes and ASE genes in histologically normal and tumor-derived samples indicates that tumor samples can be of considerable value in investigating the effects of germline sequence variation on gene expression.
There are several strengths and limitations to our study. An important strength is that we assessed eQTLs in two independent pancreatic tissue sample sets (LTG, histologically normal; TCGA, tumor) and replicated the majority of our findings in the publicly available GTEx Consortium dataset. Tissue heterogeneity is a limitation, including a small amount of endocrine pancreatic cells (1–2%) in the histologically normal samples and low tumor cellularity in many of the tumor samples (range 5–73%). Likewise, as some of the histologically normal tissue samples are derived from pancreatic cancer patients, we cannot completely exclude changes by the tumor to the transcriptome of the adjacent histologically normal tissue. Finally, a larger number of pancreatic samples would have enhanced statistical power for the eQTL analysis and accuracy for enrichment analyses.
In conclusion, we have performed a comprehensive analysis of the genetic architecture of gene expression in histologically normal and tumor-derived pancreatic tissues. We identified a large number of genetic variants that associate with gene expression in pancreatic tissues, which are enriched in gene regulatory elements that are functional in this organ. Our results may facilitate the understanding of the molecular mechanisms underlying pancreatic cancer risk alleles and provide a rich dataset for future studies of the impact inherited genetic variants exert on gene expression in pancreatic tissues.
Supplementary Material
SUMMARY BOX.
What is already known about this subject?
Expression quantitative trait loci (eQTLs) are common in human tissues.
There is an important lack of knowledge on the genetic regulation of gene expression in pancreatic tissues, how this regulation may be altered in pancreatic tumors, and how it relates to germline loci known to influence pancreatic cancer risk.
What are the new findings?
Extensive influence was seen on gene expression by noncoding variants in pancreatic tissue samples. Approximately 23% and 42% of genes harboring eQTLs may be specific to tumor or normal derived tissue samples, respectively, and some genes have opposite effects in normal and tumor derived samples.
Expression QTLs were enriched close to transcriptional start sites and in noncoding functional elements important for pancreatic exocrine tissues, as well as highly shared with the endocrine pancreas.
A large number of eQTLs were shared between normal and tumor derived pancreatic tissue samples; these eQTLs had stronger effect sizes and were located closer to transcriptional start sites than non-shared eQTLs.
Pancreatic cancer risk alleles on chr9q34.2 were strongly associated with ABO gene expression; this effect may be due to allele specific effects of the risk variants on a noncoding gene regulatory element.
How might it impact clinical practice in the foreseeable future?
Our study has no direct impact on clinical practice. However, we show that gene expression in histologically normal and tumor derived pancreatic tissues is influenced by noncoding germline variation, including pancreatic cancer risk variants.
We have created a rich dataset for future studies of gene regulation in pancreatic tissues that will be shared with the scientific research community.
Acknowledgments
We thank the patients and donors of tissue and DNA samples that made this study possible. We are grateful to staff at Mayo Clinic (Rochester, MN), Memorial Sloan Kettering Cancer Center (New York City, NY) and Penn State College of Medicine (Hershey, PA) for help with tissue collection and processing. We thank Bao Tran, Jyoti Shetty and other members of the NCI Center for Cancer Research (CCR) Sequencing Facility for sequencing RNA from histologically normal pancreatic tissue samples as well as Laurie Burdett, Belynda Hicks, Amy Hutchinson and other staff at the National Cancer Institute’s Division of Epidemiology and Genetics (DECG) Cancer Genomics Research Laboratory for GWAS genotyping. This study utilized the high-performance computational capabilities of the Biowulf Linux cluster at the NIH, Bethesda, MD, USA (http://biowulf.nih.gov). We would also like to convey our gratitude to Dr. Anna Gloyn at the Wellcome Trust Centre for Human Genetics, the Oxford Centre for Diabetes, Endocrinology and Metabolism and the Oxford NIHR Biomedical Research Centre at the University of Oxford, Oxford, UK, for generously providing cis-eQTL results and epigenetic chromatin states from pancreatic islets for the analyses presented in this paper.
The results published here are in part based upon data generated by The Cancer Genome Atlas (TCGA) managed by the NCI and NHGRI. Information about TCGA can be found at http://cancergenome.nih.gov/. We acknowledge the clinical contributors that provided PDAC samples and the data producers of RNAseq and GWAS genotype data from TCGA Research Network. We furthermore thank the members of the TCGA PAAD AWG for providing absolute purity information for pancreatic tumor samples that were included in this analysis. The datasets used for the analyses described in this manuscript were obtained by formal permission through the TCGA Data Access Committee (DAC).
We acknowledge clinical and data producers of The Genotype-Tissue Expression (GTEx) Project. This project was supported by the Common Fund of the Office of the Director of the National Institutes of Health (commonfund.nih.gov/GTEx). Additional funds were provided by the NCI, NHGRI, NHLBI, NIDA, NIMH, and NINDS. Donors were enrolled at Biospecimen Source Sites funded by NCI\Leidos Biomedical Research, Inc. subcontracts to the National Disease Research Interchange (10XS170), Roswell Park Cancer Institute (10XS171), and Science Care, Inc. (X10S172). The Laboratory, Data Analysis, and Coordinating Center (LDACC) was funded through a contract (HHSN268201000029C) to The Broad Institute, Inc. Biorepository operations were funded through a Leidos Biomedical Research, Inc. subcontract to Van Andel Research Institute (10ST1035). Additional data repository and project management were provided by Leidos Biomedical Research, Inc. (HHSN261200800001E). The Brain Bank was supported supplements to University of Miami grant DA006227. Statistical Methods development grants were made to the University of Geneva (MH090941 & MH101814), the University of Chicago (MH090951, MH090937, MH101825, & MH101820), the University of North Carolina - Chapel Hill (MH090936), North Carolina State University (MH101819), Harvard University (MH090948), Stanford University (MH101782), Washington University (MH101810), and to the University of Pennsylvania (MH101822). The datasets used for the analyses described in this manuscript were obtained from dbGaP at http://www.ncbi.nlm.nih.gov/gap (accession number phs000424.v6.p1) on March 5, 2014.
Funding: This study was supported by the Intramural Research Program of the Division of Cancer Epidemiology and Genetics, National Cancer Institute, National Institutes of Health. MvdB is supported by a Novo Nordisk postdoctoral fellowship run in partnership with the University of Oxford. MIM is a Wellcome Trust Senior Investigator and is supported by Wellcome Trust awards (#098381, 090532) and NIH grants (U01-DK105535).
Footnotes
Methods and additional Results are detailed in a Supplementary Material section.
Competing interests: None
Contributors: LTA and MZ had full access to all data in the study and take responsibility for the integrity of the data and the accuracy of data analysis. LTA: study concept and design. MZ, BZ, WX, JWH, MvdB, HP, MIM, SJC, NC, JPS, SHO, GMP and JS: contribution to study design. MZ, BZ, WX, IC, JS and LTA: acquisition of data. MZ, SLA, BZ, WX, JWH, XZ, LR, MvdB, JJ, HP, TZ, LS, AJ, CCC, BZ, WZ, THJ, MIM, NC, BW, JPS, SHO, GMP, JS and LTA: analysis and interpretation of data. MZ and LTA: drafting the manuscript. SJC and KMB: critical review of the manuscript. MZ, BZ, JS and LTA: statistical analysis. BAM, WRB, HO, MY, RCK, GLM, IC and LTA: administrative, technical or material support. LTA: funding and study supervision.
Disclaimer: The views presented in this article do not necessarily reflect current or future opinion or policy of the National Institutes of Health or the US Food and Drug Administration. Any mention of commercial products is for clarification and not intended as endorsement.
References
- 1.Siegel RL, Miller KD, Jemal A. Cancer statistics, 2016. CA Cancer J Clin. 2016;66:7–30. doi: 10.3322/caac.21332. [DOI] [PubMed] [Google Scholar]
- 2.Vincent A, Herman J, Schulick R, Hruban RH, Goggins M. Pancreatic cancer. Lancet. 2011;378:607–20. doi: 10.1016/S0140-6736(10)62307-0. [DOI] [PMC free article] [PubMed] [Google Scholar]
- 3.Malvezzi M, Bertuccio P, Levi F, La Vecchia C, Negri E. European cancer mortality predictions for the year 2014. Annals of oncology: official journal of the European Society for Medical Oncology / ESMO. 2014;25:1650–6. doi: 10.1093/annonc/mdu138. [DOI] [PubMed] [Google Scholar]
- 4.Rahib L, Smith BD, Aizenberg R, Rosenzweig AB, Fleshman JM, Matrisian LM. Projecting cancer incidence and deaths to 2030: the unexpected burden of thyroid, liver, and pancreas cancers in the United States. Cancer Res. 2014;74:2913–21. doi: 10.1158/0008-5472.CAN-14-0155. [DOI] [PubMed] [Google Scholar]
- 5.ENCODE Project Consortium. An integrated encyclopedia of DNA elements in the human genome. Nature. 2012;489:57–74. doi: 10.1038/nature11247. [DOI] [PMC free article] [PubMed] [Google Scholar]
- 6.Roadmap Epigenomics C, Kundaje A, Meuleman W, Ernst J, Bilenky M, Yen A, et al. Integrative analysis of 111 reference human epigenomes. Nature. 2015;518:317–30. doi: 10.1038/nature14248. [DOI] [PMC free article] [PubMed] [Google Scholar]
- 7.Battle A, Mostafavi S, Zhu X, Potash JB, Weissman MM, McCormick C, et al. Characterizing the genetic basis of transcriptome diversity through RNA-sequencing of 922 individuals. Genome Res. 2014;24:14–24. doi: 10.1101/gr.155192.113. [DOI] [PMC free article] [PubMed] [Google Scholar]
- 8.Lappalainen T, Sammeth M, Friedlander MR, t Hoen PA, Monlong J, Rivas MA, et al. Transcriptome and genome sequencing uncovers functional variation in humans. Nature. 2013;501:506–11. doi: 10.1038/nature12531. [DOI] [PMC free article] [PubMed] [Google Scholar]
- 9.The GTEx Consortium. Human genomics. The Genotype-Tissue Expression (GTEx) pilot analysis: multitissue gene regulation in humans Science. 2015;348:648–60. doi: 10.1126/science.1262110. [DOI] [PMC free article] [PubMed] [Google Scholar]
- 10.Ongen H, Dermitzakis ET. Alternative Splicing QTLs in European and African Populations. Am J Hum Genet. 2015;97:567–75. doi: 10.1016/j.ajhg.2015.09.004. [DOI] [PMC free article] [PubMed] [Google Scholar]
- 11.Kilpinen H, Waszak SM, Gschwind AR, Raghav SK, Witwicki RM, Orioli A, et al. Coordinated effects of sequence variation on DNA binding, chromatin structure, and transcription. Science. 2013;342:744–7. doi: 10.1126/science.1242463. [DOI] [PMC free article] [PubMed] [Google Scholar]
- 12.McVicker G, van de Geijn B, Degner JF, Cain CE, Banovich NE, Raj A, et al. Identification of genetic variants that affect histone modifications in human cells. Science. 2013;342:747–9. doi: 10.1126/science.1242429. [DOI] [PMC free article] [PubMed] [Google Scholar]
- 13.Grubert F, Zaugg JB, Kasowski M, Ursu O, Spacek DV, Martin AR, et al. Genetic Control of Chromatin States in Humans Involves Local and Distal Chromosomal Interactions. Cell. 2015;162:1051–65. doi: 10.1016/j.cell.2015.07.048. [DOI] [PMC free article] [PubMed] [Google Scholar]
- 14.Nica AC, Dermitzakis ET. Expression quantitative trait loci: present and future. Philos Trans R Soc Lond B Biol Sci. 2013;368:20120362. doi: 10.1098/rstb.2012.0362. [DOI] [PMC free article] [PubMed] [Google Scholar]
- 15.Pickrell JK, Marioni JC, Pai AA, Degner JF, Engelhardt BE, Nkadori E, et al. Understanding mechanisms underlying human gene expression variation with RNA sequencing. Nature. 2010;464:768–72. doi: 10.1038/nature08872. [DOI] [PMC free article] [PubMed] [Google Scholar]
- 16.Montgomery SB, Sammeth M, Gutierrez-Arcelus M, Lach RP, Ingle C, Nisbett J, et al. Transcriptome genetics using second generation sequencing in a Caucasian population. Nature. 2010;464:773–7. doi: 10.1038/nature08903. [DOI] [PMC free article] [PubMed] [Google Scholar]
- 17.Mele M, Ferreira PG, Reverter F, DeLuca DS, Monlong J, Sammeth M, et al. Human genomics. The human transcriptome across tissues and individuals. Science. 2015;348:660–5. doi: 10.1126/science.aaa0355. [DOI] [PMC free article] [PubMed] [Google Scholar]
- 18.Grundberg E, Small KS, Hedman AK, Nica AC, Buil A, Keildson S, et al. Mapping cis- and trans-regulatory effects across multiple tissues in twins. Nature genetics. 2012;44:1084–9. doi: 10.1038/ng.2394. [DOI] [PMC free article] [PubMed] [Google Scholar]
- 19.Ongen H, Andersen CL, Bramsen JB, Oster B, Rasmussen MH, Ferreira PG, et al. Putative cis-regulatory drivers in colorectal cancer. Nature. 2014;512:87–90. doi: 10.1038/nature13602. [DOI] [PubMed] [Google Scholar]
- 20.Jia J, Parikh H, Xiao W, Hoskins JW, Pflicke H, Liu X, et al. An integrated transcriptome and epigenome analysis identifies a novel candidate gene for pancreatic cancer. BMC medical genomics. 2013;6:33. doi: 10.1186/1755-8794-6-33. [DOI] [PMC free article] [PubMed] [Google Scholar]
- 21.Wolpin BM, Rizzato C, Kraft P, Kooperberg C, Petersen GM, Wang Z, et al. Genome-wide association study identifies multiple susceptibility loci for pancreatic cancer. Nat Genet. 2014;46:994–1000. doi: 10.1038/ng.3052. [DOI] [PMC free article] [PubMed] [Google Scholar]
- 22.Childs EJ, Mocci E, Campa D, Bracci PM, Gallinger S, Goggins M, et al. Common variation at 2p13.3, 3q29, 7p13 and 17q25.1 associated with susceptibility to pancreatic cancer. Nat Genet. 2015;47:911–6. doi: 10.1038/ng.3341. [DOI] [PMC free article] [PubMed] [Google Scholar]
- 23.Amundadottir L, Kraft P, Stolzenberg-Solomon RZ, Fuchs CS, Petersen GM, Arslan AA, et al. Genome-wide association study identifies variants in the ABO locus associated with susceptibility to pancreatic cancer. Nat Genet. 2009;41:986–90. doi: 10.1038/ng.429. [DOI] [PMC free article] [PubMed] [Google Scholar]
- 24.Petersen GM, Amundadottir L, Fuchs CS, Kraft P, Stolzenberg-Solomon RZ, Jacobs KB, et al. A genome-wide association study identifies pancreatic cancer susceptibility loci on chromosomes 13q22.1, 1q32.1 and 5p15.33. Nat Genet. 2010;42:224–8. doi: 10.1038/ng.522. [DOI] [PMC free article] [PubMed] [Google Scholar]
- 25.van de Bunt M, Manning Fox JE, Dai X, Barrett A, Grey C, Li L, et al. Transcript Expression Data from Human Islets Links Regulatory Signals from Genome-Wide Association Studies for Type 2 Diabetes and Glycemic Traits to Their Downstream Effectors. PLoS Genet. 2015;11:e1005694. doi: 10.1371/journal.pgen.1005694. [DOI] [PMC free article] [PubMed] [Google Scholar]
- 26.Kadamb R, Mittal S, Bansal N, Batra H, Saluja D. Sin3: insight into its transcription regulatory functions. European journal of cell biology. 2013;92:237–46. doi: 10.1016/j.ejcb.2013.09.001. [DOI] [PubMed] [Google Scholar]
- 27.Mao CD, Byers SW. Cell-context dependent TCF/LEF expression and function: alternative tales of repression, de-repression and activation potentials. Critical reviews in eukaryotic gene expression. 2011;21:207–36. doi: 10.1615/critreveukargeneexpr.v21.i3.10. [DOI] [PMC free article] [PubMed] [Google Scholar]
- 28.Pasquali L, Gaulton KJ, Rodriguez-Segui SA, Mularoni L, Miguel-Escalada I, Akerman I, et al. Pancreatic islet enhancer clusters enriched in type 2 diabetes risk-associated variants. Nat Genet. 2014;46:136–43. doi: 10.1038/ng.2870. [DOI] [PMC free article] [PubMed] [Google Scholar]
- 29.Horikoshi M, Mgi R, van de Bunt M, Surakka I, Sarin AP, Mahajan A, et al. Discovery and Fine-Mapping of Glycaemic and Obesity-Related Trait Loci Using High-Density Imputation. PLoS Genet. 2015;11:e1005230. doi: 10.1371/journal.pgen.1005230. [DOI] [PMC free article] [PubMed] [Google Scholar]
- 30.Yamamoto F, Clausen H, White T, Marken J, Hakomori S. Molecular genetic basis of the histo-blood group ABO system. Nature. 1990;345:229–33. doi: 10.1038/345229a0. [DOI] [PubMed] [Google Scholar]
- 31.Lykke-Andersen S, Jensen TH. Nonsense-mediated mRNA decay: an intricate machinery that shapes transcriptomes. Nature reviews Molecular cell biology. 2015;16:665–77. doi: 10.1038/nrm4063. [DOI] [PubMed] [Google Scholar]
- 32.Lindeboom RG, Supek F, Lehner B. The rules and impact of nonsense-mediated mRNA decay in human cancers. Nat Genet. 2016;48:1112–8. doi: 10.1038/ng.3664. [DOI] [PMC free article] [PubMed] [Google Scholar]
- 33.Radmark O, Werz O, Steinhilber D, Samuelsson B. 5-Lipoxygenase, a key enzyme for leukotriene biosynthesis in health and disease. Biochim Biophys Acta. 2015;1851:331–9. doi: 10.1016/j.bbalip.2014.08.012. [DOI] [PubMed] [Google Scholar]
- 34.Knab LM, Grippo PJ, Bentrem DJ. Involvement of eicosanoids in the pathogenesis of pancreatic cancer: the roles of cyclooxygenase-2 and 5-lipoxygenase. World J Gastroenterol. 2014;20:10729–39. doi: 10.3748/wjg.v20.i31.10729. [DOI] [PMC free article] [PubMed] [Google Scholar]
- 35.Knab LM, Schultz M, Principe DR, Mascarinas WE, Gounaris E, Munshi HG, et al. Ablation of 5-lipoxygenase mitigates pancreatic lesion development. J Surg Res. 2015;194:481–7. doi: 10.1016/j.jss.2014.10.021. [DOI] [PMC free article] [PubMed] [Google Scholar]
- 36.Bermudez VP, Maniwa Y, Tappin I, Ozato K, Yokomori K, Hurwitz J. The alternative Ctf18-Dcc1-Ctf8-replication factor C complex required for sister chromatid cohesion loads proliferating cell nuclear antigen onto DNA. Proc Natl Acad Sci USA. 2003;100:10237–42. doi: 10.1073/pnas.1434308100. [DOI] [PMC free article] [PubMed] [Google Scholar]
- 37.Guiu J, Bergen DJ, De Pater E, Islam AB, Ayllon V, Gama-Norton L, et al. Identification of Cdca7 as a novel Notch transcriptional target involved in hematopoietic stem cell emergence. J Exp Med. 2014;211:2411–23. doi: 10.1084/jem.20131857. [DOI] [PMC free article] [PubMed] [Google Scholar]
- 38.Gill RM, Gabor TV, Couzens AL, Scheid MP. The MYC-associated protein CDCA7 is phosphorylated by AKT to regulate MYC-dependent apoptosis and transformation. Mol Cell Biol. 2013;33:498–513. doi: 10.1128/MCB.00276-12. [DOI] [PMC free article] [PubMed] [Google Scholar]
- 39.Veyrieras JB, Kudaravalli S, Kim SY, Dermitzakis ET, Gilad Y, Stephens M, et al. High-resolution mapping of expression-QTLs yields insight into human gene regulation. PLoS Genet. 2008;4:e1000214. doi: 10.1371/journal.pgen.1000214. [DOI] [PMC free article] [PubMed] [Google Scholar]
- 40.Larson NB, McDonnell S, French AJ, Fogarty Z, Cheville J, Middha S, et al. Comprehensively evaluating cis-regulatory variation in the human prostate transcriptome by using gene-level allele-specific expression. Am J Hum Genet. 2015;96:869–82. doi: 10.1016/j.ajhg.2015.04.015. [DOI] [PMC free article] [PubMed] [Google Scholar]
- 41.Nascimento EM, Cox CL, MacArthur S, Hussain S, Trotter M, Blanco S, et al. The opposing transcriptional functions of Sin3a and c-Myc are required to maintain tissue homeostasis. Nat Cell Biol. 2011;13:1395–405. doi: 10.1038/ncb2385. [DOI] [PMC free article] [PubMed] [Google Scholar]
- 42.Yamamoto F, Cid E, Yamamoto M, Blancher A. ABO research in the modern era of genomics. Transfus Med Rev. 2012;26:103–18. doi: 10.1016/j.tmrv.2011.08.002. [DOI] [PubMed] [Google Scholar]
- 43.Risch HA. Pancreatic cancer: Helicobacter pylori colonization, N-nitrosamine exposures, and ABO blood group. Mol Carcinog. 2012;51:109–18. doi: 10.1002/mc.20826. [DOI] [PubMed] [Google Scholar]
- 44.Segurel L, Gao Z, Przeworski M. Ancestry runs deeper than blood: the evolutionary history of ABO points to cryptic variation of functional importance. Bioessays. 2013;35:862–7. doi: 10.1002/bies.201300030. [DOI] [PMC free article] [PubMed] [Google Scholar]
- 45.Risch HA, Yu H, Lu L, Kidd MS. ABO blood group, Helicobacter pylori seropositivity, and risk of pancreatic cancer: a case-control study. J Natl Cancer Inst. 2010;102:502–5. doi: 10.1093/jnci/djq007. [DOI] [PMC free article] [PubMed] [Google Scholar]
- 46.Michaud DS. Role of bacterial infections in pancreatic cancer. Carcinogenesis. 2013;34:2193–7. doi: 10.1093/carcin/bgt249. [DOI] [PMC free article] [PubMed] [Google Scholar]
- 47.Franchini M, Favaloro EJ, Targher G, Lippi G. ABO blood group, hypercoagulability, and cardiovascular and cancer risk. Crit Rev Clin Lab Sci. 2012;49:137–49. doi: 10.3109/10408363.2012.708647. [DOI] [PubMed] [Google Scholar]
- 48.Ron D, Walter P. Signal integration in the endoplasmic reticulum unfolded protein response. Nature reviews Molecular cell biology. 2007;8:519–29. doi: 10.1038/nrm2199. [DOI] [PubMed] [Google Scholar]
- 49.Kubisch CH, Sans MD, Arumugam T, Ernst SA, Williams JA, Logsdon CD. Early activation of endoplasmic reticulum stress is associated with arginine-induced acute pancreatitis. American journal of physiology Gastrointestinal and liver physiology. 2006;291:G238–45. doi: 10.1152/ajpgi.00471.2005. [DOI] [PubMed] [Google Scholar]
- 50.Hotamisligil GS. Endoplasmic reticulum stress and the inflammatory basis of metabolic disease. Cell. 2010;140:900–17. doi: 10.1016/j.cell.2010.02.034. [DOI] [PMC free article] [PubMed] [Google Scholar]
- 51.Iwawaki T, Akai R, Kohno K, Miura M. A transgenic mouse model for monitoring endoplasmic reticulum stress. Nature medicine. 2004;10:98–102. doi: 10.1038/nm970. [DOI] [PubMed] [Google Scholar]
- 52.Stolzenberg-Solomon RZ, Amundadottir LT. Epidemiology and Inherited Predisposition for Sporadic Pancreatic Adenocarcinoma. Hematol Oncol Clin North Am. 2015;29:619–40. doi: 10.1016/j.hoc.2015.04.009. [DOI] [PMC free article] [PubMed] [Google Scholar]
- 53.Kim H, Bhattacharya A, Qi L. Endoplasmic reticulum quality control in cancer: Friend or foe. Semin Cancer Biol. 2015;33:25–33. doi: 10.1016/j.semcancer.2015.02.003. [DOI] [PMC free article] [PubMed] [Google Scholar]
Associated Data
This section collects any data citations, data availability statements, or supplementary materials included in this article.