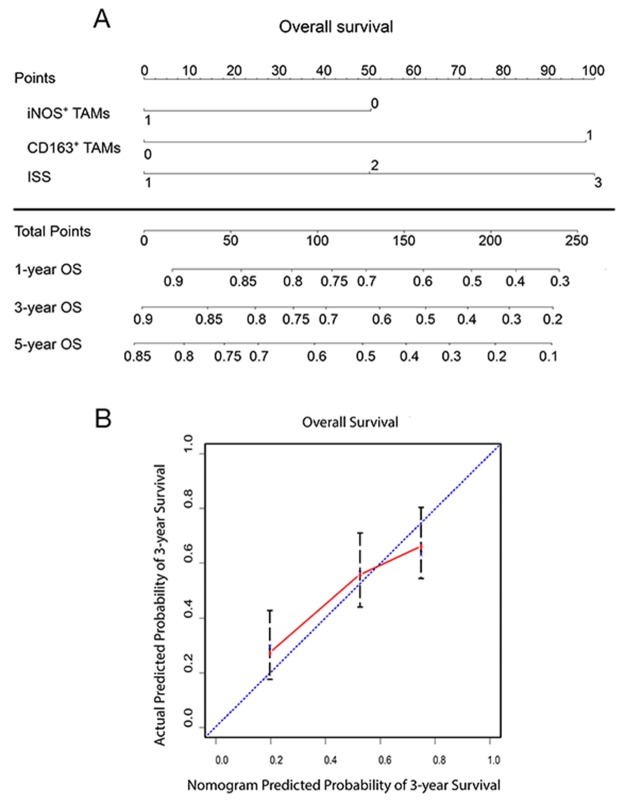
Figure 4. Prognostic nomogram to predict OS in patients with multiple myeloma.
(A) Nomogram generated to predict outcomes integrated with polarized TAMs (iNOS and CD163; 0 represents low density, 1 represents high density) and ISS (1 represents stage I, 2 represents stage II, 3 represents stage III). e.g. if one individual was found to have high iNOS+ TAMs, low CD163+ TAMs and ISS II at diagnosis, the nomogram score would be 150 and the 1-year OS probability would be slightly over 60%. (B) Calibration curve for nomogram-predicted and observed three-year outcomes.

