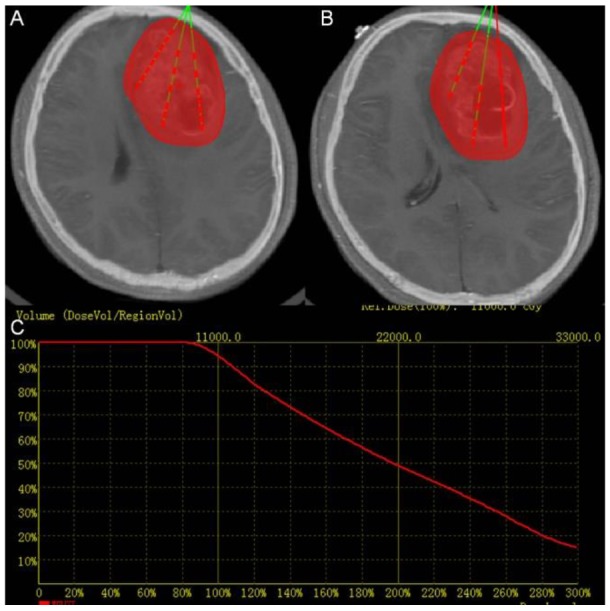
Figure 2. Treatment planning.

(A) and (B) Two slices of CT-MRI fused images showing the PTV in red and planned catheter and seed placement in green (C) Dose volume histogram of PTV of pre-operation treatment planning. The red curve shows the dose volume histogram of the target.
