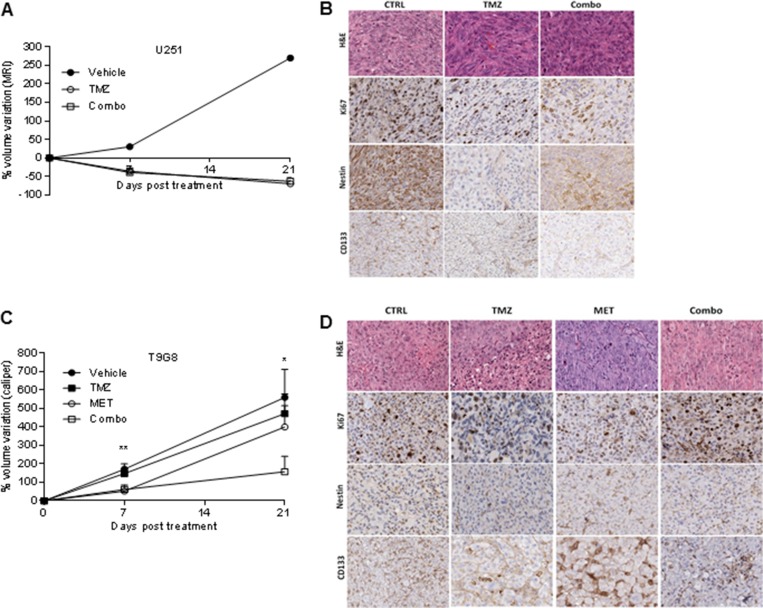
Figure 4. MET and TMZ effects in in vivo glioma models.
(A) Variation of U251 tumor volume measured at contrast-enhanced T1 MRI after treatment expressed as percentage of volume change. Error bars indicate SEM. (B) U251 derived orthotopic brain tumors from vehicle (CTRL), TMZ or TMZ/metformin (Combo) treated mice were analyzed for Ki67, Nestin and CD133 markers by immunohistochemistry. No difference between the tumor edge and bulk areas in IHC staining intensities or percentages of positive cells was observed for any of the investigated markers. H&E was performed for morphological evaluation of the tumors. Representative images are shown with original magnification x200. (C) Variation of T98G tumor volume measured using caliper after treatment expressed as percentage of volume variation. In T98G xenograft model already at 7 days, the combined treatment significantly slowed down tumor growth compared to control (p value = 0.005), moreover a transient reduction was observed with MET (p value = 0.03). After 3 weeks, only Combo-treated mice displayed tumor smaller than vehicle (p value = 0.04). Error bars indicate SEM. (D) T98G tumors from vehicle (CTRL), TMZ, MET or TMZ/metformin (Combo) treated mice, were analyzed for Ki67, Nestin and CD133 markers expression by immunohistochemistry. No difference between the tumor edge and bulk areas in IHC staining intensities or percentages of positive cells was observed for any of the investigated markers. Hematoxylin and eosin staining (H&E) was performed for morphological evaluation of the tumors. Representative images are shown with Original magnification x200.

