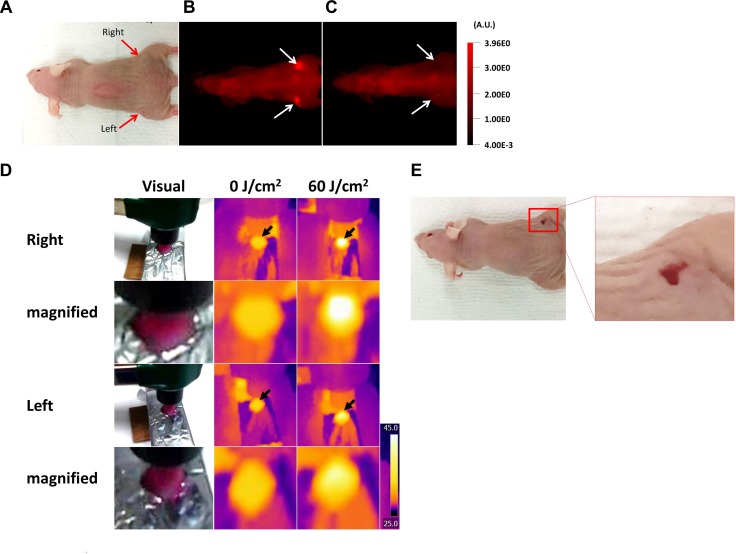
Figure 4. Thermal damage to mouse skin.
(A) Visual image before NIR-PIT. (B, C) IR700 fluorescence images before and after NIR-PIT. White arrows indicate the tumors. The fluorescence intensity of both tumors decreased after NIR light exposure. (D) The visual images and thermal images taken in the experiment above. Black arrows indicate the light exposure areas. The tumor at the right dorsum was heated to over 50°C at 60 J/cm2, whereas the left dorsal tumor was heated to under 50°C. (E) The visual image at 1 day after NIR-PIT. Only the tumor in the right dorsum exhibited a visual change suggestive of thermal injury.

