

Abstract
Protonation by carbonic acid H2CO3 of the strong base methylamine CH3NH2 in a neutral contact pair in aqueous solution is followed via Car–Parrinello molecular dynamics simulations. Proton transfer (PT) occurs to form an aqueous solvent-stabilized contact ion pair within 100 fs, a fast time scale associated with the compression of the acid–base hydrogen-bond (H-bond), a key reaction coordinate. This rapid barrierless PT is consistent with the carbonic acid-protonated base pKa difference that considerably favors the PT, and supports the view of intact carbonic acid as potentially important proton donor in assorted biological and environmental contexts. The charge redistribution within the H-bonded complex during PT supports a Mulliken picture of charge transfer from the nitrogen base to carbonic acid without altering the transferring hydrogen’s charge from approximately midway between that of a hydrogen atom and that of a proton.
Graphical abstract

1. INTRODUCTION
Carbonic acid H2CO3 has long been discussed as a component of a buffer along with bicarbonate and CO2 that stabilizes the pH in the human body1–5 as well as the pH of the seas and oceans.6 However, the acid is unstable and decomposes reversibly in aqueous solution to CO2 and H2O with a room temperature lifetime of ∼60 ms.7–15 Indeed, carbonic acid was only recently directly observed in aqueous solution,16 and relatively little is known about the chemical and biochemical reactivity of the intact H2CO3 molecule. In the present work, we present and analyze the results of Car–Parrinello molecular dynamics (CP MD) simulations of proton transfer (PT) in an aqueous solution from carbonic acid H2CO3 to a strong methylamine base in a neutral acid–base hydrogen (H)-bonded complex to give the product complex of the H-bonded bicarbonate-protonated methylamine ions,
| (1) |
We wish to determine theoretically (a) if carbonic acid, whose reactivity is relatively little studied, is a viable proton-donor on the time scale that it remains intact, and (b) whether the acid behaves, both in rate and mechanism, like a normal acid consistent with its pKa at a biologically relevant temperature 310 K (37 °C), and begin this effort here for the case where initially the acid and base are “in contact” in a hydrogen-bonded complex. A strong base is chosen to employ a strong thermodynamic driving force for the PT, which would favor a barrierless reaction, more readily studied. The precise value of the equilibrium constant Ka of aqueous H2CO3 has been a subject of debate for many decades and is still under consideration.17 H2CO3’s pKa was recently experimentally determined to be ∼3.49;16,18 this is a value quite different from the one sometimes reported in textbooks,19 but is, for example, consistent with the range of values subsequently found in computational studies of H2CO3’s PT to water in aqueous solution.20–22 Our rationales above, as well as the choice of a strong nitrogen base, derive especially from our proposal, described in more detail elsewhere,18 is that H2CO3 has the potential of being a major protonating agent of, for example, nitrogen bases in the blood.
The eq 1 carbonic acid–methylamine PT reaction is a component of the overall bimolecular protonation of methylamine by carbonic acid in aqueous solution, which should be a diffusion-controlled process, that is, controlled by the rate for the relative diffusive approach of the acid and base reactants rather than the rate of the on-contact PT eq 1.18 This statement is supported by the rapid, activationless character of the PT reaction that we will find within. Nonetheless, the intrinsic PT reaction for H2CO3 with nitrogen bases such as methylamine is key for its chemistry in a biochemical context. In addition, the activated PT process has often been studied from a theoretical perspective,23–30 but little is known about the molecular level details of the PT mechanism for such an activationless case. Further, the activationless character of the on-contact H2CO3−CH3NH2 PT reaction that we find should be consistent with H2CO3’s pKa, in line with one of our motivations detailed above. We pause to examine that issue here.
The on-contact rate constant for PT within a general acid–base complex AH⋯B has been shown to primarily depend on ΔpKa=pKa(HB+) − pKa(HA), the difference of the acid AH’s pKa value and that of the base B’s conjugate acid HB+16,31–33 (and has been exploited to determine the pKa of H2CO316,18). For larger ΔpKa values, the pKa difference is sufficiently large that the acid’s protonation of the base is barrierless i.e. not activated. PT within an on-contact complex AH⋯B occurs so rapidly that a PT rate constant cannot be defined, and the overall aqueous solution reaction is diffusion-controlled. As we have already stated, we will find this to be the case for the on-contact H2CO3⋯CH3NH2 PT reaction, and that this can be readily understood from carbonic acid’s pKa ∼ 3.516 as compared to the pKa of protonated methylamine ∼10.6.34,35 Thus, ΔpKa ∼ 7 for the reaction: H2CO3 is a far stronger acid than is CH3NH3+. This ΔpKa is already past the transition, near ΔpKa∼ 516,18,31–33 between activated and activation-less PT. This ΔpKa ∼ 7 acidity difference corresponds to a strongly favorable reaction free energy asymmetry ∼ −10 kcal/mol for the PT reaction. Since these pKa and free energy values refer to the production of the separated carboxylate anion and protonated methylamine species, the reaction free energy for the PT within the complex should be even more favorable, given the electrostatic cost to separate the H-bonded product ions to infinite separation.
We pause to place in a more general perspective our choice of an initial investigation of the “on contact” reaction, in an equilibrated acid–base complex (as described in section 2). If the PT reaction were only possible in this situation, then the standard theory of diffusion-influenced reactions gives the overall reaction rate constant by k = (keqkD)/(keq + kD),36 where kD is the diffusion-controlled rate constant and keq is the rate constant for the in contact, equilibrated reacting pair. The latter describes reasonably approximately the situation considered within, in our focus on the chemistry rather than the diffusion aspects of the reaction. Of course it is possible for the PT reaction to also occur through the intermediacy of one or more water molecules, via some sort of proton relay;37 indeed, we have found that this is the case, as will be reported elsewhere. Nonetheless, the present on contact case is important to study for at least two reasons (beyond those mentioned previously in this section). First, this on contact route can occur along with the more complex routes, and the relative efficacy of these routes needs to be established. Second, the on contact reaction affords the simplest opportunity of a detailed study of the electronic aspects of the PT reaction, which will greatly assist future assessment of the electronic aspects of more complex PT routes, for example, reaction involving a single water molecule between the acid and base.
The outline for the remainder of this paper is as follows. The simulation methods, including the construction of the H2CO3−CH3NH2 acid–base system, are detailed in section 2. Section 3 presents the temporal behavior for the nuclear coordinates during the PT reaction, that is, the H-bond separation and proton stretch, and examines the change in charge character associated with the transition of the neutral acid–base pair to the bicarbonate-protonated base ion pair in solution. Concluding remarks are offered in section 4.
2. SIMULATION DETAILS
Nonequilibrium CP38 ab initio MD simulations have been performed for the carbonic acid-methylamine pair on-contact in a box of 100 water molecules. In the following, we describe the construction of the simulation box containing the aqueous solution of the H-bonded acid–base pair complex with the aid of gas phase quantum chemistry calculations and classical solution phase MD simulations. CP MD simulation details, including the required equilibration are then presented. Finally, simulations to obtain reference water solvent structures are described for isolated species (carbonic acid, bicarbonate, methylamine, and protonated methylamine) in an aqueous solution; these provide comparison with the water solvent structure surrounding the acid–base pair.
2.1. Aqueous System Construction and CP MD Simulation Details
The carbonic acid-methylamine H-bonded complex was first optimized in the gas phase at the B3LYP/6-311+G** level of theory39,40 and basis set with the GAMESS package.41 In order to avoid waiting on diffusion time scales for the complex to form prior to the PT reaction eq 1, the acid–base H-bond length (see Scheme 1) is constrained to the OA−N distance Å during the optimization. This separation is small enough such that no waiting is required for strong H-bond formation, but is large enough for observation of subsequent PT on a reasonable time scale.
Scheme 1. Neutral On-Contact Carbonic Acid–Methylamine Pair with the Atoms Labeleda.
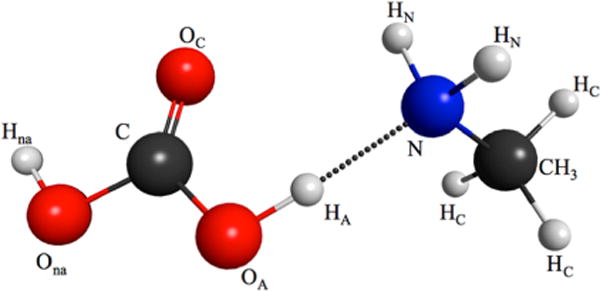
aLabels are maintained throughout the PT reaction producing the contact ion pair products. The cis–cis H2CO3 conformer studied here is the most stable one in aqueous solution.21
The complex is then solvated in 100 water molecules in a periodic cubic box maintaining the density at the neat liquid water value 1 g/cm3, appropriate for the dilute 310 K solution considered here. The 310 K temperature is employed in view of the interest in the carbonic acid activity in vivo (37 °C), as discussed in the Introduction. As an initial equilibration of this aqueous system, classical simulations are performed with the acid–base complex fixed at the above calculated gas phase geometry; this avoids the requirement of intramolecular force-field parameters, which are unavailable for carbonic acid. The simulation is carried out for 100 ps in the constant volume and temperature ensemble using the GROMACS package.42 The H-bonded complex-solvent intermolecular interactions are defined by their atomic charges and the Lennard–Jones (LJ) parameters. The complex’s atomic charges have been obtained as ESP charges from our quantum chemically optimized gas phase structure.43 The LJ parameters for atoms of methylamine are taken from previous simulations,44 while those of carbonic acid are taken from a bicarbonate study.45 Solvent molecules are modeled as rigid SPC/E water.46 The last configuration resulting from this classical simulation is taken as the starting point for the CP MD simulations, now described.
The CP MD simulations are performed with the CPMD package47 and the density functional theory (DFT) formalism with the gradient-corrected Becke, Lee, Yang, and Parr (BLYP) functional.39,40 The interactions of the valence electrons with the nuclei and core electrons are represented by Vanderbilt ultrasoft pseudopotentials,48–50 as have been used in previous studies.50–53 The plane wave basis set cutoff is set to 40 Ry.20,51–53 An electronic mass of 600 au and a 4 au (≈0.1 fs) time step were used, consistent with other relevant studies.20,51–53 In order to account for long-ranged electron correlations, a van der Waals correction proposed by Grimme54,55 is incorporated in the CPMD package,47 which improves the description for PT. Further, periodic boundary conditions in all three directions have been applied throughout the simulation. Trajectories have been saved every after 10 steps (∼1 fs) both during and postequilibration. An initial 500 step CP MD simulation is performed (again with the OA−N and OA−HA distances constrained) to obtain a system temperature of 310 K by temperature scaling. The Nosé–Hoover thermostat is employed to maintain the temperature at 310 K for the CP MD trajectories.56 (It is shown in Figure S4 of the Supporting Information (SI) that fixed NVE simulations yield very similar results.) Trajectory details are given in the next subsection.
2.2. CP MD Trajectory Details and Solvent Structure Equilibration
The classical MD results presented above for the aqueous solution of the frozen H2CO3−CH3NH2 complex provide the initial system configuration for the CP MD trajectories now discussed. As stated in subsection 2.1, the 2.9 Å OA⋯N H-bond separation allows observation of PT occurrence on a reasonable time scale.
Prior to the simulation of PT events, proper equilibration of the solvent structure surrounding the acid–base pair is critical to provide a proper solvent structure around the complex prior to PT, and to afford a reasonable sampling of initial possible solvent configurations. This equilibration is performed with constraints to prevent PT; these are subsequently released. These comprise harmonic restraints for the OA−HA and OA⋯N separations at 1 and 2.9 Å respectively, with a spring constant of 10 kcal/mol/Å2 for each. These separations help to ensure that the surrounding water solvent molecules are in a configuration that does not favor PT, that is, that favors the neutral pair reactant (cf. eq 1).
Ten CP MD reaction trajectories are examined in this work, in which the constraints are removed after an equilibration period (becoming increasingly longer with each trajectory). While a duration of tens of picoseconds is typically chosen for equilibrium CP MD simulations for a single trajectory,57 this is not practical for each trajectory within such a significant, 10-member, set of trajectories. In order to deal with this situation, the initial configurations for each of these 10 trajectories are thus taken from certain branch points within a single long CP MD equilibration trajectory; the ten reaction trajectories are then independent branches from this equilibration trajectory. The 10 different branch points serve two purposes. First, they progressively increase the length of the equilibration process; this also allows confirmation that the water solvent structure remains close to equilibrium throughout, providing proper starting structures for the reaction trajectories. They also provide sampling of different initial solvent environments, a feature critical for a set of such reaction trajectories.
The first reaction trajectory is initiated by releasing the constraints. The reaction trajectory is followed for ∼1 ps, with its initial configuration given by that of the first branch point, which is located at 3 ps from the beginning of the equilbration trajectory. This location choice is explained at the end of this subsection. The initial configuration for the second reaction trajectory is taken from the second branch point on the long equilibration trajectory; this point is located at 1 ps past the first branch point, that is, at 4 ps after the beginning of the equilibration trajectory, and the duration of the reaction trajectory is ∼1 ps. The initial configurations for each of the remaining eight reaction trajectories are chosen in a similar manner: the n + 1 trajectory is initiated by releasing, in the equilibration trajectory, the constraints at 1 ps after the previous reaction trajectory’s (n’s) branching point on the equilibration trajectory, and, as with all reaction trajectories, is of ∼1 ps duration. The 10th reaction trajectory is thus initiated 9 ps past the time of the first branch point. The entire equilibration trajectory is 12 ps long, since it is 9 ps past the time up to the first branch point, which was located at 3 ps past the trajectory’s commencement.
Since each one of these 10 reaction trajectories is followed for ∼1 ps after releasing the constraints, and the PT occurrence times are <100 fs (see below), ∼900 fs of each trajectory is related to post-PT processes. (The product ion pair production is always affected in under much less than a few hundred femtoseconds so extended 1 ps trajectories are not displayed here.) We note in passing that, as detailed in the following paper,58 on the detailed solvent participation in the reaction mechanism, such a reaction trajectory time interval precludes observation of solvent exchange around the complex but includes solvent librational and H-bond compression motions, with a typical time scale less than 200 fs.59–65
We have yet to explain our choice of 3 ps as the first branch point’s location on the equilibration trajectory. This is determined by the minimum time required for the initial CP MD equilibration period in order to commence the first reaction trajectory. To determine that minimum time, we have analyzed the radial distribution g(r) functions governing the separation between the carbonic acid O (OA) and water Hs from a simulation of an aqueous solution of isolated carbonic acid (simulation details for the isolated systems are discussed in the next subsection) with differing equilibration times. The results, provided in the Supporting Information (see Figure S1), indicate that this minimum equilibration time required is ∼2.5 ps; we then select the first branch, for the start of the first reaction trajectory, to be located at 3 ps after the start of the equilibration trajectory. The equilibration time preceding the inception of the nth reaction trajectory is thus (n + 2) ps, which is thus 12 ps for the last, 10th trajectory.
Finally, in order to confirm that the equilibrated system’s water solvent structure is consistent throughout the equilibration process, we have examined in section S1 of the SI the water–water (O⋯H) g(r) (Figure S2) calculated at all branching points. The determined water solvent structure is consistent with that obtained from bulk water CP MD simulations,15,57,66,67 and remains so throughout the entire 12 ps equilibration trajectory.
2.3. Simulation of Isolated Species
The CP MD simulations for the reference systems of isolated (i) carbonic acid, (ii) methylamine, (iii) bicarbonate anion, and (iv) protonated methylamine in aqueous solution are now described. These simulations provide the appropriate comparison of the water solvation structure for key sites for the H-bonded acid–base pair complex with the reference situation in the complex’s absence. For example, equilibrium solvent structures around the carbonic acid and methylamine base, each isolated in aqueous solution, provide a solvent structure surrounding OA and N which can be used as a reference for comparison with the corresponding water solvent structure for the on-contact pair before PT. Any deviation in solvation from that in the complex indicates solvent rearrangements specific to the acid–base pair. These trajectories also determine reference bond lengths, for example, OA−HA and HA−N, those are keys in defining a useful reduced coordinate to follow the PT, discussed in the next section.
Constructions of these four aqueous systems are similar to that for the on-contact complex, discussed in subsection 2.1. The systems are first equilibrated with classical MD in a periodic simulation box containing the isolated species plus 100 water molecules, with the same force-field as used in the complex case. CP MD simulations of the system were then run without any constraints for 6 ps, the first 3 ps serving as the equilibration period and trajectory analysis made during the latter 3 ps. CP MD simulation details are as those described in subsection 2.1 for the H-bonded complex case. No counterions are added for the ionic systems, since CP MD uses a neutralizing uniformly distributed charge in the simulation cell.38
3. PROTON TRANSFER RESULTS
We begin our investigation of the mechanism for the H2CO3⋯NH2CH → HCO3−⋯+HNH2CH3 eq 1 PT reaction by analyzing the progression of several key nuclear coordinates within the reactive acid–base complex: the proton stretch and the OA−N H-bond length (see Scheme 1). The accompanying progression of atomic charges is then discussed. Certain important qualitative aspects of the water solvent rearrangements associated with the PT will be noted. A detailing of such rearrangements in terms of a solvent coordinate, as well as the connection to reaction coordinates of this coordinate and the H-bond complex’s nuclear coordinates and change in charge character, will be presented in the following paper.58
3.1. H-bond Complex Nuclear Coordinates
We commence with the proton coordinate, defined as the difference of the OAHA and HAN stretch coordinates ( and , respectively)
| (2) |
Accordingly, negative and positive values of XPT correspond to proton positions closer to the proton donor OA and the proton acceptor N, respectively. Figure 1a displays XPT and the OA−N separation versus time for the fourth reaction trajectory, which serves as a sample for our collection of 10 trajectories. In Figure 1a, t = 0 is the time when the nuclear constraints used during the CP MD equilibration trajectory are released for this particular reaction trajectory. The reaction proceeds via a compression in the H-bond, with XPT following . The negative to positive passage of XPT indicates the PT process. The ensuing fast XPT product oscillations with a period of ∼10–15 fs are consistent with a proton stretch vibration in an H-bond νNH ∼ 2800 cm−168. The ∼100 fs oscillation period visible in Figure 1a is due to the product ion pair H-bond vibrational mode with frequency ∼200 cm−1; there is an impact of this vibration present in XPT as the slower oscillation, visible after ∼50 fs.
Figure 1.

(a) Proton coordinate eq 2 XPT (solid line) and (b) the normalized proton coordinate eq 3 xPT (solid line) versus time for the fourth reaction trajectory. The H-bond coordinate (dashed blue line) is also indicated for comparison. Here t = 0 is the time at which the and constraints were removed. The vertical red dashed line in (a) indicates the PT occurrence time tPT for that trajectory. (c) Ten trajectory-averaged xPT values (solid line) and the OA−N H-bond separation (dashed blue line) versus time, with t = 0 set for xPT = 0, our definition of the PT occurrence. xPT = 0 is indicated in both (b) and (c) as the red dashed line.
It is much more useful in following the PT in detail to define, following,69–72 a normalized version of eq 2,
| (3) |
where and are the average and values evaluated in the neutral reactant HOCOOH⋯NH2CH3 and the ionic product HOCOO−⋯+HNH2CH3, respectively. The reactant Å and product Å values were obtained from the isolated species CP MD simulations, as discussed in subsection 2.3. The structure of eq 3 describes xPT as a PT “order parameter” indicating whether the neutral or ionic H-bond complex is present:69–72 xPT is close to −1 for the neutral pair and is close to 1 for the ion pair. This motivates our definition of the PT occurrence time tPT as the time that xPT first crosses 0, the midpoint between the neutral and ion H-bonded complex pairs; tPT for each trajectory is given in Table 1.
Table 1.
Proton Transfer Occurrence Times tPT for the 10 Reaction Trajectories
| reaction trajectory | 1 | 2 | 3 | 4 | 5 | 6 | 7 | 8 | 9 | 10 |
| tPT (fs) | 41 | 61 | 40 | 58 | 60 | 49 | 33 | 65 | 75 | 53 |
Figure 1b displays xPT and the OA−N separation versus time for the fourth reaction trajectory (the results for all 10 reaction trajectories are presented in SI Figure S3). With the aid of xPT, one sees that the first minimum in H-bond coordinate coincides with PT, which occurs (xPT ∼ 0) at tPT = t ∼ 60 fs. As indicated in Table 1, the PT occurrence times for all trajectories are similar: tPT ∼ 40–75 fs. (In SI section S3, it is shown that a smaller initial OA−N separation leads to a somewhat smaller PT occurrence time.)
In Figure 1b, there is a direct transition across the dividing line xPT = 0 between the neutral pair reactant and the ion pair product, without any recrossing. Such a transition indicates that there is sufficient stabilization of the incipient carboxylate-protonated methylamine ion pair to avoid any immediate attempt at a return in the direction of the carboxylic acid-methylamine reactant pair. One interesting signature of the initial aspects of this stabilization apparent in Figure 1a and b is the larger period of the proton oscillations present in xPT just after PT, which subsequently shortens. This basic stabilization is due to the combination of a slight increase in H-bond separation and especially a fast water solvent response stabilizing the contact ion pair; this stabilization is explicitly reflected in Figure 2 below for the proton potential energy curves.
Figure 2.
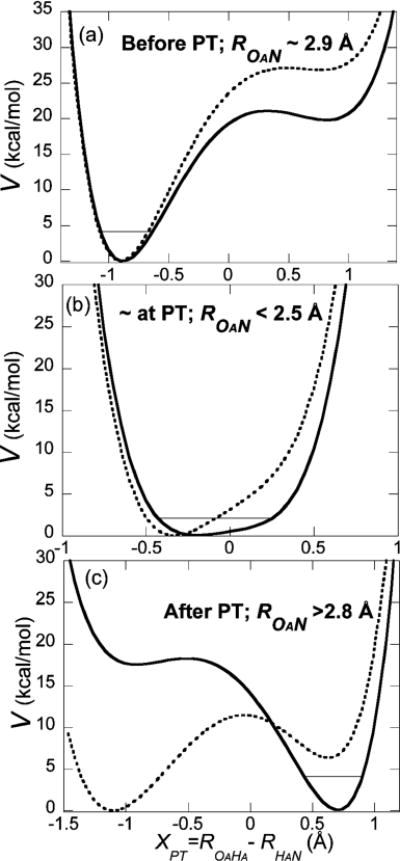
Proton potentials evaluated at three different time points along the fourth reaction trajectory: (a) before PT, (b) near the PT occurrence time tPT, and (c) after PT occurrence. Solid bold lines are proton potentials with interactions with the water solvent (not including any solvent self-energy), while for reference the dotted lines are the vacuum proton potentials obtained by deleting the solvent contributions. Thin lines indicate the quantum ground vibrational level for the proton stretch of the proton potentials with water solvent, provided for discussion. The minima of both sets of potentials are set to zero to place them on the same scale. The H-bond length value or range is indicated for each case. (The relative energies of the potential minima with solvent (including solvent self energy) are given as (a) 0, (b) −12.5, and (c) −76.9 kcal/mol.) Note that the exothermic character of the aqueous phase reaction only becomes visible in panel (c), after H-bond and aqueous solvent changes.
The no-recrossing character of the proton coordinate transition in Figure 1b is repeated in the majority of the 10 trajectories in SI Figure S3. But for a minority of four trajectories there, the initial stabilization is evidently insufficient and there is recrossing of a mild character, i.e. just after xPT reaches ∼1, it briefly drops to slightly below the xPT = 0 line. But quickly after this recrossing, the proton again reaches xPT ∼ 1 and is now successfully stabilized within the ion pair. Figure 1c shows that these slight recrossing events do not impact the overall behavior averaged over the 10 trajectories, and we continue to focus on the Trajectory 4 as our example trajectory before presenting averaged results. (Details of the ion pair stabilization, including the key water solvent motions involved, will be revisited in the following paper.58)
Since the proton stretch vibration is typically faster than other nuclear vibrations, activated PT reaction is effected via the average proton position following the slower rearrangement of other nuclei, that is, that of the H-bond mode and the solvent.23–28,73,74 The stated time scale separation is confirmed for the classical treatment of the proton coordinate here by the many xPT oscillations in the product within the period of H-bond compressions visible in Figure 1a and b. But a critical aspect of the present reaction is that it is barrierless, as will be seen explicitly in Figure 2 below, and is perforce more facile. One consequence of this is that there is a significant response of the heavier nuclear modes (e.g., the H-bond separation) and the water solvent to PT that primarily occurs after the PT occurrence.
The time scale separation leading to our ability to define a PT occurrence time has a useful consequence in that it allows an ensemble average of the trajectories referenced to the point of that PT occurrence, now discussed.
In order to present an ensemble picture for all ten reaction trajectories (in SI Figure S3), the time-dependent nuclear coordinates (cf. Figure 1b) are averaged over all these trajectories using a common reference time point, the PT occurrence time tPT defined below eq 3, i.e. when xPT = 0. All trajectories are synchronized at tPT by shifting each trajectory in time, such that t = 0 occurs when xPT = 0. The nuclear coordinates’ values for all trajectories are then averaged at every time point relative to tPT, before and after PT.
Figure 1c presents this average picture for the H-bond nuclear coordinates. The H-bond compression after the release of the OA−HA and OA⋯N constraints is evident, and inspection of SI Figure S3 shows that it is common to each trajectory, with PT occurring near the compression minimum. The xPT oscillations visible in Figure 1b have averaged out, but the initial effective stabilization of the ion pair, that is, lack of recrossing of the xPT = 0 transition line after the PT occurrence time tPT, is dominant in the averaging, as we have already pointed out. Finally, the OA⋯N H-bond vibration remains apparent, as is evident with the second minimum at ∼100–150 fs after PT.
3.2. Trajectory Analysis
In order to put these results into perspective, we now consider several key aspects of how the proton potential varies in a reaction trajectory and the important impact of the water solvent thereupon. Figure 2 displays proton potentials for three different time points along the fourth reaction trajectory, which are representative of before PT (at the Figure 1b trajectory’s starting point), during PT (near xPT ∼ 0), and after PT (where first reaches ∼2.8 Å after PT occurrence at ∼50 fs post PT). These potentials were evaluated via quantum chemistry calculations (B3LYP/6-311+G**) for the carbonic acid-nitrogen base pair at various OA-HA and HA-N separations, keeping all other nuclei fixed, with the surrounding water molecules treated as point charges (SCP/E charges: −0.8476 for OW and 0.4238 for HW). In order to elucidate the critical aqueous solvent effect on the proton potential, the potentials are calculated both with and without the presence of the water solvent point charges. We term the latter potential the vacuum proton potential and the former the proton potential with solvent. LJ parameters are not required for the present purposes: the van der Waals interactions with the proton-donor or proton-acceptor cancel out between the two potentials as the proton position is varied while the other nuclei are fixed; the van der Waals interactions with an H in an H-bond are negligible.75
In general, the H-bond is not linear, that is, the OA−HA direction does not coincide with the HA−N direction. Hence, the Figure 2 one-dimensional potentials are generated to best indicate the potential in the respective proton stretching direction: for the reactant complex, the Figure 2a potential was generated by moving the proton along the OA−HA direction, while in the product complex the Figure 2c potential is generated by moving the proton along the HA−N direction. However, the H-bond is linear for short H-bonds, such that the proton potential is fairly independent of which proton direction is chosen; the short H-bond case Figure 2b was generated by moving along the HA-N direction, even though its minimum is consistent with the reactant complex. The solid lines are the proton potentials in the field of the solvent water molecules, that is, the proton potential with solvent, while the dotted lines are the vacuum proton potentials. Both sets of potentials have their minimum set to zero to place them on the same scale.
The very considerable impact of the water solvent on the PT reaction is clearly evident in Figure 2. The asymmetry of the proton potentials including the aqueous solvent’s effect shifts from having the potential minimum near the carbonic acid’s OA before PT occurrence to a minimum near the nitrogen base’s N after PT, with an evident strong correlation with the proton dynamics seen in Figure 1. Water solvent stabilization of the PT-transferred carboxylate-protonated methylamine is clearly essential for the reaction: the vacuum PT is unfavorable without this extensive solvent stabilization of the contact ion pair product. It must be pointed out however that the Figure 2 potentials without the solvent interaction, but which have been established via the solvation and the H-bond compression evident in Figure 1 already suggest that the H-bond compression plays a major role in establishing, for example, the central barrierless potential in Figure 2b and a potential well for the product in Figure 2c. In the detailed investigation of the aqueous solvent effects in the following paper,58 we find that the major motion from reaction to proton transfer occurrence is the OA-N H-bond compression rather than motion in the solvent. Evidently there is little water solvent preorganization from the solvation already existing for the reactant pair that is required for this exothermic reaction: its necessity is obviated by the energetic driving force, and most of the solvent motion occurs after the formation of an incipient carboxylate anion-protonated methylamine base ion pair complex.
We have also included in Figure 2, for perspective, the quantum ground vibrational level for the proton stretch coordinate at various points in the reaction (i.e., a quantum description which would replace a classical proton trajectory description). These levels were calculated as in this group’s previous PT work.27–29,76 While we obviously do not present a full quantum treatment of the reaction, these levels would depict a quantum adiabatic PT reaction (rather than a quantum tunneling reaction)23–29,77 for the eq 1 PT, although of a barrierless, nonactivated type, consistent with H2CO3’s acid strength and the reaction’s ΔpKa difference, as anticipated in the Introduction.
However, the classical proton coordinate dynamics evident in Figure 1 indicates that there is proton vibrational excitation in the product compared to the reactant, which would not be consistent with adiabaticity in the sense of maintaining vibrational quantum number. We estimate that there is ∼11 kcal/mol in the product NH vibration; with estimated ground and first two excited NH vibrational levels in the product well of Figure 2c at 3.8, 10.7, and 16.2 kcal/mol above the potential minimum, this suggests that the first product vibrational level is excited in the PT reaction. Unfortunately, a fully quantum treatment for both protonic and other vibrations in the complex and the solvent would be required to deal accurately with this excitation and its decay, an aspect far beyond the capability of this first effort.
It is worthwhile pausing to note that the features emphasized in the preceding two paragraphs for the present exothermic PT reaction, vibrational excitation in the product and small requirement of solvent preorganization, with time, together with the subsequent, post-PT relaxation mentioned below, should also be central features of very exothermic excited electronic state, photoacid PT reactions.31
A key feature of the PT reaction, from either a classical or a quantum proton motion perspective, is a rapid shift in proton position at the time of PT occurrence. Figure 2b shows that near tPT, the potential with solvent is fairly symmetric and characterized by a short H-bond length , such that no barrier exists in the proton potential. This lack of a barrier allows the proton position to readily shift toward the product. For the classical proton motion involved in all the MD simulations of this paper, this proton shift is fast, following the slower H-bond motion. The proton becomes localized in the product H-bond complex at a larger ion pair H-bond separation, with attendant solvation by the polar water solvent, whose consequence is apparent in Figure 2. Further details of this stabilization, such as the timing and time scale of this solvation and the particular water molecules contributing to it, will be discussed in the following paper.58
3.3. Charge Characterization for Proton Transfer
We now characterize the electrostatic charges and their change during the PT reaction for key atomic sites in the complex (see Scheme 1): the carboxylic oxygens OA, OC, and the remaining carbonic acid oxygen Ona, the nitrogen base atoms N, HN, and of course the transferring proton HA. The evolution of these charges is of course connected to the water solvent-assisted formation of the ion pair from the neutral pair complex and to the evolving proton potentials in the reaction (cf. Figure 2).
We have obtained the atomic charges for these sites via a natural population analysis (NPA)78 during the course of the equilibration trajectory as well as each of the ten reaction trajectories. The averages of these NPA charges over these trajectories are displayed in Figure 3a as a function of time during the PT process. In order to highlight the ion pair formation, the time dependence of the total charges of the bicarbonate, methylamine and the transferring H during PT occurrence are shown in Figure 3b. The trajectory averaging is effected in a manner similar to that for Figure 1c. The equilibrium-averaged values of these charges are summarized in Table 2.
Figure 3.

(a) Trajectory-averaged NPA charges of the key atoms (HA, HN, N, OA, OC, and Ona) for the PT reaction in the HOCOOH⋯NH2CH3 H-bonded complex (see Scheme 1 for the atom labeling). t = 0 denotes the PT occurrence at xPT = 0. The trajectory-averaged normalized proton coordinate xPT (see Figure 1c) is also plotted versus time, right ordinate. The green dashed vertical line indicates when xPT first reaches 1. (b) Total charges of bicarbonate, methylamine, and the transferring H as a function of time.
Table 2.
Averaged NPA Charges of the Key Atoms (OA, Ona, OC, HA, N & HN) and the Net Charge of the Carbonic Acid/Bicarbonate Anion and the Methylamine/Protonated Methylamine Moieties before/after PTa
| atoms/molecules | charge (e) before PTb | charge (e) after PTb | charge difference (e) (after – before) | |
|---|---|---|---|---|
| OA | −0.73 | −0.83 | −0.10 | |
| Ona | −0.73 | −0.80 | −0.07 | |
| OC | −0.73 | −0.85 | −0.12 | |
| HA | 0.53 | 0.47 | −0.06 | |
| N | −0.89 | −0.74 | +0.15 | |
|
|
0.37 | 0.44 | +0.07 | |
| carbonic acid/bicarbonated | −0.08 | −0.93 | −0.85 | |
| methylamine/protonated methylamined | 0.09 | 0.91 | 0.82 |
Atom labeling is as in Scheme 1.
The charges before PT are obtained from an average over configurations from the equilibration trajectory, while those after PT are obtained from an average over configurations from reaction trajectories for t > 100 fs (t = 0 corresponds to PT occurrence).
The overbar indicates an overage over the two nitrogen hydrogens, both before and after PT. This number needs to be multiplied by 2 in order to arrive at the totals listed at the bottom of the table.
For the X/Y notation, X and Y are respectively the species before and after PT. Due to an averaging over a finite number of configurations, the carbonic acid/bicarbonate charges are not exactly equal and opposite of the methylamine/protonated methylamine.
An initial glance at Figure 3a indicates a distinct transition at t ∼ 5 fs, that is, slightly after the PT occurrence; this transition occurs when the normalized proton coordinate xPT (eq 3) first approaches its product value of 1 (green vertical line in Figure 3), consistent with the formation of the product ion pair. This transition is most pronounced for the acid carboxylate oxygens and the base nitrogen; it is less significant for the transferring proton HA, since this proton’s charge remains fairly constant, ending up at a slightly smaller value in the ion pair product (see also Table 2). (We will return to this important near constancy below.) The bicarbonate moiety’s increase in anionic character in the product (see Table 2) is evident in Figure 3b, reflecting the increased magnitude of the negative charges on its carboxylate oxygens OA and OC, whose near equality reflects resonance in the anion (see Figure 3a and Table 2). The noncarboxylic oxygen Ona exhibits a smaller increase in negative charge magnitude.
Turning to the base, the proton-accepting N’s hydrogens are also reasonably constant, with the (average of the two amine hydrogens) HN charge ending up slightly increased in the ion pair product. The final average HN charge becomes nearly equivalent to that of the transferring proton HA, since the latter is becoming the third hydrogen of the incipient NH3 group. HA remains slightly more positive than the average HN charge, because it is still polarized in the H-bond with the bicarbonate anion. The combination of the N charge becoming less negative and the slight increase in the two HN positive charges reflects the loss of electron density by the base. The base’s net charge change after PT to generate the protonated base, seen in Figure 3b and Table 2, involves the combination of this positive charge change with the ∼0.5e proton charge.
The Table 2 total charge values indicate a net charge change (acid’s loss and base’s gain) of ∼0.8. This includes the transferring proton HA charge during PT with its approximately constant value ∼ + 0.5e; the difference ∼0.3e is the net negative charge flow from the nitrogen base toward the incipient bicarbonate anion. That the increase of the bicarbonate moiety’s negative charge properly mirrors the increase of methylamine’s positive charge is especially clear in the time dependence displayed in Figure 3b. As will be seen in ref58., this evolution is strongly coupled to the solvation dynamics of the nearby water molecules surrounding the H-bonded ion pair complex.
It is important to point out that this detailed charge flow picture for PT in the acid–base complex is consistent with the Mulliken charge transfer picture for PT.23–25,73,79–82 In that picture, electronically adiabatic PT in an H-bond is primarily viewed as an adiabatic electron transfer from the base to the acid very strongly concerted with H transfer from the acid to the base (hence the HA charge close to 0.5); as is appropriate for this strong H-bond, the process is characterized by a very large electronic coupling between the two VB states associated with the reactant and product forms in eq 1.23–25,73 We will present elsewhere a detailed electronic orbital analysis which demonstrates that this charge transfer is from a nonbonding orbital of the methylamine base to an antibonding orbital of the carbonic acid.
4. CONCLUDING REMARKS
We have presented here a study, focused largely on the evolving acid and base coordinates and charges, of the proton transfer (PT) from carbonic acid H2CO3 to the methylamine base CH3NH2 in a contact hydrogen-bonded pair H2CO3⋯CH3NH2 in aqueous solution using Car–Parrinello (CP MD) molecular dynamics simulation. The observed times for PT occur after the trajectory start from an intact acid–base H-bonded complex varies from 33 to 75 fs over the ten trajectories examined. The occurrence of the PT is strongly correlated with compression of the H-bond in the acid–base complex, and the contact ion pair product is strongly stabilized by the aqueous solvent, as shown by calculated proton potential energies in the presence of the water solvent. The PT event itself is extremely rapid and requires only ∼1 fs. The extremely short PT times (33–75 fs) associated with the PT process observed here are consistent with a markedly downhill in free energy process, that is, a large positive ΔpKa for the carbonic acid–methylamine base pair. In particular, it is consistent with the current assessment of the pKa (3.49 ± 0.05) for the intact carbonic acid H2CO3.16,18 These results support the proposition that carbonic acid is a potentially important proton donor in, for example, human blood and in the oceans,18 an issue raised in the Introduction.
The time-dependent analysis of the charges of the atoms of the complex, which confirms the formation of a contact ion pair due to the PT reaction, also demonstrates carboxylate group resonance within the carboxylate group of the bicarbonate ion in that ion pair. The PT is shown to occur via charge transfer from the methylamine base to carbonic acid without any change in the transferring proton’s charge, which remains approximately midway between that of an H atom and that of H+; these results support a Mulliken CT picture for the reaction.23–25,73,79–82
Further aspects of the PT reaction, including discussion of reaction coordinates and further elaboration of the role of the water solvent in the reaction, in particular the participation of water solvent dynamics and local hydration stabilization, will be presented in the following paper.58
As with any simulation methodology, especially one involving electronic structure aspects, it is useful to also consider other results in addition to those in the present work carried out in Boulder. In particular, results of QM/MM simulations with the MP2/dzv level of theory for the electronic structure of the H-bonded complex carried out in the Miller group will be presented separately elsewhere.
Supplementary Material
Acknowledgments
This work has been supported by the NIH Grant PO 1000125420 (J.T.H., E.P.). This work utilized the Janus supercomputer, which is supported by the National Science Foundation (Award Number CNS-0821794) and the University of Colorado Boulder. The Janus supercomputer is a joint effort of the University of Colorado Boulder, the University of Colorado Denver, and the National Center for Atmospheric Research. Janus is operated by the University of Colorado Boulder.
Footnotes
Supporting Information
The Supporting Information is available free of charge on the ACS Publications website at DOI: 10.1021/acs.jpcb.5b12742.
Three sections: (i) estimation of the minimum equilibration time of the solvent water molecules around the acid–base pair, (ii) geometry coordinates for all 10 reaction trajectories, and (iii) trajectory illustrations of the impact of somewhat different initial conditions for the acid–base pair and of fixed NVE simulations rather than the NVT simulations employed throughout (PDF)
Notes
The authors declare no competing financial interest.
References
- 1.Geers C, Gros G. Carbon Dioxide Transport and Carbonic Anhydrase in Blood and Muscle. Muscle Physiol Rev. 2000;80:681–715. doi: 10.1152/physrev.2000.80.2.681. [DOI] [PubMed] [Google Scholar]
- 2.Vaughan-Jones RD, Spitzer KW, Swietach P. Spatial Aspects of Intracellular pH Regulation in Heart Muscle. Prog Biophys Mol Biol. 2006;90:207–224. doi: 10.1016/j.pbiomolbio.2005.06.004. [DOI] [PubMed] [Google Scholar]
- 3.Junge W, McLaughlin S. The role of fixed mobile buffers in the kinetics of proton movement. Biochim Biophys Acta Bioenerg. 1987;890:1–5. doi: 10.1016/0005-2728(87)90061-2. [DOI] [PubMed] [Google Scholar]
- 4.Scanlon VC, Sanders T. Essentials of Anatomy and Physiology. MacLennan & Petty; Sydney: 2003. [Google Scholar]
- 5.Thibodeau GA, Patton KT. Anatomy and Physiology. 5th. Mosby Elsevier; St. Louis, MO: 2003. [Google Scholar]
- 6.Millero FJ. The Marine Inorganic Carbon Cycle. Chem Rev. 2007;107:308–341. doi: 10.1021/cr0503557. [DOI] [PubMed] [Google Scholar]
- 7.Eigen M, Kustin K, Maass G. Die Geschwindigkeit der Hydratation von SO-Lösung. Z Phys Chem. 1961;30:130. [Google Scholar]
- 8.Eigen M. Protonenübertragung, Säure-Base-Katalyse und Enzymatische Hydrolyse. Teil I: Elementarvorgänge. Angew Chem. 1963;75:489–508. [Google Scholar]
- 9.Eigen M. Proton Transfer, Acid-Base Catalysis, and Enzymatic Hydrolysis. Part I: Elementary Processes. Angew Chem, Int Ed Engl. 1964;3:1–19. [Google Scholar]
- 10.Nguyen MT, Raspoet G, Vanquickenborne LG, Van Duijnen PT. How Many Water Molecules Are Actively Involved in the Neutral Hydration of Carbon Dioxide? J Phys Chem A. 1997;101:7379–7388. [Google Scholar]
- 11.Loerting T, Tautermann C, Kroemer RT, Kohl I, Hallbrucker A, Mayer E, Liedl KR. On the Surprising Kinetic Stability of Carbonic Acid (H2CO3) Angew Chem Int Ed. 2000;39:891–894. doi: 10.1002/(sici)1521-3773(20000303)39:5<891::aid-anie891>3.0.co;2-e. [DOI] [PubMed] [Google Scholar]
- 12.Tautermann CS, Voegele AF, Loerting T, Kohl I, Hallbrucker A, Mayer E, Liedl KR. Towards the Experimental Decomposition Rate of Carbonic Acid (H2CO3) in Aqueous Solution. Chem - Eur J. 2002;8:66–73. doi: 10.1002/1521-3765(20020104)8:1<66::aid-chem66>3.0.co;2-f. [DOI] [PubMed] [Google Scholar]
- 13.Lewis M, Glaser R. Synergism of Catalysis Reaction Center Rehybridization. A Novel Mode of Catalysis in the Hydrolysis of Carbon Dioxide. J Phys Chem A. 2003;107:6814–6818. [Google Scholar]
- 14.Kumar PP, Kalinichev AG, Kirkpatrick RJ. Dissociation of Carbonic Acid: Gas Phase Energetics Mechanism from ab initio Metadynamics Simulations. J Chem Phys. 2007;126:204315. doi: 10.1063/1.2741552. [DOI] [PubMed] [Google Scholar]
- 15.Nguyen MT, Matus MH, Jackson VE, Ngan VT, Rustad JR, Dixon DA. Mechanism of the Hydration of Carbon Dioxide: Direct Participation of H2O versus Microsolvation. J Phys Chem A. 2008;112:10386–10398. doi: 10.1021/jp804715j. [DOI] [PubMed] [Google Scholar]
- 16.Adamczyk K, Prémont-Schwarz M, Pines D, Pines E, Nibbering ETJ. Real-time Observation of Carbonic Acid Formation in Aqueous Solution. Science. 2009;326:1690–1694. doi: 10.1126/science.1180060. [DOI] [PubMed] [Google Scholar]
- 17.Loerting T, Bernard J. Aqueous Carbonic Acid (H2CO3) ChemPhysChem. 2010;11:2305–2309. doi: 10.1002/cphc.201000220. [DOI] [PubMed] [Google Scholar]
- 18.Pines D, Ditkovich J, Mukra T, Miller Y, Kiefer PM, Daschakraborty S, Hynes JT, Pines E. How Strong is Carbonic Acid. J Phys Chem B. 2016 doi: 10.1021/acs.jpcb.5b12428. [DOI] [PMC free article] [PubMed] [Google Scholar]
- 19.Stumm W, Morgan JJ, editors. Aquatic Chemistry: Chemical Equilibria and Rates in Natural Waters. 3rd. Wiley; New York: 1995. An apparent pKa value (pKapp) for H2CO3 of 6.35 ± 0.02 at 25 °C, which corresponds to the equilibrium constant involving also aqueous CO2 in equilibrium with H2CO3, Kapp = [H+] [HCO3−]/CO2, has been routinely reported in chemistry textbooks. [Google Scholar]
- 20.Kumar PP, Kalinichev AG, Kirkpatrick RJ. Hydrogen-Bonding Structure Dynamics of Aqueous Carbonate Species from Car-Parrinello Molecular Dynamics Simulations. J Phys Chem B. 2009;113:794–802. doi: 10.1021/jp809069g. [DOI] [PubMed] [Google Scholar]
- 21.Galib M, Hanna G. Mechanistic Insights into the Dissociation Decomposition of Carbonic Acid in Water via the Hydroxide Route: An Ab Initio Metadynamics Study. J Phys Chem B. 2011;115:15024–15035. doi: 10.1021/jp207752m. [DOI] [PubMed] [Google Scholar]
- 22.Stirling A, Papai I. H2CO3 Forms via HCO3‐ in Water. J Phys Chem B. 2010;114:16854–16859. doi: 10.1021/jp1099909. [DOI] [PubMed] [Google Scholar]
- 23.Ando K, Hynes JT. Molecular Mechanism of HCl Acid Ionization in Water. Ab initio Potential Energy Surfaces and Monte Carlo Simulations. J Phys Chem B. 1997;101:10464–10478. [Google Scholar]
- 24.Ando K, Hynes JT. HCl Acid Ionization in Water: A Theoretical Molecular Modelling. J Mol Liq. 1995;64:25–37. [Google Scholar]
- 25.Ando K, Hynes JT. Molecular Mechanism of HF Acid Ionization in Water: an Electronic Structure Monte Carlo Study. J Phys Chem A. 1999;103:10398–10408. [Google Scholar]
- 26.Juanos i Timoneda J, Hynes JT. Nonequilibrium Free Energy Surfaces for Hydrogen-Bonded Proton Transfer Complexes in Solution. J Phys Chem. 1991;95:10431–10442. [Google Scholar]
- 27.Kiefer PM, Hynes JT. Nonlinear Free Energy Relations for Adiabatic Proton Transfer Reactions in a Polar Environment. I. Fixed Proton Donor-Acceptor Distance. J Phys Chem A. 2002;106:1834–1849. [Google Scholar]
- 28.Kiefer PM, Hynes JT. Nonlinear Free Energy Relations for Adiabatic Proton Transfer Reactions in a Polar Environment. II. Inclusion of the Hydrogen Bond Vibration. J Phys Chem A. 2002;106:1850–1861. [Google Scholar]
- 29.Kiefer PM, Hynes JT. Theoretical Aspects of Proton Transfer Reactions in a Polar Environment. In: Hynes JT, Klinman JP, Limbach HH, Schowen RL, editors. Hydrogen-Transfer Reactions. Vol. 1. Wiley-VCH Verlag GmbH & Co. KGaA; Weinheim, Germany: 2007. pp. 303–348. [Google Scholar]
- 30.Activated PT reactions are the primary focus of ref74. Other modern work, including traditional views for PT that use an equilibrium solvation treatment for the environment, are referred to in refs29 and 74
- 31.Pines E, Pines D. Proton Dissociation and Solute-Solvent Interactions Following Electronic Excitation and Photoacids. In: Bakker H, Elsaesser T, editors. Ultrafast hydrogen bonding dynamics and proton transfer processes in the condenced phase. Kluwer Academic Publishers; Boston: 2003. pp. 155–184. [Google Scholar]
- 32.Pines E. UV-Visible spectra and photoacidity of phenols, naphthols and pyrenols. In: Rappoport Z, editor. Chemistry of phenols. Patai Series; Wiley; New York: 2003. pp. 491–529. [Google Scholar]
- 33.Pines D, Pines E. Solvent Assisted Photoacidity. In: Hynes JT, Klinman JP, Limbach HH, Schowen RL, editors. Hydrogen-Transfer Reactions. Vol. 1. Wiley-VCH Verlag GmbH & Co. KGaA; Weinheim, Germany: 2007. pp. 377–415. [Google Scholar]
- 34.Perrin DD. Dissociation Constants of Organic Bases in Aqueous Solution. Vol. 1965. Butterworths; London: 1972. Supplement. [Google Scholar]
- 35.Serjeant EP, Dempsey B. Ionization Constants of Organic Acids in Aqueous Solution. Pergamon; Oxford: 1979. [Google Scholar]
- 36.Grote RF, Hynes JT. The Stable States Picture of Chemical Reactions.II. Rate Constants for Condensed Gas Phase Reaction Models. J Chem Phys. 1980;73:2715–2732. [Google Scholar]
- 37.Mohammed OF, Pines D, Nibbering ETJ, Pines E. Base-Induced Solvent Switches in Acid-Base Reactions. Angew Chem Int Ed. 2007;46:1458–1461. doi: 10.1002/anie.200603383. [DOI] [PubMed] [Google Scholar]
- 38.Car R, Parrinello M. Unified Approach for Molecular Dynamics Density-Functional Theory. Phys Rev Lett. 1985;55:2471–2474. doi: 10.1103/PhysRevLett.55.2471. [DOI] [PubMed] [Google Scholar]
- 39.Becke AD. Density-Functional Exchange-Energy Approximation with Correct Asymptotic Behavior. Phys Rev A: At, Mol, Opt Phys. 1988;38:3098–3100. doi: 10.1103/physreva.38.3098. [DOI] [PubMed] [Google Scholar]
- 40.Lee C, Yang W, Parr RG. Development of the Colle-Salvetti Correlation-Energy Formula into a Functional of the Electron Density. Phys Rev B: Condens Matter Mater Phys. 1988;37:785–789. doi: 10.1103/physrevb.37.785. [DOI] [PubMed] [Google Scholar]
- 41.Schmidt MW, Baldridge KK, Boatz JA, Elbert ST, Gordon MS, Jensen JH, Koseki S, Matsunaga N, Nguyen KA, Su SJ, et al. General Atomic and Molecular Electronic Structure sSystem. J Comput Chem. 1993;14:1347–1363. [Google Scholar]
- 42.van der Spoel D, Lindahl E, Hess B, Groenhof G, Mark AE, Berendsen HJC. GROMACS: Fast Flexible Free. J Comput Chem. 2005;26:1701–1718. doi: 10.1002/jcc.20291. [DOI] [PubMed] [Google Scholar]
- 43.Jensen F. Introduction to Computational Chemistry. 2nd. John Wiley & Sons; Chichester, U.K: 2007. [Google Scholar]
- 44.Rizzo RC, Jorgensen WL. OPLS All-atom Model for Amines: Resolution of the Amine Hydration Problem. J Am Chem Soc. 1999;121:4827–4836. [Google Scholar]
- 45.Zeebe RE. On the molecular diffusion coefficient of dissolved CO2, HCO3−, and CO32‑and their dependence on isotopic mass. Geochim Cosmochim Acta. 2011;75:2483–2498. The LJ parameters for the oxygen atoms of bicarbonate and carbonate in this study are identical. Definitely, this will not be the case for the LJ parameters for carbonic acid. Classical simulations with these parameters, however, provide a reasonable starting configuration for the CP MD simulations, as indicated with Figure S1 of the Supporting Information. [Google Scholar]
- 46.Berendsen HJC, Grigera JR, Straatsma TP. The Missing Term in Effective Pair Potentials. J Phys Chem. 1987;91:6269–6271. [Google Scholar]
- 47.CPMD, Copyright IBM Corp. 1990–2006, Copyright MPI für Festkörperforschung Stuttgart, 1997–2001
- 48.Batra IP. Atomic Structure of the Si(001)-(2 × 1) Surface. Phys Rev B: Condens Matter Mater Phys. 1990;41:5048–5054. doi: 10.1103/physrevb.41.5048. [DOI] [PubMed] [Google Scholar]
- 49.Laasonen K, Car R, Lee C, Vanderbilt D. Implementation of Ultrasoft Pseudopotentials in ab initio Molecular Dynamics. Phys Rev B: Condens Matter Mater Phys. 1991;43:6796–6799. doi: 10.1103/physrevb.43.6796. [DOI] [PubMed] [Google Scholar]
- 50.Laasonen K, Pasquarello A, Car R, Lee C, Vanderbilt D. Car-Parrinello Molecular Dynamics with Vanderbilt Ultrasoft Pseudopotentials. Phys Rev B: Condens Matter Mater Phys. 1993;47:10142–10153. doi: 10.1103/physrevb.47.10142. [DOI] [PubMed] [Google Scholar]
- 51.Galib M, Hanna G. The Role of Hydrogen Bonding in the Decomposition of H2CO3 in Water: Mechanistic Insights from Ab Initio Metadynamics Studies of Aqueous Clusters. J Phys Chem B. 2014;118:5983–5993. doi: 10.1021/jp5029195. [DOI] [PubMed] [Google Scholar]
- 52.Galib M, Hanna G. Mechanistic Insights into the Dissociation Decomposition of Carbonic Acid in Water via the Hydroxide Route: An Ab Initio Metadynamics Study. J Phys Chem B. 2011;115:15024–15035. doi: 10.1021/jp207752m. [DOI] [PubMed] [Google Scholar]
- 53.Tang E, Di Tommaso D, de Leeuw NH. Hydrogen Transfer Hydration Properties of HnPO43−n (n = 0−3) in Water Studied by First Principles Molecular Dynamics Simulations. J Chem Phys. 2009;130:234502. doi: 10.1063/1.3143952. [DOI] [PubMed] [Google Scholar]
- 54.Grimme SJ. Accurate Description of van der Waals Complexes by Density Functional Theory Including Empirical Corrections. J Comput Chem. 2004;25:1463–1473. doi: 10.1002/jcc.20078. [DOI] [PubMed] [Google Scholar]
- 55.Zimmerli U, Parrinello M, Koumoutsakos P. Dispersion Corrections to Density Functionals For water Aromatic Interactions. J Chem Phys. 2004;120:2693–2699. doi: 10.1063/1.1637034. [DOI] [PubMed] [Google Scholar]
- 56.The above DFT scheme with van der Waals corrections (ref54) provides water solvent structure and dynamics that compare reasonably well to experimental results at the given temperature (ref58). The van der Waals corrections, in particular, obviate the requirement to simulate at an elevated temperature (ref69 – 72)
- 57.Lee HS, Tuckerman ME. Dynamical Properties of Liquid Water from ab initio Molecular Dynamics Performed in the Complete Basis Set Limit. J Chem Phys. 2007;126:164501. doi: 10.1063/1.2718521. [DOI] [PubMed] [Google Scholar]
- 58.Daschakraborty S, Kiefer PM, Miller Y, Motero Y, Pines D, Pines E, Hynes JT. Direct Proton Transfer from Carbonic Acid to a Strong Base in Aqueous Solution II: Solvent Role in Reaction Path. J Phys Chem B. 2016 doi: 10.1021/acs.jpcb.5b12744. [DOI] [PMC free article] [PubMed] [Google Scholar]
- 59.Laage D, Hynes JT. On the Molecular Mechanism of Water Reorientation. J Phys Chem B. 2008;112:14230–14242. doi: 10.1021/jp805217u. [DOI] [PubMed] [Google Scholar]
- 60.Laage D, Hynes JT. Echoes of a Salty Exchange. Proc Natl Acad Sci USA. 2009;106:967–968. doi: 10.1073/pnas.0812306106. [DOI] [PMC free article] [PubMed] [Google Scholar]
- 61.Jimenez R, Fleming GR, Kumar PV, Maroncelli M. Femtosecond Solvation Dynamics of Water. Nature. 1994;369:471–473. [Google Scholar]
- 62.Rey R, Hynes JT. Solvation Dynamics in Liquid Water. 1. Ultrafast Energy Fluxes. J Phys Chem B. 2015;119:7558–7570. doi: 10.1021/jp5113922. [DOI] [PubMed] [Google Scholar]
- 63.Roy S, Bagchi B. Solvation Dynamics in Liquid Water. A Novel Interplay Between Librational Diffusive Modes. J Chem Phys. 1993;99:9938–9943. [Google Scholar]
- 64.Jarzęba W, Walker GC, Johnson AE, Kahlow MA, Barbara PF. Femtosecond Microscopic Solvation Dynamics of Aqueous Solutions. J Phys Chem. 1988;92:7039–7041. [Google Scholar]
- 65.Petersen J, Møller KB, Rey R, Hynes JT. Ultrafast Librational Relaxation of H2O in Liquid Water. J Phys Chem B. 2013;117:4541–4552. doi: 10.1021/jp308648u. [DOI] [PubMed] [Google Scholar]
- 66.Grossman JC, Schwegler E, Draeger EW, Gygi F, Galli G. Towards an Assessment of the Accuracy of Density Functional Theory for First Principles Simulations of Water. J Chem Phys. 2004;120:300–311. doi: 10.1063/1.1630560. [DOI] [PubMed] [Google Scholar]
- 67.Lin I-C, Seitsonen AP, Tavernelli I, Rothlisberger U. Structure Dynamics of Liquid Water from ab Initio Molecular Dynamics-Comparison of BLYP PBE and revPBE Density Functionals with without van der Waals Corrections. J Chem Theory Comput. 2012;8:3902–3910. doi: 10.1021/ct3001848. [DOI] [PubMed] [Google Scholar]
- 68.Bell RP. The Proton in Chemistry. 2nd. Cornell University Press; Ithaca, NY: 1973. [Google Scholar]
- 69.Bianco R, Wang S, Hynes JT. Theoretical Study of the Dissociation of Nitric Acid HNO3 at a Model Aqueous Surface. J Phys Chem A. 2007;111:11033–11042. doi: 10.1021/jp075054a. [DOI] [PubMed] [Google Scholar]
- 70.Bianco R, Wang S, Hynes JT. Infrared Signatures of HNO3 NO3− at a Model Aqueous Surface. A Theoretical Study. J Phys Chem A. 2008;112:9467–9476. doi: 10.1021/jp802563g. [DOI] [PubMed] [Google Scholar]
- 71.Wang S, Bianco R, Hynes JT. Nitric Acid Dissociation at an Aqueous Interface: Occurrence Mechanism. Isr J Chem. 2009;49:251–259. [Google Scholar]
- 72.Wang S, Bianco R, Hynes JT. Depth-Dependent Dissociation of Nitric Acid at an Aqueous Surface: Car-Parrinello Dynamics. J Phys Chem A. 2009;113:1295–1307. doi: 10.1021/jp808533y. [DOI] [PubMed] [Google Scholar]
- 73.Juanos i Timoneda J, Hynes JT. Nonequilibrium Free Energy Surfaces for Hydrogen-Bonded Proton Transfer Complexes in Solution. J Phys Chem. 1991;95:10431–10442. [Google Scholar]
- 74.Hynes JT, Klinman JP, Limbach HH, Schowen RL, editors. Hydrogen-Transfer Reactions. Wiley-VCH Verlag GmbH & Co. KGaA; Weinheim, Germany: 2007. [Google Scholar]
- 75.In the classical limit, the VDW interaction for H atoms are usually set to zero. (See, for example, ref46 for the SPC/E model of water.)
- 76.Kiefer P, Hynes JT. Proton Transfer Reactions and Hydrogen Bonding in Solution. In: Bakker H, Elsaesser T, editors. Ultrafast hydrogen bonding dynamics and proton transfer processes in the condensed phase. Kluwer Academic Publishers; Boston: 2003. pp. 73–92. [Google Scholar]
- 77.Thompson WH, Hynes JT. A Model Study of the Acid-Base Proton Transfer Reaction of the ClH⋯OH2 Pair in Low Polarity Solvents. J Phys Chem A. 2001;105:2582–2590. [Google Scholar]
- 78.Reed AE, Weinstock RB, Weinhold F. Natural Population Analysis. J Chem Phys. 1985;83:735–746. [Google Scholar]
- 79.Thompson WH, Hynes JT. Frequency Shifts in the Hydrogen-Bonded OH Stretch in Water-Halide Clusters. The Importance of Charge Transfer. J Am Chem Soc. 2000;122:6278–6286. [Google Scholar]
- 80.Mulliken RS. Molecular Compounds and their Spectra. III. The Interaction of Electron Donors and Acceptors. J Phys Chem. 1952;56:801–822. [Google Scholar]
- 81.Mulliken RS, Person WB. Molecular Complexes. Wiley; New York: 1969. [Google Scholar]
- 82.Ratajczak H. Charge-Transfer Properties of the Hydrogen Bond. I. Theory of the Enhancement of Dipole Moment of Hydrogen-Bonded Systems. J Phys Chem. 1972;76:3000–3004. [Google Scholar]
Associated Data
This section collects any data citations, data availability statements, or supplementary materials included in this article.