

Abstract

The functionalization of gold nanoparticles with DNA has been studied extensively in solution; however, these ensemble measurements do not reveal particle-to-particle differences. Here we study the functionalization of gold nanorods with thiolated single-stranded DNA (ssDNA) at the single-particle level. We exploit the sensitivity of the plasmon resonance to the local refractive index to study the functionalization in real time using single-particle spectroscopy. We find particle-to-particle variations of the plasmon shift that are attributed to the particle size distribution and variations in ssDNA coverage. We find that the ssDNA coverage varies by ∼10% from particle to particle, beyond the expected variation due to Poisson statistics. Surprisingly, we find binding rates that differ from particle to particle by an order of magnitude, even though the buffer conditions are identical. We ascribe this heterogeneity to a distribution of activation energies caused by particle-to-particle variations in effective surface charge. These results yield insight into the kinetics of biofunctionalization at the single particle level and highlight that significant kinetic heterogeneity has to be taken into account in applications of functional particles. The presented methodology is easily extended to any nanoparticle coating and can be used to optimize functionalization protocols.
Introduction
Hybrid nanostructures such as biofunctionalized nanoparticles have recently emerged as versatile and programmable nanomaterials for various applications. Functionalization of nanoparticles is usually achieved using the well-known thiol–gold chemistry1 where functional probes are provided with a thiol group at one end. Functionalization with antibodies,2−4 peptides,5 and aptamers6−8 allows metal nanoparticles to be used as biosensors. Also, the functionalization with single-stranded DNA has received considerable attention9−18 driven by anticipated applications in drug delivery,19 gene regulation,20 plasmon-induced PCR,21 and aptamer-based sensing.22,23 Moreover, ssDNA-functionalized nanoparticles offer a versatile platform to study multivalent interactions and crystal formation and allow for the straightforward tuning of affinity by modulating the number of strands and their complementarity.24−26
The functionality of the hybrid nanoparticles depends on the density of functional probes on the surface of the particle. Optimization of functionalization protocols has therefore received considerable attention with the aim to understand and optimize the coating density. In the case of ssDNA functionalization, dense coatings of thiolated ssDNA on gold nanoparticles were conventionally achieved using the so-called salt-aging method,9−15 in which the electrostatic repulsion due to the negative charges on the gold particles and the ssDNA is gradually reduced by stepwise addition of salt over 1 or 2 days. Later it was shown that this process can be accelerated by orders of magnitude by reducing the pH of the employed buffer.16−18,27,28
Since then, several studies addressed the functionalization of gold nanoparticles with ssDNA. These studies have yielded insight into the effects of salt concentration,29−33 buffer pH,28,32 ssDNA sequence,17,27,32−34 and nanoparticle size18,35 on the kinetics of functionalization. These studies monitored the progress of the functionalization by probing the fluorescence of labeled ssDNA16−18,28,32,33 or the shift of the plasmon resonance36 on ensembles of nanoparticles. Particle-to-particle differences remain hidden in such ensemble studies because they are averaged out. However, such particle-to-particle heterogeneity can have a profound influence in applications of the particles e.g. as biosensors because the sensor response may differ between individual particles.
Here we employ single-particle spectroscopy to study ssDNA functionalization by probing shifts of the plasmon resonance of individual gold nanorods over time. Probing plasmon shifts on hundreds of individual particles simultaneously in a wide-field optical microscope gives access to heterogeneity that has remained hidden in previous studies. We indeed find strong particle-to-particle variations in the end-point plasmon shift, which we attribute to the distribution of particle sizes present in any preparation of nanoparticles and to the variation in nanoparticle coverage with ssDNA. Surprisingly, we find unexpectedly large particle-to-particle variations in the rate constant for ssDNA binding, even under identical chemical conditions. We propose that this heterogeneity originates from particle-to-particle differences in surface charge density. The heterogeneity we find should be taken into account when optimizing particle coating protocols and indicates that statistical analysis of single-particle response is crucial.
The collective oscillation of conduction electrons, the so-called plasmon, induces wavelength-dependent light absorption and scattering and generates an enhanced local field in close vicinity of the nanoparticle. The frequency of the plasmon resonance depends not only on the size, shape, and material of the particle but also on the refractive index around the particle. The magnitude of plasmon shift depends on the strength of the interaction between the particle plasmon and a nearby molecule and scales with the contrast of refractive index between the molecule and the immersion medium and the local electric field intensity integrated over the molecule that binds. Therefore, plasmonic nanoparticles enable detection of ssDNA binding to the surface of the particle by probing time-dependent plasmon resonance shifts.
To probe these plasmon shifts, we immobilized the gold nanorods on a glass coverslip which was embedded into a flow cell that was mounted in a wide-field optical microscope. A simplified scheme of our dark-field imaging setup can be found in Figure 1a. For spectroscopic measurements we illuminated the sample with a white-light source, and spectra of individual particles were recorded by wide-field hyperspectral microscopy (see Supporting Information). For time-dependent measurements we used a narrowband superluminescent diode (SLD) for illumination. Figure 1b then shows the field of view of a typical sample, where diffraction-limited spots represent either single nanorods or sometimes clusters of particles. Each spot exhibits a different scattered intensity caused by heterogeneity in particle volume and aspect ratio and by a different orientation of each particle in the partly polarized evanescent field. We are interested in single nanoparticles of which spectra are characterized by a single Lorentzian lineshape and a well-defined linewidth (Figure 1c). Clusters can be distinguished from single nanorods based on their non-Lorentzian spectral profile and broadened linewidth and are discarded from further analysis (see Supporting Information).
Figure 1.

(a) Scheme of experimental setup: a coverslip with immobilized gold nanorods is mounted in a flow cell. Using prism-coupled total-internal reflection microscopy, the scattered light from the nanorods is collected by a water immersive objective and recorded onto an EMCCD camera. (b) A typical field of view; each diffraction-limited spot represents a single nanorod or sometimes a cluster. (c) A few typical examples of spectra of single nanorods measured by hyperspectral microscopy. The inset shows the distribution of measured plasmon linewidths of 110 ± 40 meV.
Results: End-Point Plasmon Shifts
We measured plasmon shifts of single particles in response to binding of thiolated ssDNA (50 nucleotides) as a function of pH for pH = 1.7, 3, 5, 7, and 9 and two different concentrations of additional NaCl of 0 and 1 M added to the citric acid buffer. We used incubation times of 1 h for pH 1.7 and 3 and 3 h for pH 5, 7, and 9. Spectra of individual particles and their corresponding plasmon shifts were recorded in the same buffer before and after ssDNA functionalization. In Figure 2a we show two measured distributions of plasmon shifts for pH 1.7 and 5, and Figure 2b summarizes the obtained plasmon shifts as a function of buffer pH for two added NaCl concentrations.
Figure 2.

(a) Two histograms of the single-particle plasmon shifts measured in a citric acid buffer at pH 1.7 and 5 with 1 M of additional NaCl. (b) Behavior as a function of pH. The points and error bars correspond to the mean and the standard deviation of the measured distribution, respectively.
We observe that for pH 5, 7, and 9 for both added NaCl concentrations the plasmon peaks show only small shifts (ΔSP < 5 nm) even after 3 h of ssDNA incubation. This suggests that the ssDNA binding is inefficient under these conditions resulting in a low coverage and therefore small plasmon shifts. At reduced pH we observe significantly larger plasmon shifts up to ΔSP = 15.5 ± 2.7 nm for pH 1.7 in combination with 1 M added NaCl.
The observed behavior can be explained by considering the effective charges of ssDNA and gold nanorods and their modulation as a function of buffer pH. The citrate present in the citric acid buffer coats the surface of the gold nanoparticles37 with an estimated average surface coverage of approximately 45%37 and provides the particles with a negative zeta-potential.38 The acid dissociation constants of citrate are pKa = 3.14, 4.77, and 6.40,39 implying that the citrate becomes protonated in the lower pH range we employ. The ssDNA, on the other hand, consists of a sugar–phosphate backbone (pKa ≈ 1.440) and bases: adenine (A) with pKa ≈ 4.1, cytosine (C) with pKa ≈ 4.4, guanine (G) with pKa ≈ 3.2, and thymine (T) with pKa ≈ 9.9.41 The negative charge on ssDNA is mainly determined by its sugar–phosphate backbone which is deprotonated in the whole range of used pH. In the lower pH range the backbone is partially protonated decreasing the effective charge of ssDNA.
These considerations imply an improved efficiency of ssDNA coating at low pH due to reduced electrostatic repulsion between the citrate-coated nanoparticles and ssDNA. However, even weak repulsion between solution-phase and surface-bound ssDNA will reduce the maximum achievable surface density. This intermolecular electrostatic repulsion can be partly alleviated further by adding 1 M of NaCl into the citric acid buffer, resulting in a Debye length of 0.30 nm. This is confirmed in the data, where we consistently observe larger plasmon shifts when 1 M salt is added. The ionic strength and corresponding Debye length as functions of pH are given in the Supporting Information (Figure S2). This modulation of the mean ssDNA coverage due to reduced electrostatic repulsion is in agreement with previously published ensemble-averaged results.28−33
In addition to the mean plasmon shift, single-particle spectroscopy yields the width of the distribution caused by heterogeneities. Histograms in Figure 2a show the full distribution of plasmon shifts measured for all particles in the field of view for pH 5 and pH 1.7. In both cases we observe a broad distribution of end-point plasmon shifts which can be caused by several mechanisms: (I) the dispersion of aspect ratios present in any preparation of gold nanorods,42 (II) the dispersion of particle volumes present in the sample, or (III) particle-to-particle variations in the ssDNA coverage.
We first explore mechanism I—the dispersion of aspect ratios present in our sample of nanorods. In Figure 3a, we show the correlation between the measured plasmon wavelength and the corresponding plasmon shift induced by binding of ssDNA at pH 1.7. We find a positive correlation between the aspect ratio and the plasmon shift, suggesting a higher sensitivity to local refractive index for longer particles. This increase in sensitivity for increasing aspect ratios has indeed been predicted in the electrostatic approximation43 and was verified by comparison to numerical simulations.44 The difference in sensitivity we find between short and long aspect ratios is in good agreement with calculations using a core–shell Mie-Gans model45 (see Supporting Information).
Figure 3.

(a) Functionalization-induced plasmon shifts of individual nanoparticles as a function of plasmon wavelength of individual nanorods. Data shown in this figure were recorded for buffer pH = 1.7 and 1 M of addition NaCl. The black solid line represent linear fit to data resulting in R2 = 0.517. (b) Histograms of the end-point plasmon shift for the subpopulation of individual nanoparticles falling in a plasmon wavelength range of 750–800 nm (cyan) characterized by a variance of 5.2 nm2 and calculated plasmon shifts using a core–shell Mie–Gans model45 for the same subpopulation of representative particles whose sizes were extracted from TEM images characterized by a variance of only 0.9 nm2.
Although we observe a correlation between aspect ratio and end-point plasmon shift in Figure 3a, there is still significant spread in the observed shifts. For particles with a plasmon resonance between 750 and 800 nm this residual heterogeneity is characterized by its variance σtot2 = 5.2 nm2 (see Figure 3b). By a direct measurement of the refractive index sensitivity, we confirm that the additional spread in Figure 3 is not caused by a distribution of bulk-refractive index sensitivities due to e.g. differences in distance and orientation of the particles on the substrate (see Supporting Information). This variance could therefore be due to the above-mentioned mechanisms II and III, i.e., the distribution of particle volumes present in the sample (σvol2), or due to particle-to-particle variations in the ssDNA coverage (σcov2). Assuming all variables are normally distributed the total variance is then given by
| 1 |
We first estimate σvol2 by calculating the expected distribution of plasmon shifts using a core–shell Mie–Gans model45 (see Supporting Information). From TEM images we find that our nanorod sample contains particles with a length of 69 ± 7 nm and a width of 19 ± 3 nm (see Supporting Information for the analysis of the TEM images), leading to a distribution of volumes of (1.9 ± 0.6) × 104 nm3. Differences in particle volume lead to differences in end-point plasmon shift because the near-field decays on longer length scales for bigger particles.46 This reduces the overlap between the ssDNA coating and the near-field of the particle, resulting in smaller shifts for larger particle volumes. We used the core–shell Mie–Gans model to estimate σvol2 for a representative subpopulation of particles (dimensions extracted from TEM images) with a calculated plasmon wavelength between 750 and 800 nm. By considering only a subpopulation of nanoparticles and by calculating their expected plasmon shift using core–shell Mie–Gans theory, we disentangle the effect of the nanorod’s shape and size dispersion on the reported plasmon shifts. We find a minor contribution of σvol2 = 0.9 nm2, which implies that the ssDNA coverage varies from particle to particle contributing σcov2 = 4.3 nm2.
This suggests that the heterogeneity in end-point plasmon shift is dominated by particle-to-particle differences in the number of ssDNA strands. We decompose σcov2 into two contributions, i.e., σcov2 = σPois2 + σDNA2, where σPois2 represents the lower limit expected for the variance in the number of ssDNA per particle due to Poisson statistics and σDNA2 represents additional sources of heterogeneity. To estimate σPois2, we determine the number of ssDNA per particle based on previously published ssDNA densities on gold particles that reported a molecular footprint of ∼10 nm2.35 Our particles exhibit an average surface area of 4000 nm2, resulting in an average of 400 ssDNA strands per particle at saturation. This translates to a small variance in end-point plasmon shift of σPois2 = 0.5 nm2 (see Supporting Information), demonstrating that the mean source of heterogeneity is due to particle-to-particle variations in the average ssDNA coverage. The corresponding variance σDNA2 = 3.7 nm2 represents a coefficient of variation CV = 10%, implying that number of ssDNA strands per particle varies by ∼10%. Note that the above discussion assumes that particle-to-particle variations in DNA conformation are negligible, which is reasonable because we average over ∼400 strands per particle.
Results: Kinetics
To further understand the functionalization process, we now focus on the kinetics of the ssDNA binding. Dynamic plasmon shifts of individual particles were probed using a narrowband SLD, generating a time-dependent scattered intensity that depends on the plasmon wavelength relative to the wavelength of the SLD probe. This dependence is highlighted in Figure 4a, where we show several timetraces corresponding to individual gold nanorods on the same sample. For particles with a plasmon wavelength shorter than the probe wavelength, the red-shift of the plasmon causes an increase in the scattered signal, whereas particles with a plasmon wavelength longer than the probe exhibit the opposite behavior. There is also a third regime where the plasmon wavelength is only slightly blue-shifted compared to the probe. In that case the scattered signal first increases, and as the plasmon crosses the SLD wavelength the signal decreases again (magenta line in Figure 4a). The overall change in scattered intensity after functionalization with ssDNA is summarized in Figure 4b, where we observe the aforementioned wavelength dependence.
Figure 4.

(a) Timetraces of scattered intensity normalized to the intitial value for seven individual nanorods. At t = 0 s, ssDNA (1 μM in pH 1.7 citric acid buffer with 1 M of additional NaCl) is injected into the flow cell using a syringe pump at a flow rate of 100 μL/min for 3 min. The sign of the intensity change depends on the plasmon wavelength relative to the wavelength of the SLD probe (793 nm). (b) Correlation between the plasmon wavelength measured by hyperspectral microscopy and the observed contrast (Ifinal – Iinitial), where Ifinal was measured 1 h after injection of ssDNA. The vertical dashed line indicates the SLD’s center wavelength.
We performed measurements of dynamic plasmon shifts of single particles in response to binding of ssDNA at pH 1.7, 3, and 5, and for 0 and 1 M additional NaCl added to the citric acid buffer. To extract kinetic parameters from timetraces, we first fitted the data using a single exponential. However, this resulted in a poor fit (see Supporting Information), suggesting that the binding process cannot be described by simple Langmuir kinetics. Although a multiexponential fit results in better fitting due to the increased number of fitting parameters, it does not represent the underlying mechanism properly because it discretizes the distribution of rate constants. A better representation is given by a continuous distribution of rate constants k.
Since we expect rate constants bound to the region 0 ≤ k ≤ ∞, of the possible rate constant distributions the Gamma distribution possess a properly defined statistical mean and variance,47 is a generalization of the conventionally used stretched exponential distribution,48 and yields an analytical equation that can be used to fit the timetraces. The probability density function (pdf) of the Gamma distribution p(k) is given by49
| 2 |
where α and θ are the shape and
the scale parameter of the Gamma distribution (α, θ >
0), and Γ(z) is the Gamma function. The shape
and the scale parameters are related to the mean and the standard
deviation of the Γ distribution by ⟨k⟩ = αθ and  , respectively.
For the specific case of
a Gamma distribution of exponentials the overall signal decay Idecay can be expressed in a relatively simple
form49 containing only two parameters α
and θ:
, respectively.
For the specific case of
a Gamma distribution of exponentials the overall signal decay Idecay can be expressed in a relatively simple
form49 containing only two parameters α
and θ:
| 3 |
However, the time-dependent shift of the plasmon center wavelength is in our measurements probed using the (narrowband) SLD. Therefore, to simulate the measured timetrace, we approximate the nanorods longitudinal plasmon by a single Lorentzian and its shift over time is given by the Gamma distribution of rates. The energy of the plasmon ESP (in eV) as a function of time is then given by
| 4 |
where ΔE = E0f – E0i, with E0i the (measured) initial plasmon energy (in eV) and E0f the plasmon energy at t → ∞. Equation 4 is then used as the center energy of a Lorentzian curve that represents the scattering spectrum, which is evaluated at the probe wavelength and normalized to the initial value at t = 0. This yields a model for the normalized intensity scattered by the particle at the wavelength of the SLD probe, given by
 |
5 |
with Eprobe = 1.58 eV (= 793 nm) the probe energy and Γ0i the (measured) initial plasmon linewidth. We find that this model yields a very high fitting accuracy (mean R2 = 0.97 ± 0.08; see Supporting Information) with only three fitting parameters.
Figure 5 shows two typical examples of timetraces at pH 1.7 and pH 5, fitted with eq 5. At pH 1.7 we find mean rate constants that are orders of magnitude faster than at pH 5, in line with previous ensemble studies.16,17,28 However, for all particles studied we find a broad Gamma distribution of rate constants given by the corresponding Gamma probability density functions plotted in the inset. The broad distribution of rate constants for each particle is observed under all pH and salt conditions and is attributed to ssDNA crowding on the surface of the particle. This causes a gradual decrease in rate constant as the reaction progresses due to the onset of steric hindrance, hydrophobic effects, and electrostatic repulsion.33
Figure 5.

Gamma distribution fits (eqs 4 and 5) to recorded timetraces on a logarithmic scale for two individual single nanorods. The accuracy of the fits is evaluated by the coefficient of determination (R2). The clear differences in kinetics for different pH conditions are observed. In the inset the corresponding Gamma probability density functions are shown together with the mean kinetic rates. We report broad Gamma distributions of rate constants for both nanoparticles arising from ssDNA crowding on nanorod surfaces as the functionalization proceeds.
Although the Gamma distribution fits indicate that the binding rate reduces over time, they do not allow for easy comparison between different conditions because they require accurate fitting at long times to recover the low rate constants. This is especially challenging at pH > 5, where signals are low and the time to saturation is on the order of hours. We therefore turn to the initial rate constant at t = 0 s, where these effects do not play a role. This initial regime is characterized by a plasmon energy that shifts linearly in time, given by
| 6 |
where k0 is the initial rate constant.
We fitted the timetraces of individual particles with eq 5, with ESP(t) given by eq 6. A few examples of these fits are shown in Figure 6a. We observe that ssDNA binding starts at the exact same time for all probed nanoparticles; however, the extracted initial rate constants differ significantly from particle-to-particle, even if the chemical conditions are identical. We show a histogram of the distribution of k0 in Figure 6b for buffer pH of 1.7 with 1 M of additional NaCl. Surprisingly, we find values for k0 that vary by nearly an order of magnitude from particle to particle.
Figure 6.

(a) Three examples of timetraces with corresponding fits eqs 5 and 6 for individual single gold nanorods on the same sample. Even with identical chemical conditions we find heterogeneous kinetics varying from particle to particle as shown by the extracted k0. (b) Histograms of fitted k0 for pH 1.7 with 1 M of additional NaCl consisting of 171 individual nanoparticles characterized by a variance of 25 × 10–9 s–2 and calculated initial rates using core–shell Mie–Gans model (Supporting Information) whose sizes were extracted from TEM images (215 particles) characterized by a variance of only 0.8 × 10⁻⁹ s–2.
Figure 7 shows the mean and standard deviation of these log-normal distributions as a function of pH for 1 M of additional NaCl (results with 0 M of additional NaCl show a similar trend; see Supporting Information). In line with earlier ensemble studies16−18,27,28 we find that the mean rate constant depends strongly on pH due to the aforementioned modulation of electrostatic forces. We also determined the dependence of the initial rate on ssDNA concentration. These measurements were performed at a buffer pH of 1.7 with 1 M of additional NaCl; the distributions of k0 are shown in Figure 7b. We fitted the concentration series with a power law obtaining an exponent of 1.03 ± 0.17, confirming that the functionalization is a first-order reaction.
Figure 7.
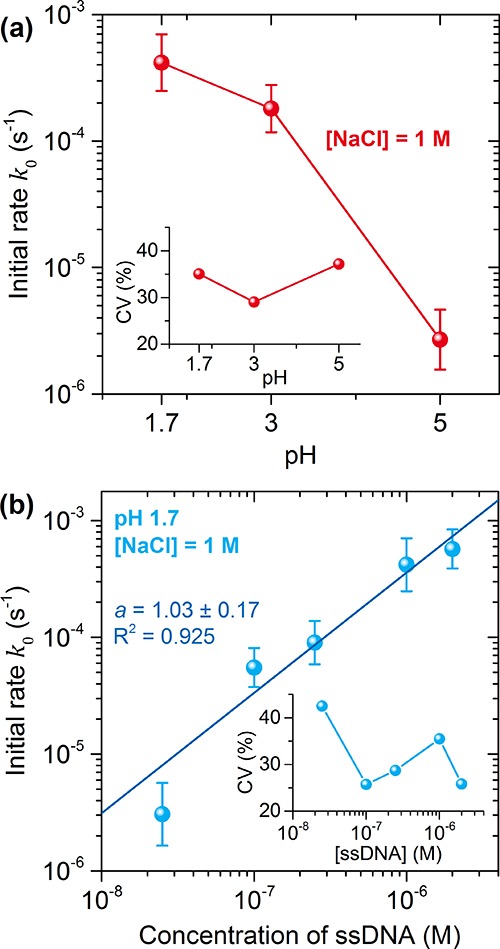
Initial binding rates k0 as a function of (a) buffer pH and (b) ssDNA concentration. The data points indicate the mean and standard deviations of the distributions extracted from the single-particle timetraces. The insets show the CV of the distribution k0.
In contrast to ensemble-averaged studies, we also gain insight into the heterogeneity of the process. We find that k0 exhibits a similar heterogeneity independent of pH, ionic strength, and ssDNA concentration (see insets in Figure 7). The origin of the heterogeneity in k0 could be twofold: (a) the size dispersion in our sample leading to different sensitivities to refractive index changes and (b) particle-to-particle variations in the energy barriers for ssDNA binding leading to a broadened distribution of k0. In terms of variances of distributions we can therefore write
| 7 |
where σtot2 represents the total (measured) variance k0, σpcle2 represents the heterogeneity caused by the distribution in particle sizes, and σbar2 represents the contribution from a distribution of energy barriers.
We now explore mechanism a—the dispersion of particle sizes present in our sample of nanorods. As shown in Figure 3a, a nanoparticle’s sensitivity to local refractive index depends on its aspect ratio,43,44 possibly resulting in a distribution of k0 even if the ssDNA binds at the same rate. We employ a core–shell Mie–Gans model to estimate the distribution of k0 caused purely by the dispersion of particle sizes and thus disentangle this effect from the heterogeneity caused by differences in molecular binding rate. As before, we used a set (n = 215) of representative particles whose sizes were extracted from TEM images. Although this model does not yield absolute values for k0, we do obtain its statistic by incrementally increasing the refractive index of the shell for the differently sized core particles. Figure 6b shows the histogram of initial rates for pH 1.7; here the distribution of k0 due to the particle size distribution (mangenta histogram) exhibits a variance of σpcle2 = 0.8 × 10⁻⁹ s–2 compared to the total (measured) variance σtot2 = 25 × 10–9 s–2. These variances corrrespond to CVpcle = 8% due to the particle-size distribution compared to the measured CVtot = 35%. Therefore, the size dispersion is not the dominant factor determining the broad distribution of k0.
The residual heterogeneity contributes a variance σbar2 = 24.2 × 10⁻⁹ s–2. We observe similar residual heterogeneity for all chemical conditions and ssDNA concentrations (see Supporting Information). We therefore attribute this additional spread to mechanism b—particle-to-particle variations in the surface charge density. The rate at which ssDNA adsorbs on the particle surface depends on the activation energy Eg that has to be overcome by a ssDNA molecule approaching the particle. Only when the ssDNA molecule has passed the energy barrier it can adsorb on the gold surface, rearrange, and induce thiol binding. The reaction rate k is then related to Eg by the Arrhenius equation, given by50
| 8 |
where A is the attempt frequency, kb is Boltzmann’s constant, and T is temperature. On the basis of the strong pH and salt dependence, we find for k0 we infer that Eg is dominated by attractive van der Waals forces and repulsive electrostatic forces, as was concluded before from ensemble studies.16,28 The electrostatic interaction depends on the charge distributions on the particle and on the ssDNA and on the salt-dependent Debye length. Given that our kinetic traces average over a large number of ssDNA, the particle-to-particle differences we observe cannot be caused by heterogeneities in the ssDNA.
However, the charge density on the nanoparticle is determined by the density and organization of capping ligands and associated ions on the exposed nanoparticle facets. Interestingly, recent single-particle zeta-potential measurements51,52 have indeed revealed particle-to-particle differences in zeta-potential for citrate-capped gold particles. Zeta-potential distributions were measured by single-particle electrophoresis through a metallic nanopore, where the transit time depends on the particle’s size and surface charge.51 Particle-to-particle differences in zeta-potential of several tens of percent were found and were attributed to varying organization and density of citrate on the particle surface.51 We therefore propose that this heterogeneity in charge density is the underlying cause of the strong heterogeneity in k0 that we observe. Indeed, the exponential dependence of k on Eg implies that particle-to-particle variations in surface-charge density of approximately 25% results in a distribution of k0 as in Figure 6b. There are no methods currently available to measure the zeta-potential and k0 on one-and-the-same particle, which is needed to shed light on the detailed mechanisms causing heterogeneity in the kinetics of functionalization.
Conclusion
Our results suggest that final ssDNA density on the particle surface varies by ∼10% from particle-to-particle beyond the expected variations due to the Poisson distributed total number of ssDNA strands. The functionalization process itself is unexpectedly heterogeneous, and we found rate constants that varied by almost an order of magnitude from particle to particle. This strong heterogeneity could not be explained by the particle size dispersion alone. Instead, we attribute the dominant origin of the kinetic heterogeneity to variations in the effective charge on the particle surface due to variations in the capping ligand (citrate) organization and density. These findings will have implications in the use of hybrid nanoparticles for crystallization studies,25 biosensors,23 and targeted therapeutics.53 In these studies functionality of the particle is largely determined by the number of functional groups on the particle surface. Further studies will shed light on the effect of the size, charge, and hydrophobicity of the capping ligand and the functional probe on the heterogeneity.
Methods
Gold nanorods were purchased from NanoSeedz, and their dimensions were subsequently measured using TEM giving an average width of 19 ± 3 nm and an average length of 69 ± 7 nm (see Supporting Information). To firmly immobilize gold nanorods, they were spin-coated onto coverslips thiolated with 3-mercaptopropyltrimethoxysilane (MPTMS, Sigma-Aldrich). The density of particles on the coverslips was controlled by the concentration during spin-coating to yield 300–400 particles in the 130 × 130 μm2 field of view of the microscope. Prior to ssDNA functionalization, the sample was rinsed with methanol, ethanol, 1 M NaCl, PBS, and Milli-Q water to remove loosely attached particles and residual cetyltrimethylammonium bromide (CTAB) surfactant. All experiments were executed inside the flow cell (Warner Instruments) which was placed into an inverted microscope (Nikon Eclipse Ti). The sample was equilibrated in a citric acid buffer, resulting in citrate-coated gold nanorods.
The microscope was equipped with a water immersion objective (Nikon Plan Apo 60x VC) with a numerical aperture of 1.15 and a magnification of 60×. The illumination of the sample was done using prism-coupled total internal reflection, giving nearly background free images.3 The light scattered by the nanorods was imaged on an EMCCD camera (Andor Ixon+ 885) enabling us to perform wide-field measurements on many individual particles simultaneously.
For spectroscopic measurements we illuminated the sample with a laser-driven xenon white-light source (Energetiq). Spectra of individual particles were recorded by hyperspectral microscopy in which a series of bandpass filters was inserted in the detection path of the microscope, and a wide-field image was recorded for each filter. Typical acquisition parameters of the EMCCD were an integration time of 500 ms and an EM gain of 5. The scattered intensity at each wavelength was determined by fitting the diffraction-limited spots to a two-dimensional Gaussian and was corrected for the spectral response of the setup (see Supporting Information). The single nanorods were distinguished from clusters based on a Lorentzian lineshape with a linewidth of 110 ± 40 meV (see inset of Figure 1c). For time-dependent measurements we used a single-mode fiber-coupled SLD (Superlum) with a center wavelength λprobe = 793 nm and a maximum output power of 35 mW. The kinetic experiments were typically acquired using 100 ms integration time and an EM gain of 0. To keep the sample in focus for extended periods of time during kinetic measurement, an autofocus system was used.
As an analyte we used ssDNA of 50 nucleotides modified with a thiol at the 5′ prime end (thiol-5′-TAG ACA GTT TCA TCG GTG ACA AGA TCC ATA CGC TTC CAA TAC GCT ATC AG-3′) purchased from Eurogentech. Unless stated otherwise, the concentration of ssDNA was 1 μM in citric acid buffer with a strength of 100 mM and a pH in the range of 1.7–9. Moreover, the analyte solution contained 1 mM of tris(2-carboxyethyl)phosphine hydrochloride (TCEP) purchased from Sigma-Aldrich to anneal disulfide bridges. The solution was introduced in the flow cell using a syringe pump, and subsequently the plasmon shift of individual particles was monitored. All experiments were performed at room temperature.
Acknowledgments
The authors thank M. W. J. Prins for proofreading of the manuscript and L. Hesse for work on the core–shell Mie–Gans model. P.Z. and R.E.A. acknowledge financial support from The Netherlands Organisation for Scientific Research (NWO VIDI). This work is part of the research programme of the Foundation for Fundamental Research on Matter (FOM), which is financially supported by The Netherlands Organisation for Scientific Research (NWO).
Supporting Information Available
The Supporting Information is available free of charge on the ACS Publications website at DOI: 10.1021/acs.langmuir.7b04027.
Figures S1–S8 and Tables S1–S3 (PDF)
The authors declare no competing financial interest.
Supplementary Material
References
- Dubois L. H.; Nuzzo R. G. Synthesis, Structure, and Properties of Model Organic Surfaces. Annu. Rev. Phys. Chem. 1992, 43, 437–463. 10.1146/annurev.pc.43.100192.002253. [DOI] [Google Scholar]
- Zijlstra P.; Paulo P. M. R.; Orrit M. Optical detection of single non-absorbing molecules using the surface plasmon resonance of a gold nanorod. Nat. Nanotechnol. 2012, 7, 379–382. 10.1038/nnano.2012.51. [DOI] [PubMed] [Google Scholar]
- Beuwer M. A.; Prins M. W. J.; Zijlstra P. Stochastic Protein Interactions Monitored by Hundreds of Single-Molecule Plasmonic Biosensors. Nano Lett. 2015, 15 (5), 3507–3511. 10.1021/acs.nanolett.5b00872. [DOI] [PubMed] [Google Scholar]
- Paige Hall W.; Ngatia S. N.; Van Duyne R. P. LSPR Biosensor Signal Enhancement Using Nanoparticle–Antibody Conjugates. J. Phys. Chem. C 2011, 115 (5), 1410–1414. 10.1021/jp106912p. [DOI] [PMC free article] [PubMed] [Google Scholar]
- Wang Z.; Lévy R.; Fernig D. G.; Brust M. The Peptide Route to Multifunctional Gold Nanoparticles. Bioconjugate Chem. 2005, 16 (3), 497–500. 10.1021/bc050047f. [DOI] [PubMed] [Google Scholar]
- Pavlov V.; Xiao Y.; Shlyahovsky B.; Willner I. Aptamer-Functionalized Au Nanoparticles for the Amplified Optical Detection of Thrombin. J. Am. Chem. Soc. 2004, 126 (38), 11768–11769. 10.1021/ja046970u. [DOI] [PubMed] [Google Scholar]
- Liu J.; Lu Y. Fast Colorimetric Sensing of Adenosine and Cocaine Based on a General Sensor Design Involving Aptamers and Nanoparticles. Angew. Chem. 2006, 118 (1), 96–100. 10.1002/ange.200502589. [DOI] [PubMed] [Google Scholar]
- Rosman C.; Prasad J.; Neiser A.; Henkel A.; Edgar J.; Sönnichsen C. Multiplexed Plasmon Sensor for Rapid Label-Free Analyte Detection. Nano Lett. 2013, 13 (7), 3243–3247. 10.1021/nl401354f. [DOI] [PubMed] [Google Scholar]
- Elghanian R.; Storhoff J. J.; Mucic R. C.; Letsinger R. L.; Mirkin C. A. Selective Colorimetric Detection of Polynucleotides Based on the Distance-Dependent Optical Properties of Gold Nanoparticles. Science 1997, 277 (5329), 1078–1081. 10.1126/science.277.5329.1078. [DOI] [PubMed] [Google Scholar]
- Herne T. M.; Tarlov M. J. Characterization of DNA Probes Immobilized on Gold Surfaces. J. Am. Chem. Soc. 1997, 119 (38), 8916–8920. 10.1021/ja9719586. [DOI] [Google Scholar]
- Storhoff J. J.; Elghanian R.; Mucic R. C.; Mirkin C. A.; Letsinger R. L. One-Pot Colorimetric Differentiation of Polynucleotides with Single Base Imperfections Using Gold Nanoparticle Probes. J. Am. Chem. Soc. 1998, 120 (9), 1959–1964. 10.1021/ja972332i. [DOI] [Google Scholar]
- Demers L. M.; Mirkin C. A.; Mucic R. C.; Reynolds R. A.; Letsinger R. L.; Elghanian R.; Viswanadham G. A Fluorescence-Based Method for Determining the Surface Coverage and Hybridization Efficiency of Thiol-Capped Oligonucleotides Bound to Gold Thin Films and Nanoparticles. Anal. Chem. 2000, 72 (22), 5535–5541. 10.1021/ac0006627. [DOI] [PubMed] [Google Scholar]
- Hurst S. J.; Lytton-Jean A. K. R.; Mirkin C. A. Maximizing DNA Loading on a Range of Gold Nanoparticle Sizes. Anal. Chem. 2006, 78 (24), 8313–8318. 10.1021/ac0613582. [DOI] [PMC free article] [PubMed] [Google Scholar]
- Liu J.; Lu Y. Preparation of aptamer-linked gold nanoparticle purple aggregates for colorimetric sensing of analytes. Nat. Protoc. 2006, 1, 246–252. 10.1038/nprot.2006.38. [DOI] [PubMed] [Google Scholar]
- Sharma J.; Chhabra R.; Andersen C. S.; Gothelf K. V.; Yan H.; Liu Y. Toward Reliable Gold Nanoparticle Patterning On Self-Assembled DNA Nanoscaffold. J. Am. Chem. Soc. 2008, 130 (25), 7820–7821. 10.1021/ja802853r. [DOI] [PubMed] [Google Scholar]
- Zhang X.; Servos M. R.; Liu J. Instantaneous and Quantitative Functionalization of Gold Nanoparticles with Thiolated DNA Using a pH-Assisted and Surfactant-Free Route. J. Am. Chem. Soc. 2012, 134 (17), 7266–7269. 10.1021/ja3014055. [DOI] [PubMed] [Google Scholar]
- Zhang X.; Liu B.; Dave N.; Servos M. R.; Liu J. Instantaneous Attachment of an Ultrahigh Density of Nonthiolated DNA to Gold Nanoparticles and Its Applications. Langmuir 2012, 28 (49), 17053–17060. 10.1021/la3035424. [DOI] [PubMed] [Google Scholar]
- Zhang X.; Gouriye T.; Göeken K.; Servos M. R.; Gill R.; Liu J. Toward Fast and Quantitative Modification of Large Gold Nanoparticles by Thiolated DNA: Scaling of Nanoscale Forces, Kinetics, and the Need for Thiol Reduction. J. Phys. Chem. C 2013, 117 (30), 15677–15684. 10.1021/jp403946x. [DOI] [Google Scholar]
- Dam D. H. M.; Lee J. H.; Sisco P. N.; Co D. T.; Zhang M.; Wasielewski M. R.; Odom T. W. Direct Observation of Nanoparticle–Cancer Cell Nucleus Interactions. ACS Nano 2012, 6 (4), 3318–3326. 10.1021/nn300296p. [DOI] [PMC free article] [PubMed] [Google Scholar]
- Rosi N. L.; Giljohann D. A.; Thaxton C. S.; Lytton-Jean A. K. R.; Han M. S.; Mirkin C. A. Oligonucleotide-Modified Gold Nanoparticles for Intracellular Gene Regulation. Science 2006, 312 (5776), 1027–1030. 10.1126/science.1125559. [DOI] [PubMed] [Google Scholar]
- Simoncelli S.; de Alwis Weerasekera H.; Fasciani C.; Boddy C. N.; Aramendia P. F.; Alarcon E. I.; Scaiano J. C. Thermoplasmonic ssDNA Dynamic Release from Gold Nanoparticles Examined with Advanced Fluorescence Microscopy. J. Phys. Chem. Lett. 2015, 6 (8), 1499–1503. 10.1021/acs.jpclett.5b00272. [DOI] [PubMed] [Google Scholar]
- Zijlstra P.; Orrit M. Single metal nanoparticles: optical detection, spectroscopy and applications. Rep. Prog. Phys. 2011, 74 (10), 106401. 10.1088/0034-4885/74/10/106401. [DOI] [Google Scholar]
- Taylor A. B.; Zijlstra P. Single-Molecule Plasmon Sensing: Current Status and Future Prospects. ACS Sensors 2017, 2 (8), 1103–1122. 10.1021/acssensors.7b00382. [DOI] [PMC free article] [PubMed] [Google Scholar]
- Grzelczak M.; Vermant J.; Furst E. M.; Liz-Marzan L. M. Directed Self-Assembly of Nanoparticles. ACS Nano 2010, 4 (7), 3591–3605. 10.1021/nn100869j. [DOI] [PubMed] [Google Scholar]
- Auyeung E.; Li T. I. N. G.; Senesi A. J.; Schmucker A. L.; Pals B. C.; Olvera de la Cruz M.; Mirkin C. A. DNA-mediated nanoparticle crystallization into Wulff polyhedra. Nature 2013, 505 (7481), 73–77. 10.1038/nature12739. [DOI] [PubMed] [Google Scholar]
- Osinkina L.; Carretero-Palacios S.; Stehr J.; Lutich A. A.; Jäckel F.; Feldmann J. Tuning DNA Binding Kinetics in an Optical Trap by Plasmonic Nanoparticle Heating. Nano Lett. 2013, 13 (7), 3140–3144. 10.1021/nl401101c. [DOI] [PubMed] [Google Scholar]
- Shi D.; Song C.; Jiang Q.; Wang Z.-G.; Ding B. A facile and efficient method to modify gold nanorods with thiolated DNA at a low pH value. Chem. Commun. 2013, 49, 2533–2535. 10.1039/c3cc39093d. [DOI] [PubMed] [Google Scholar]
- Dam D. H. M.; Lee H.; Lee R. C.; Kim K. H.; Kelleher N. L.; Odom T. W. Tunable Loading of Oligonucleotides with Secondary Structure on Gold Nanoparticles through a pH-Driven Method. Bioconjugate Chem. 2015, 26 (2), 279–285. 10.1021/bc500562s. [DOI] [PMC free article] [PubMed] [Google Scholar]
- Wang W.; Ding X.-F.; He M.; Wang J.; Lou X. Kinetic Adsorption Profile and Corformation Evolution at the DNA-Gold Nanoparticle Interface Probed by Dynamic Light Scattering. Anal. Chem. 2014, 86, 10186–10192. 10.1021/ac502440h. [DOI] [PMC free article] [PubMed] [Google Scholar]
- Li J.; Zhu B.; Yao X.; Zhang Y.; Zhu Z.; Tu S.; Jia S.; Liu R.; Kang H.; Yang C. J. Synergetic Approach for Simple and Rapid Conjugation of Gold Nanoparticles with Oligonucleotides. ACS Appl. Mater. Interfaces 2014, 6, 16800–16807. 10.1021/am504139d. [DOI] [PubMed] [Google Scholar]
- Zhang X.; Servos M. R.; Liu J. Ultrahight Nanoparticle Stability against Salt, pH, and Solvent with Retained Surface Accessibility via Depletion stabilization. J. Am. Chem. Soc. 2012, 134, 9910–9913. 10.1021/ja303787e. [DOI] [PubMed] [Google Scholar]
- Zhang X.; Servos M. R.; Liu J. Surface science of DNA Adsorption on Citrate-Capped Gold Nanoparticles. Langmuir 2012, 28, 3896–3902. 10.1021/la205036p. [DOI] [PubMed] [Google Scholar]
- Nelson E. M.; Rothberg L. J. Kinetics and Mechanism of Single-Stranded DNA Adsorption onto Citrate-Stabilized Gold Nanoparticles in Colloidal Solution. Langmuir 2011, 27 (5), 1770–1777. 10.1021/la102613f. [DOI] [PubMed] [Google Scholar]
- Kimura-Suda H.; Petrovykh D. Y.; Tarlov M. J.; Whitman L. J. Base-Dependent Competitive Adsorption of Single-Stranded DNA on Gold. J. Am. Chem. Soc. 2003, 125, 9014–9015. 10.1021/ja035756n. [DOI] [PubMed] [Google Scholar]
- Hill H. D.; Millstone J. E.; Banholzer M. J.; Mirkin C. A. The Role Radius of Curvature Playis in Thiolated Oligonucleotide Loading on Gold Nanoparticles. ACS Nano 2009, 3 (2), 418–424. 10.1021/nn800726e. [DOI] [PMC free article] [PubMed] [Google Scholar]
- Gill R.; Göeken K.; Subramaniam V. Fast, single-step, and surfactant-free oligonucleotide modification of gold nanoparticles using DNA with a positively charged tail. Chem. Commun. 2013, 49, 11400–11402. 10.1039/c3cc47138a. [DOI] [PubMed] [Google Scholar]
- Park J.-W.; Shumaker-Parry J. S. Structural Study of Citrate Layers on Gold Nanoparticles: Role of Intermolecular Interactions in Stabilizing Nanoparticles. J. Am. Chem. Soc. 2014, 136 (5), 1907–1921. 10.1021/ja4097384. [DOI] [PubMed] [Google Scholar]
- Brewer S. H.; Glomm W. R.; Johnson M. C.; Knag M. K.; Franzen S. Probing BSA Binding to Citrate-Coated Gold Nanoparticles and Surfaces. Langmuir 2005, 21 (20), 9303–9307. 10.1021/la050588t. [DOI] [PubMed] [Google Scholar]
- Martin R. B. A complete ionization scheme for citric acid. J. Phys. Chem. 1961, 65 (11), 2053–2055. 10.1021/j100828a032. [DOI] [Google Scholar]
- Kumler W. D.; Eiler J. J. The Acid Strength of Mono and Diesters of Phosphoric Acid. The n-Alkyl Esters from Methyl to Butyl, the Esters of Biological Importance, and the Natural Guanidine Phosphoric Acids. J. Am. Chem. Soc. 1943, 65 (12), 2355–2361. 10.1021/ja01252a028. [DOI] [Google Scholar]
- Verdolino V.; Cammi R.; Munk B. H.; Schlegel H. B. Calculation of pKa Values of Nucleobases and the Guanine Oxidation Products Guanidinohydantoin and Spiroiminodihydantoin using Density Functional Theory and a Polarizable Continuum Model. J. Phys. Chem. B 2008, 112 (51), 16860–16873. 10.1021/jp8068877. [DOI] [PubMed] [Google Scholar]
- Peters S. M. E.; Verheijen M. A.; Prins M. W. J.; Zijlstra P. Strong reduction of spectral heterogeneity in gold bipyramids for single-particle and single-molecule plasmon sensing. Nanotechnology 2016, 27 (2), 024001. 10.1088/0957-4484/27/2/024001. [DOI] [PubMed] [Google Scholar]
- Miller M. M.; Lazarides A. A. Sensitivity of Metal Nanoparticle Surface Plasmon Resonance to the Dielectric Environment. J. Phys. Chem. B 2005, 109 (46), 21556–21565. 10.1021/jp054227y. [DOI] [PubMed] [Google Scholar]
- Becker J.; Trügler A.; Jakab A.; Hohenester U.; Sönnichsen C. The Optimal Aspect Ratio of Gold Nanorods for Plasmonic Bio-sensing. Plasmonics 2010, 5 (2), 161–167. 10.1007/s11468-010-9130-2. [DOI] [Google Scholar]
- Guyot-Sionnest M.; Guyot-Sionnest P. Synthesis and Optical Characterization of Au/Ag Core/Shell Nanorods. J. Phys. Chem. B 2004, 108 (19), 5882–5888. 10.1021/jp037644o. [DOI] [Google Scholar]
- Antosiewicz T. J.; Käll M. A Multiscale Approach to Modeling Plasmonic Nanorod Biosensors. J. Phys. Chem. C 2016, 120 (37), 20692–20701. 10.1021/acs.jpcc.6b01897. [DOI] [Google Scholar]
- Fogarty A. C.; Jones A. C.; Camp P. J. Extraction of lifetime distributions from fluorescence decays with application to DNA-base analogues. Phys. Chem. Chem. Phys. 2011, 13, 3819–3830. 10.1039/c0cp01779e. [DOI] [PubMed] [Google Scholar]
- Berberan-Santos M. N.; Bodunov E. N.; Valeur B. Mathematical functions for the analysis of luminescence decays with underlying distributions 1. Kohlrausch decay function (stretched exponential). Chem. Phys. 2005, 315 (1–2), 171–182. 10.1016/j.chemphys.2005.04.006. [DOI] [Google Scholar]
- Abramowitz M.; Stegun I. A.. Handbook of Mathematical Functions: With Formulas, Graphs, and Mathematical Tables; Courier Corporation: Washington, DC, 1964; Vol. 55. [Google Scholar]
- Israelachvili J. N.Intermolecular and Surface Forces, 3rd ed.; Elsevier: Amsterdam, 2011. [Google Scholar]
- Arjmandi N.; van Roy W.; Lagae L.; Borghs G. Measuring the Electric Charge and Zeta Potential of Nanometer-Sized Objects Using Pyramidal-Shaped Nanopores. Anal. Chem. 2012, 84, 8490–8496. 10.1021/ac300705z. [DOI] [PubMed] [Google Scholar]
- Blundell E. L. C. J.; Vogel R.; Platt M. Particle-by-Particle Charge Analysis of DNA-Modified Nanoparticles Using Tunable Resistive Pulse Sensing. Langmuir 2016, 32 (4), 1082–1090. 10.1021/acs.langmuir.5b03024. [DOI] [PubMed] [Google Scholar]
- Huang X.; El-Sayed I. H.; Qian W.; El-Sayed M. A. Cancer Cell Imaging and Photothermal Therapy in the Near-Infrared Region by Using Gold Nanorods. J. Am. Chem. Soc. 2006, 128 (6), 2115–2120. 10.1021/ja057254a. [DOI] [PubMed] [Google Scholar]
Associated Data
This section collects any data citations, data availability statements, or supplementary materials included in this article.