

Abstract
Several studies have demonstrated the prognostic value of neutrophil‐lymphocyte ratio (NLR) in patients with solid tumors and non–Hodgkin lymphoma. In contrast, there is only sparse data on its prognostic role in patients with classical Hodgkin lymphoma (cHL). The aim of our study was to establish whether NLR could serve as an independent prognostic factor in a cohort of 990 patients with nodular sclerosis (NS)‐cHL. After analysis of the log hazard ratio (HR) as a function of NLR, we chose the value 6 as cutoff. Patients with NLR >6 had a worse progression‐free survival and overall survival compared to those with NLR ≤6; 84% vs 75% and 92% vs 88%, at 5 years, with an HR of 1.65 and 1.82, respectively. Multivariate analysis showed that the risk remained high with HR 1.44 and HR 1.54 in progression‐free survival and overall survival, respectively. In summary, our study shows that NLR is a robust and independent prognostic parameter in NS‐cHL, both in early and advanced disease. It is inexpensive and simple to apply. Thus, we conclude that NLR, possibly in combination with the international prognostic score and absolute monocyte count, is a useful guide for physicians treating NS‐cHL patients.
Keywords: Hodgkin lymphoma, lymphocyte, neutrophil, neutrophil‐lymphocyte ratio, prognosis
1. INTRODUCTION
There is an increasing amount of published data showing that tumor microenvironment, host immunity, and inflammatory responses all play an important role in determining the clinical course and outcome of patients with malignant lymphoma. Several investigators have considered the absolute lymphocyte count (ALC)1 as an important biomarker of tumor infiltrating lymphocytes, reflecting host immunity status, while absolute monocyte count (AMC)2 serves as a surrogate biomarker of tumor‐associated macrophages within the tumor microenvironment, and the absolute neutrophil count (ANC)3 as a measure of the systemic inflammatory response to malignancy. Inflammation is regarded as a critical component of tumor progression, and it is evident that the tumor microenvironment, is largely coordinated by inflammatory cells, which play a central role in the neoplastic process, promoting, proliferation, survival, and migration of tumor cell via activation of signaling pathways.4, 5, 6 Both AMC and ALC have been suggested as significant prognostic factors in Hodgkin lymphoma (HL),1, 7 while the ANC and the neutrophil lymphocyte ratio (NLR) at diagnosis are both prognostic factors for survival in solid tumors8 and recently have also been shown to have prognostic impact diffuse large B‐cell lymphoma (DLBCL).3, 9 In contrast, there is only sparse data on their role as prognostic factors in patients with HL.10 In this regard different cutoff values have been established for NLR in DLBCL (3.5 or 4.0)3, 9 and in HL (4.3).10 In the present retrospective study the aim was to establish whether NLR could serve as a significant and independent prognostic factor, utilizing a large cohort of patients with nodular sclerosis (NS)‐HL.
2. PATIENTS AND METHODS
2.1. Inclusion criteria
This is a retrospective study of previously untreated patients with NS‐HL diagnosed according to the World Health Organization criteria. We reviewed the clinical and laboratory data of consecutive “therapy‐naive” patients, treated in different centers in Italy and Israel from January 1988 to the end of December 2007, after approval by local institutional review boards. Italian cases were collected from 38 centers belonging to the Gruppo Italiano Studio Linfomi archive, while data from Israeli patients were obtained from 2 medical centers. All studies were performed in accordance with the Declaration of Helsinki. The inclusion criteria were histopathological diagnosis of NS‐HL, no previous therapy, age ≥18 years, HIV negativity, availability of data on all clinical and laboratory features and treatment given, data from long‐term follow‐up and outcome. The database contained a total of 1855 patients who had received combination chemotherapy with or without radiotherapy. Analysis was performed on a final cohort of 990 patients, after the exclusion of those with missing data relating to International Prognostic Score (IPS) (n = 173), hematological and biochemical parameters (n = 193), missing pathology report (n = 95), or other histologies (n = 404). Definition of response was based on guidelines reported by Lister et al in 1989.11
2.2. Outcomes
The primary end point of the study was to assess the impact of NLR on progression‐free survival (PFS) and overall survival (OS).
2.3. Statistical analysis
Progression‐free survival was defined as the time from study entry to the time of any documented clinical progression, relapse, or death from any cause. Overall survival was defined as the time from study entry to the last observation or death from any cause.
Patient baseline characteristics are expressed as absolute frequencies and percentages for categorical variables and they are compared with the χ2 test or exact Fisher test. Continuous variables were reported as the median and 2.5‐97.5 percentile. Formal comparisons were performed with Mann‐Whitney or Kruskal‐Wallis test. Survival functions were evaluated with the Kaplan‐Meier method.12 Statistical comparisons by groups of risk were performed with the log‐rank test and the Cox proportional hazard (PH) regression analysis,13 with a confidence interval at 95% (95% CI). The PH assumption was verified graphically by means of scaled Schoenfeld residuals.14 The effect size was reported as hazard ratio (HR) with the associated 95% CI.
2.3.1. Analysis of the cutoff
We have assessed the NLR by modeling it as continuous covariate in an explorative Cox PH restricted cubic spline regression.15 The degrees of freedom for NLR were selected on the basis of the minimum Akaike information criterion. The cutoff value was chosen at the point where log(HR) = 0. Cutoff repeatability was checked with 1000 bootstrap replication sample.
2.3.2. Importance of the covariate
We assessed the importance of NLR as predictor based on their bootstrap inclusion fractions, when 1000 replications were run in the Cox PH model. We used a hierarchical selection approach with log‐likelihood ratio test with cutoff of 0.05, adding in Cox model the NLR covariate kept fixed the adjusting covariates age >45, male gender, hemoglobin (Hb) <10.5 g/dL, albumin <4 g/dL, staging IIb‐IV, and AMC >750/uL.16 In addition NLR was also studied as continuous variable. All statistical comparisons were 2 sides. The study design was retrospective. The simple size for this specific research was not planned. All analyses were performed with Stata SE/10 software.
3. RESULTS
3.1. Patient characteristics
The median age of the total of 990 patients enrolled in the study was 31 years (17‐69 percentile); 51% females, and 49% males with 45% of patients symptomatic. The median values of ANC, ALC, and NLR were 6.6 (range 2.0‐18) × 109 cells/L, 1.5 (range 0.36‐4.14) × 109 cells/L, and 4.35 (range 1.10‐18.2), respectively. Details of clinical characteristics of all patients are shown in (Table 1). Patients received different combination chemotherapy regimens (Table 2). After a median follow‐up of 85 months (range 1‐224 mo), 201 patients progressed or relapsed and 111 patients died from various causes. The estimated 5‐year PFS and OS were 81% (95% CI, 78%‐84%) and 91% (95% CI, 89%‐93%), respectively.
Table 1.
Characteristics of 990 patients with HL enrolled
| Variable | Median (2.5‐97.5 percentile) |
|---|---|
| Age | 31 (17‐69) |
| Hb, g/dL | 12.3 (7.9‐16.0) |
| Albumin, g/dL | 3.9 (2.5‐5.0) |
| WBC 109 cells/L | 9.20 (3.60‐2.12) |
| AMC 109 cells/L | 0.57 (0.09‐1.58) |
| ALC 109 cells/L | 1.54 (0.36‐4.14) |
| ANC 109 cells/L | 6.59 (2.02‐18.02) |
| NLR | 4.4 (1.1‐18.2) |
| Factor | N, % |
| Age > 45 | 209 (21) |
| Gender, male | 487 (49) |
| Stage IIB‐IV | 591 (60) |
| Hb < 10.5 g/dL | 161 (16) |
| Albumin < 4 g/dL | 591 (60) |
| WBC > 15 000/mm3 | 116 (12) |
| ALC < 600/mm3 | 52 (5) |
| Period of diagnosis | |
| 1988‐1999 | 469 (47) |
| 2000‐2003 | 255 (26) |
| 2004‐2007 | 266 (27) |
Abbreviations: ALC, absolute lymphocyte count; AMC, absolute monocyte count; ANC, absolute neutrophil count; Hb, hemoglobin; HL, Hodgkin lymphoma; NLR, neutrophil‐lymphocyte ratio; WBC, white blood cell.
Table 2.
Treatments, periods of diagnosis, and response to therapy
| Period of diagnosis | Total | |||
|---|---|---|---|---|
| Chemotherapy | 1988‐1999 | 2000‐2003 | 2004‐2007 | |
| N, % | N, % | N, % | N, % | |
| ABVD | 160 (34) | 144 (56) | 180 (68) | 484 (49) |
| (MEC)MOPP/EBV/CAD | 166 (35) | 39 (15) | 25 (9) | 230 (23) |
| VBM | 88 (19) | 36 (14) | 26 (10) | 150 (15) |
| BEACOPP | 0 | 32 (13) | 35 (13) | 67 (7) |
| Stanford V | 30 (6) | 2 (1) | 0 | 32 (3) |
| EVE | 25 (5) | 2 (1) | 0 | 27 (3) |
| Radiotherapy | 296 (63) | 173 (68) | 129 (49) | 598 (60) |
| Response CHT ± RT | N, % | N, % | N, % | Total |
| CR | 425 (91) | 229 (90) | 232 (87) | 886 (89) |
| PR | 19 (4) | 9 (3) | 9 (3) | 37 (4) |
| SD/PD/EF | 25 (5) | 17 (7) | 25 (9) | 67 (7) |
Abbreviations: ABVD, adriamycin, bleomycin, vinblastine, and dacarbazine; BEACOPP, bleomycin, etoposide, adriamycin, cyclophosphamide, vincristine, procarbazine, and prednisone; CAD, lomustine, doxorubicin, and vindesine; CHT, chemotherapy; CR, complete response; EBV, epidoxorubicin, bleomycin, and vinblastine; EF, early failure; EVE, epirubicin, vinblastine and etoposide; MOPP, mechlorethamine, vincristine, procarbazine, and prednisone; PD, progressive disease; PR, partial response; RT, radiotherapy; SD, stable disease; Stanford V, doxorubicin, vinblastine, mechlorethamine, vincristine, bleomycin, etoposide, and prednisone; VBM, vinblastine, bleomycin, and methotrexate.
Chi‐square test for response by period of diagnosis, P = .328.
3.2. Analysis of the cutoff
The NLR was determined by dividing the peripheral blood levels of ANC by ALC at diagnosis. The median NLR was 4.35 (range 1.10‐18.2). In the PFS analysis with the flexible restricted cubic spline Cox regression, the log(HR) for NLR increased linearly and crossed the zero point at around 6.0 (Figure 1). From bootstrap samples (1000 replicates) the mean cutoff was 5.9 (with a 5‐95 percentile interval range of 4.7‐9.2). On the basis of this evaluation we chose 6.0 as our threshold value.
Figure 1.

Hazard ratio (HR) (in natural logarithm form) associated with neutrophil‐lymphocyte ratio (NLR). Result as shown from Cox proportional hazard; restricted cubic spline regression model (2 degrees of freedom) of NLR expressed as continuous variable. Vertical line indicates the cutoff value
Of the 990 patients, 336 (34%) had NLR >6, and of these, 76% had stage IIB‐IV and 37% had an IPS 3‐7.
3.3. Impact of the therapies
The patients with NLR ≤6 were treated with adriamycin, bleomycin, vinblastine, and dacarbazine (ABVD) (49%) and bleomycin, etoposide, adriamycin, cyclophosphamide, vincristine, procarbazine, and prednisone (BEACOPP)/(MEC)MOPP (25%), while the patients with NLR >6 were treated with ABVD (45%) and BEACOPP/(MEC)MOPP (40%), P < .001. Although the therapies in the 2 groups of patients with NLR ≤6 and NLR >6 were not well balanced, the log‐rank test between the curves by therapies was not statistically significant for both PFS (P = .156) and for OS (P = .444) that showed that there was no impact of the treatments in the survival outcomes.
3.4. Prognostic significance of NLR ratio
3.4.1. Progression‐free survival
The PFS estimate for NLR ≤6 at 5 years was 84% (95% CI, 81%‐87%) and 75% (95% CI, 70%‐80%)for NLR >6. Comparison between the curves showed that this was statistically significant (P < .001, Figure 2A). In univariate Cox PH regression analysis, NLR >6 showed a higher risk of disease progression with HR of 1.65 (95% CI, 1.25‐2.18, P = .001) (Table 3a). Multivariate analysis, after adjusting for age >45 years, male gender, Hb <10.5 g/dL, albumin <4/g/dL, stage IIB‐IV (IPS factors), and AMC >750/uL, showed that the risk remained high with HR of 1.44 (Table 3a). Furthermore, in multivariate Cox PH regression analysis relating to NLR as a continuous parameter, the HR increased by 1.03 (95% CI, 1.01‐1.04; P = .001) for any linear increase of one unit.
Figure 2.
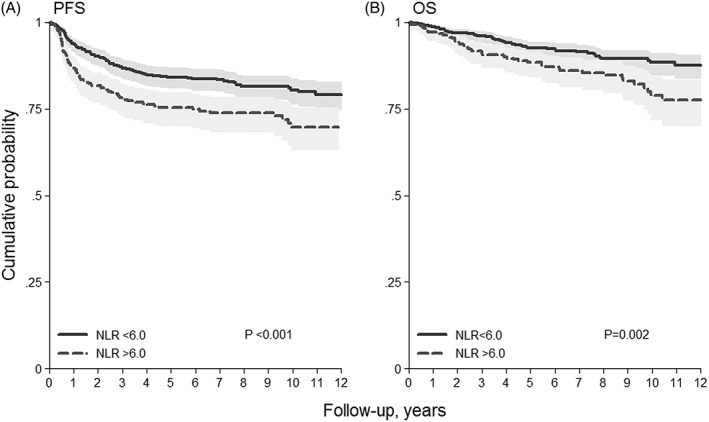
Kaplan‐Meier curves of A, progression‐free survival (PFS) and B, overall survival (OS) stratified by neutrophil lymphocyte ratio (NLR) cutoff
Table 3a.
PFS by NLR in univariate and multivariate Cox PH regression
| PFS | 5‐y PFS % | Univariate | |
|---|---|---|---|
| NLR | (95% CI) | HR (95% CI) | P |
| ≤6 (n = 654, 66%) | 84 (81‐87) | 1.00 | |
| >6 (n = 336, 34%) | 75 (70‐80) | 1.65 (1.25‐2.18) | .001 |
| Multivariate | |||
| HR (95% CI) | P | ||
| NLR | 1.44 (1.07‐1.94) | .016 | |
| Age >45 | 1.77 (1.31‐2.41) | <.001 | |
| Male | 1.15 (0.81‐1.52) | .344 | |
| Hb <10.5 g/dL | 1.62 (1.15‐2.28) | .006 | |
| Albumin <4 g/dL | 1.17 (0.85‐1.61) | .346 | |
| Stage IIB‐IV | 1.10 (0.77‐1.53) | .582 | |
| AMC >0.75 109/L | 1.55 (1.15‐2.08) | .004 | |
| BIF NLR >6: 70% | |||
Abbreviations: AMC, absolute monocyte count; BIF, bootstrap inclusion frequencies, log‐likelihood ratio test over 1000 bootstrap resamples with cutoff 0.05; 95% CI, confidence interval 95%; Cox PH, Cox proportional hazard regression; Hb, hemoglobin; HR, hazard ratio; NLR, neutrophil‐lymphocyte ratio; PFS, progression‐free survival.
We also evaluated the prognostic effect of NLR ≤6 and >6 in patients with early (I‐IIA) and advanced stage (IIB‐IV); the log‐rank test between the curves was statistically significant for both groups (P = .029 for early stage, and P = .033 for advanced stage patients, respectively, Figure 3a,b).
Figure 3.

A, Progression‐free survival (PFS) in early stage (I‐IIA) group stratified by neutrophil‐lymphocyte ratio (NLR); B, PFS in advanced stage (IIB‐IV) group; stratified by NLR; C, overall survival (OS) in early stage(I‐IIA) group stratified by NLR; D, OS in advanced stage (IIB‐IV group) stratified by NLR
3.4.2. Overall survival
The OS for NLR ≤6 estimated at 5 years was 92% (95% CI, 90%‐94%) and for NLR >6 was 88% (95% CI, 84%‐92%). Comparison between the curves was statistically significant (P = .002, Figure 2B). In univariate Cox PH regression analysis NLR >6 showed a higher risk of death with HR of 1.82 (Table 3b). Multivariate analysis, after adjusting for age >45 years, male gender, Hb <10.5 g/dL, albumin <4/g/dL, stage IIB‐IV (IPS factors), and AMC >750/uL, showed that the risk remained high with HR of 1.54 (95% CI, 1.03‐2.29). Furthermore, in multivariate Cox PH regression analysis considering NLR as a continuous parameter, HR increased by 1.03 (95% CI, 1.01‐1.06, P = .014) for any linear increase of one unit.
Table 3b.
OS by NLR in univariate and multivariate Cox PH regression
| OS | 5‐y OS % | Univariate | |
|---|---|---|---|
| NLR | (95% CI) | HR (95% CI) | P |
| ≤6 (n = 654, 66%) | 92 (90‐94) | 1.00 | |
| >6 (n = 336, 34%) | 88 (84‐92) | 1.82 (1.25‐2.65) | .002 |
| Multivariable | |||
| HR (95% CI) | P | ||
| NLR | 1.54 (1.03‐2.29) | .034 | |
| Age >45 | 2.78 (1.88‐4.09) | <.001 | |
| Male | 1.10 (0.75‐1.62) | .621 | |
| Hb <10.5 g/L | 1.40 (0.89‐2.21) | .145 | |
| Albumin <4 g/dL | 1.27 (0.82‐1.99) | .289 | |
| Stage IIB‐IV | 1.38 (0.87‐2.20) | .170 | |
| AMC >0.75 109/L | 1.53 (1.02‐2.28) | .038 | |
| BIF NLR >6: 56% | |||
Abbreviations: AMC, absolute monocyte count; BIF, bootstrap inclusion frequencies, log‐likelihood ratio test over 1000 bootstrap resamples with cutoff 0.05; 95% CI, confidence interval 95%; Cox PH, Cox proportional hazard regression; Hb, hemoglobin; HR, hazard ratio; NLR, neutrophil‐lymphocyte ratio; OS, overall survival.
We also evaluated the prognostic effect of the NLR ≤6 and >6 in groups of patients with early (I‐IIA) as well as advanced stage (IIB‐IV); the log‐rank test between the curves was statistically significant only for the advanced stage group (P = .036, Figure 3D).
We also evaluated the prognostic role of ANC. As cutoff, determined with the same methodology used for NLR, we have found ANC 6.5 × 10⁹/L. By univariate analysis ANC had only a weak prognostic impact power for PFS (HR 1.34, 95% CI, 1.01‐1.77, P = .041) or OS (HR 1.41, 95% CI, 0.97‐2.06, P = .074). By multivariate analysis, (after adjusting for age >45, male gender, Hb <10.5 g/dL, albumin <4/g/dL, stage IIb‐IV (IPS factors), and AMC >750/uL), ANC had no prognostic impact.
4. DISCUSSION
The NLR is considered a simple and strong parameter for evaluating both inflammatory (neutrophils) and immune (lymphocyte) responses relating to prognosis in cancer patients.8 In this regard, a number of studies have demonstrated the prognostic value of NLR at diagnosis and prior to therapy in patients with solid tumors.8 In hematological malignancies, like DLBCL, high NLR3, 7, 17, 18, 19 has also been associated with a poor prognosis and the results reported in our study on a different type of lymphoma—NS‐HL are in line with these findings on DLBCL.
In HL, low ALC,1 high AMC,2 and low lymphocyte to monocyte ratios2, 7 are associated with a poor prognosis. However until now, only a few studies have analyzed the prognostic significance of ANC and NLR in patients with HL. In 2012 Koh et al10 reported results on 312 patients with classical HL, including 177 with NS‐HL. After evaluation of all 312 patients, they concluded that NLR is an independent prognostic factor, which may help to stratify patients considered as low risk on the basis of the IPS. Here in our study we evaluated a much larger cohort of 990 patients with NS‐HL and after extensive statistical analysis we chose 6.0 as the NLR cutoff value. Overall, NS‐HL patients with a NLR <6 had a and statistically significant better outcome in terms of both PFS and OS. In multivariate analysis the NLR remained an independent prognostic factor, along with other parameters like age >45, male gender, Hb <10.5 g/dL, albumin <4/g/dL, stage IIB‐IV, and AMC >750/uL. Furthermore, unlike the IPS, NLR, at least regarding PFS, is a prognostic factor that is also applicable to patients with early stage disease. The reason for this correlation of NLR with poor prognosis is largely unknown. However, in this respect it has been reported that normal neutrophils are able to suppress T‐cell function, while activated neutrophils have increased levels of arginase 1, which also cause T‐cell suppression.20 In addition to contributing to T‐cell immune suppression, neutrophils may also exhibit tumor‐promoting capabilities, like the induction of angiogenesis and enhancement of tumor spread by enhancing the expression of matrix metalloproteinase 9.10
Indeed, one of the established “classical” IPS parameters in HL is peripheral blood leukocytosis, mainly because of an increased neutrophil count, and this has been validated extensively.21 In our cohort, however, we would like to emphasize that there was no correlation between the absolute neutrophil number and prognosis. We have no ready explanation for this observation but it could theoretically be due to the fact that inflammation alone is insufficient to determine prognosis, and only when linked to decreased host immunity status, does it gain more powerful prognostic impact, as reflected by the impressive predictive value of NLR.
Our study has some obvious limitations that relate to the retrospective nature of the research design. On the other hand, its strength includes the large NS‐HL sample size, long follow‐up, and the accuracy of the cutoff determination based on a large cohort of cases.
In conclusion, here we show that NLR is a strong and independent prognostic parameter in NS‐HL, inexpensive to perform, and simple to apply. We, like many others in this field, await with much expectation the future development of tailored medicine and the routine introduction of simpler and cheaper methods for the study of gene expression profiles capable of predicting response to therapy and eventual outcome. Until then we feel that NLR, possibly in combination with IPS factors and AMC, could serve as a useful guide for physicians in their routine management of patients with NS‐HL.
AUTHORS' CONTRIBUTION
R.M., A.B., and S.S.: conception and design of the study, interpretation of the data, and final approval of the version to be published. L.M. and R.M.: statistical analysis, data collection, interpretation of data, and creation of tables and figures. L.M., A.B., T.T., L.M., S.P., A.P., T.T., and S.S. wrote the manuscript. S.S., A.B., T.T., M.C.C., S.P., A.F., L.B., P.G., A.V., P.G., M.F., A.P., and S.P. have participated in the data recording and the interpretation of the data. All authors contributed critically to the drafting of the article and approved the final version.
CONFLICT OF INTEREST
There are no financial disclosures or conflicts of interest to declare.
Marcheselli R, Bari A, Tadmor T, et al. Neutrophil‐lymphocyte ratio at diagnosis is an independent prognostic factor in patients with nodular sclerosis Hodgkin lymphoma: results of a large multicenter study involving 990 patients, Hematological Oncology. 2017;35:561–566. https://doi.org/10.1002/hon.2359
REFERENCES
- 1. Seshadri T, Pintilie M, Keating A, Crump M, Kuruvilla J. The relationship between absolute lymphocyte count with PFS in patients with Hodgkin's lymphoma undergoing autologous hematopoietic cell transplant. Bone Marrow Transplant. 2008;42(1):29–34. [DOI] [PubMed] [Google Scholar]
- 2. Tadmor T, Bari A, Marcheselli L, et al. Absolute monocyte count and lymphocyte‐monocyte ratio predict outcome in nodular sclerosis Hodgkin lymphoma: evaluation based on data from 1450 patient. Mayo Clin Proc. 2015;90(6):756–764. [DOI] [PubMed] [Google Scholar]
- 3. Troppan K, Deutsch A, Gerger A, et al. The derived neutrophil to lymphocyte ratio is an independent prognostic factor in patients with diffuse large B‐cell lymphoma. Br J Cancer. 2014;110(2):369–374. [DOI] [PMC free article] [PubMed] [Google Scholar]
- 4. Quail DF, Joyce JA. Microenvironmental regulation of tumor progression and metastasis. Nat Med. 2013;19(11):1423–1437. [DOI] [PMC free article] [PubMed] [Google Scholar]
- 5. Mantovani A, Allavena P, Sica A, Balkwill F. Cancer‐related inflammation. 2008;454(7203):436–444. [DOI] [PubMed] [Google Scholar]
- 6. Coussens LM, Werb Z. Inflammation and cancer. Nature. 2002;420(6917):860–867. [DOI] [PMC free article] [PubMed] [Google Scholar]
- 7. Porrata LF, Ristow K, Habermann TM, et al. Peripheral blood lymphocyte/monocyte ratio at diagnosis and survival in nodular lymphocyte‐predominant Hodgkin lymphoma. Br J Haematol. 2012;157(3):321–330. [DOI] [PubMed] [Google Scholar]
- 8. Nishijima TF, Muss HB, Shachar SS, Tamura K, Takamatsu Y. Prognostic value of lymphocyte‐to‐monocyte ratio in patients with solid tumors: a systematic review and meta‐analysis. Cancer Treat Rev. 2015;41(10):971–978. [DOI] [PubMed] [Google Scholar]
- 9. Porrata LF, Ristow K, Habermann T, Inwards DJ, Micallef IN, Markovic SN. Predicting survival for diffuse large B‐cell lymphoma patients using baseline neutrophil/lymphocyte ratio. Am J Hematol. 2010;85(11):896–899. [DOI] [PubMed] [Google Scholar]
- 10. Koh YW, Kang HJ, Park C, et al. Prognostic significance of the ratio of absolute neutrophil count to absolute lymphocyte count in classic Hodgkin lymphoma. Am J Clin Pathol. 2012;138(6):846–854. [DOI] [PubMed] [Google Scholar]
- 11. Lister TA, Crowther D, Sutcliffe SB, et al. Report of a committee convened to discuss the evaluation and staging of patients with Hodgkin's disease: Cotswolds meeting. J Clin Oncol. 1989;7(11):1630–1636. [DOI] [PubMed] [Google Scholar]
- 12. Kaplan E, Meier P. Nonparametric estimation from incomplete observations. J Am Stat Assoc. 1958;53(282):457–481. [Google Scholar]
- 13. Cox D. Regression models and life tables. J R Stat Soc B. 1972;34(2):187–202. [Google Scholar]
- 14. Schoenfeld D. Partial residuals for proportional hazard regression model. Biometrika. 1982;69(1):239–241. [Google Scholar]
- 15. Royston P. A strategy for modelling the effect of a continuous covariate in medicine. Stat Med. 2000;30(14):1831–1847. [DOI] [PubMed] [Google Scholar]
- 16. Sauerbrei W, Schumacher M. A bootstrap resampling procedure for model building: application to the Cox regression model. Stat Med. 1992;11(16):2093–2109. [DOI] [PubMed] [Google Scholar]
- 17. Keam B, Ha H, Kim TM, et al. Neutrophil to lymphocyte ratio improves prognostic prediction of International Prognostic Index for patients with diffuse large B‐cell lymphoma treated with rituximab, cyclophosphamide, doxorubicin, vincristine and prednisone. Leuk Lymphoma. 2015;56(7):2032–2038. [DOI] [PubMed] [Google Scholar]
- 18. Ho CL, Lu CS, Chen JH, Chen YG, Huang TC, YY. W. Neutrophil/lymphocyte ratio, lymphocyte/monocyte ratio, and absolute lymphocyte count/absolute monocyte count prognostic score in diffuse large B‐cell lymphoma: useful prognostic tools in the rituximab era. Medicine. 2015;94(24):e993. [DOI] [PMC free article] [PubMed] [Google Scholar]
- 19. Melchardt T, Troppan K, Weiss L, et al. Independent prognostic value of serum markers in diffuse large B‐cell lymphoma in the era of the NCCN‐IPI. J Natl Compr Canc Netw. 2015;13(12):1501–1508. [DOI] [PubMed] [Google Scholar]
- 20. Munder M, Schneider H, Luckner C, et al. Suppression of T‐cell functions by human granulocyte arginase. Blood. 2006;108(5):1627–1634. [DOI] [PubMed] [Google Scholar]
- 21. Moccia AA, Donaldson J, Chhanabhai M, et al. International Prognostic Score in advanced‐stage Hodgkin's lymphoma: altered utility in the modern era. J Clin Oncol. 2012;30(27):3383–3388. [DOI] [PubMed] [Google Scholar]