

Abstract
Azilsartan medoxomil (AZL‐M) is a potent angiotensin II receptor blocker that decreases blood pressure in a dose‐dependent manner. It is a prodrug that is not detected in blood after its oral administration because of its rapid hydrolysis to the active moiety, azilsartan (AZL). AZL undergoes further metabolism to the major metabolite, M‐II, and minor metabolites. The objective of this study was to determine the effect of mild to moderate hepatic impairment on the pharmacokinetics of AZL and its major metabolite. This was a single‐center, open‐label, phase 1 parallel‐group study that examined the single‐dose (day 1) and multiple‐dose (days 4–8) — 40 mg — pharmacokinetics of AZL and M‐II in 16 subjects with mild and moderate hepatic impairment by Child‐Pugh classification (n = 8 per group) and subjects (n = 16) matched based on age, sex, race, weight, and smoking status. Mild or moderate hepatic impairment did not cause clinically meaningful increases in exposure to AZL and M‐II. Mild or moderate hepatic impairment had no clinically meaningful effect on the plasma protein binding of AZL and M‐II. Single and multiple doses of AZL‐M 40 mg were well tolerated in all subject groups. Based on the pharmacokinetic and tolerability findings, no dose adjustment of AZL‐M is required for subjects with mild and moderate hepatic impairment.
Keywords: azilsartan medoxomil, angiotensin II receptor blocker, drug metabolism, hepatic impairment, hypertension, pharmacokinetics
Even with the large number of available antihypertensive drugs across several drug classes, attaining recommended blood pressure (BP) goals continues to elude many patients with hypertension, leading most patients to enlist in a multidrug therapy regimen.1, 2, 3 Cardiovascular disease, therefore, remains a substantial health concern, and improved BP‐lowering drugs and more effective strategies for currently available antihypertensive drugs are needed.4 Angiotensin II receptor blockers (ARBs) are a drug class generally considered to be among the best tolerated and more effective agents in the realm of antihypertensives, even though there are some differences between individual drugs.5, 6, 7, 8, 9, 10 The eighth and the most recently approved drug of the ARBs is azilsartan medoxomil (AZL‐M); it is approved at doses of 20 to 80 mg once daily (40 to 80 mg in the United States), alone or in combination with other antihypertensive agents.11, 12, 13, 14, 15, 16, 17
AZL‐M is a prodrug potassium salt that is rapidly hydrolyzed to the active moiety, AZL, and is not detected in plasma after oral administration. After oral administration of AZL‐M, peak plasma concentrations of AZL are reached within 1.5 to 3 hours. AZL is highly bound to human plasma proteins (>99%), mainly serum albumin, and protein binding is constant at AZL plasma concentrations well above the range achieved with recommended doses. AZL undergoes further metabolism to AZL M‐I (M‐I), AZL M‐II (M‐II), and other minor metabolites, but neither M‐I nor M‐II has been shown to have pharmacologically relevant AT1 receptor‐binding activity in vitro. The main metabolite of AZL, M‐II, is formed by O‐dealkylation of AZL, and the cytochrome P450 2C9 isoform is primarily responsible for this conversion; systemic exposure to M‐II is approximately 50% that of AZL.11
Both renal and hepatic metabolism contribute to the elimination of AZL. This was demonstrated in a mass balance study in which, following oral administration of [14C]‐AZL‐M, approximately 97% of the dose was recovered in 14 days.18 In the mass balance study, 42% of total radioactivity was recovered in urine (46%, 38%, and 0.2% were identified as M‐II, AZL, and M‐I, respectively; the remaining 15% was unidentified metabolites), and 55% of total radioactivity was recovered in feces (48% was identified as M‐I). The elimination half‐life (t1/2) of AZL is approximately 11 hours, and renal clearance is approximately 2.3 mL/min (0.14 L/h). Steady‐state levels of AZL are achieved within 5 days, and no accumulation of AZL in plasma occurs with repeated once‐daily dosing.11
The aim of this single‐center, open‐label, parallel‐group study was to determine the effect of mild and moderate hepatic impairment (n = 16 subjects) on the single‐dose and multiple‐dose pharmacokinetic profiles of AZL and M‐II, relative to matched control subjects.
Methods
This investigation was approved by the Humans Subjects Protection Committee (institutional review board) of the University of Miami and was performed in accordance with the Declaration of Helsinki. Written informed consent was obtained directly from all participants prior to entry into the study and prior to any study procedures. This investigation was a phase 1, open‐label, parallel‐group, single‐dose, multiple‐dose study conducted at a single academic phase 1 research center that emphasizes special populations' pharmacokinetics under the direct supervision of a single principal investigator.
The study cohort comprised 32 subjects (16 control subjects and 16 subjects with mild to moderate hepatic impairment). No subjects with severe hepatic impairment were studied. Control subjects were matched with subjects with mild or moderate hepatic impairment on the basis of race, sex, age (±10 years), weight (±30%), and smoking status. Subjects were stratified into the following groups based on the Child‐Pugh classification system.
Group A: 8 subjects with mild hepatic impairment (Child‐Pugh class A);
Group B: 8 subjects with moderate hepatic impairment (Child‐Pugh class B);
Group C: 16 control subjects without hepatic impairment.
The Child‐Pugh classification system for hepatic impairment is presented in Table S1.
The study consisted of a screening period (days ‐21 to ‐2), check‐in (day ‐1), and treatment period (days 1 through 9). Subjects reported to the study site on day ‐1 and remained confined to the site through the morning of day 9. Subjects received a single 40‐mg dose of AZL‐M on day 1 (baseline). Because of the extensive metabolism of AZL‐M by liver enzymes, no medication was given on days 2 and 3. On days 4 through 8, AZL‐M 40 mg was administered once daily. Subjects fasted for a minimum of 8 hours prior to dosing and for at least 1 hour after dosing on days 1 and 8, followed by a light breakfast.
Study Participants
To be eligible for study participation, men and women were required to be between 18 and 79 years old, be capable of understanding and complying with the protocol, be willing to sign the informed consent form prior to the start of the study‐related procedures, have a body mass index between 18 and 36 kg/m2, agree to use adequate contraception throughout the study (for a female subject of childbearing potential who was sexually active), have negative test results for selected substances of abuse, including alcohol, at screening and check‐in (day ‐1) unless the positive drug screen in subjects with mild or moderate hepatic impairment was a result of prescription medication, and either be in good health or classified as having mild or moderate impairment as defined by the Child‐Pugh classification system.
Subjects were excluded if they had known hypersensitivity to AZL‐M or drugs in the ARB class, a creatinine kinase level greater than 3 times the upper limit of normal, clinically significant cardiovascular disease, pulmonary dysfunction, acute medical illness, history of alcohol or drug abuse within 1 year or 3 months for control subjects and subjects with mild or moderate hepatic impairment, respectively, and clinically significant abnormalities based on the physical examination, laboratory studies, or electrocardiogram (ECG) screening, other than those associated with chronic hepatic impairment for those subjects. Subjects with mild or moderate hepatic impairment were also excluded if they had a clinical exacerbation of liver disease within the 2‐week period before the administration of the study drug, clinically demonstrable, massive, tense ascites, evidence of acute viral hepatitis within 1 month prior to check‐in, or evidence of hepatorenal syndrome.
For control subjects, concomitant medications were prohibited without prior approval of sponsor unless it was deemed necessary in a medical emergency. For subjects with mild or moderate hepatic impairment, stable medication regimens (dose unchanged for 28 days prior to check‐in/day ‐1) were allowed for spironolactone, insulin, and oral hypoglycemic agents. Mildly or moderately hepatically impaired subjects on additional stable medication regimens were considered for enrollment on a case‐by‐case basis.
Bioanalytical Methods
Blood and urine samples were obtained at points up to 72 hours after the dose on day 1 and up to 24 hours after the dose on day 8 to determine the concentrations of the potassium salt‐free form of AZL‐M (AZL‐M‐F), AZL, and M‐II. Additional blood samples were collected on day 1 at approximately the time to reach the maximum plasma concentration (tmax) of AZL and M‐II to determine plasma protein binding and before dosing on days 5–7 to determine time to steady state. All blood samples were collected in chilled 6‐mL tubes containing potassium ethylenediaminetetraacetic acid and centrifuged and the plasma then removed; all samples were stored at approximately ‐70°C or lower. Urine samples were stored at approximately 4°C during the collection interval and stirred before the volume was measured; two 10‐mL aliquots were then placed in containers and stored frozen at approximately ‐20°C or lower.
All collected samples were analyzed using liquid chromatography–tandem mass spectrometry (LC‐MS/MS). A single internal standard was used for all samples and analytes.
For the determination of AZL‐M‐F in plasma, the samples were acidified, and the internal standard was added. AZL‐M‐F and the internal standard were then extracted using OASIS HLB, 96‐well solid‐phase extraction plates (Waters, Milford, Massachusetts). For the determination of AZL and M‐II in plasma, 2% acetic acid in acetonitrile solution with the internal standard was added to the samples for protein precipitation. For the samples for plasma protein‐binding determination, plasma ultrafiltrate was prepared by adding plasma on the top tube of a Centrifree YM‐30 ultrafiltration device (EMD Millipore, Billerica, Massachusetts). Once the samples were centrifuged at room temperature, the ultrafiltrate was collected in the bottom cup. For the determination of AZL and M‐II in the ultrafiltrate, 0.1% acetic acid in acetonitrile with the internal standard was added to the samples. After centrifugation, 0.1% acetic acid in water was added to the samples for a 2:3 dilution.
For the determination of AZL and M‐II in urine, 0.1% acetic acid in methanol with the internal standard was added to the samples for a 1:6 dilution. After mixing, another aliquot of 0.1% acetic acid in methanol was added to the samples.
For AZL‐M‐F in plasma, LC separation was obtained using an Xterra RP18 column (Waters; 250 mm × 2.1 mm, 5 μm). The mobile phase consisted of an acetonitrile:water:acetic acid gradient (60:40:0.05, v:v:v)/acetonitrile and was pumped through the column at a flow rate of 0.2 mL/min. For AZL and M‐II in the other samples, LC separation was obtained using a Chromolith SpeedROD RP‐18e column (EMD Millipore; 50‐4.6 [4.6 mm, 2μm]). The mobile phase consisted of a gradient 0.1% acetic acid in water/0.1% acetic acid in methanol and was pumped through the column at a flow rate of 2 mL/min (plasma and urine) or 1.5 mL/min (ultrafiltrate).
For detection, an API 3000 or 4000 mass spectrometer (AB Sciex, Framingham, Massachusetts) with positive ion electrospray was used in multiple reaction monitoring mode. The LC‐MS/MS assay range, accuracy, and precision for the samples in this study are shown in Table S2.
Pharmacokinetics
AZL‐M is hydrolyzed to AZL, the active metabolite, in the gastrointestinal tract during absorption and is not detected in plasma after oral administration.11 The focus of this pharmacokinetic evaluation was on the active moiety, AZL, and its major metabolite, M‐II.
Groups A–C comprised subjects with mild or moderate hepatic impairment and matched control subjects. For each subject, the following single‐ and multiple‐dose pharmacokinetic parameters were derived from the total plasma and urine concentrations of AZL and M‐II on days 1 and 8 unless otherwise noted: area under the plasma concentration–time curve (AUC) from time 0 extrapolated to infinity (AUC∞; day 1 only), AUC from time 0 to tau (AUCτ) over a dosing interval, where τ was the length of the dosing interval (τ = 24 hours; day 8 only), AUC from time 0 to 24 hours (AUC24; day 1 only), maximum observed plasma concentration (Cmax), tmax, terminal elimination rate constant (λz; day 1 only), termination t1/2 (day 1 only), fraction of AZL and M‐II with molecular‐weight adjustment from AZL‐M excreted in urine from 0 to 72 hours on day 1 or 0 to 24 hours on day 8 (fe/F), total amount of AZL or M‐II excreted in urine over the collection interval postdose (Aet), calculated for the metabolite individually, where t = 72 on day 1 or 24 on day 8; renal clearance (CLR) of AZL and M‐II, calculated as total amount of drug excreted in urine from 0 to 72 hours on day 1 or total amount of drug excreted in urine from 0 to 24 hours on day 8 divided by AUC∞ on day 1 or AUCτ on day 8.
Safety
Safety assessments were made at screening, day ‐1, and days 1–9 of inpatient confinement. Safety variables included adverse event monitoring, serial clinical laboratory testing (hematology, serum chemistry, urinalysis), vital sign measurements, 12‐lead ECGs, and physical examination findings.
Statistical Methods
The sample size chosen for this study was based on precedent set by other pharmacokinetic studies conducted in subjects with mild or moderate hepatic impairment of a similar nature and not based on statistical considerations. Descriptive statistics (mean, standard deviation [SD], standard error of the mean [SE], % CV, median, minimum, and maximum) were used to summarize the plasma and urine pharmacokinetic parameters for AZL and M‐II by subject groups. In addition, geometric means were computed for AUC∞, AUCτ, and Cmax.
An analysis of covariance (ANCOVA) with a fixed effect for subject group and body weight as a covariate was performed on natural logarithms of AUC∞ and Cmax for single dosing and natural logarithms of AUCτ and Cmax for multiple dosing. Within the framework of ANCOVA, comparisons of mild or moderate hepatic impairment group versus the corresponding matched normal group were performed.
The 90% confidence intervals of the least‐squares (LS) mean ratios for subjects with mild or moderate hepatic impairment versus matched control subjects (eg, AUC∞, mild/AUC∞, control) were provided for AUC∞, AUCτ, and Cmax. The 90% confidence intervals were obtained by taking the antilog of the 90% confidence intervals for the difference between the LS means on the log scale.
The natural logarithms of predose concentrations of AZL on days 5, 6, 7, and 8 were analyzed to assess the achievement of steady state. An analysis of variance model with fixed effects for subject group, day, and subject nested within subject group as a random effect was performed. Within the model, a pairwise t test was used to assess the achievement of steady state by comparing the predose plasma concentrations between study days.
All data analyses were performed using SAS, version 9.1 (SAS Institute, Inc., Cary, North Carolina). Pharmacokinetic parameters were derived using noncompartmental methods with WinNonlin Professional version 5.1 (Pharsight Corporation, Mountain View, California).
Results
A total of 32 subjects (mean age, 56.4 years) including 16 men and 16 women were enrolled in the study; all 32 subjects completed the study. Eight subjects had mild hepatic impairment, 8 subjects had moderate hepatic impairment, and 16 subjects were matched controls. Baseline and demographic characteristics of the 32 enrolled subjects are shown in Table 1.
Table 1.
Summary of Demographic and Baseline Characteristics
| Mild Hepatic Impairment (n = 8) | Match for Mild Impairment (n = 8) | Moderate Hepatic Impairment (n = 8) | Match for Moderate Impairment (n = 8) | Overall (n = 32) | |
|---|---|---|---|---|---|
| Sex, n (%) | |||||
| Male | 4 (50.0) | 4 (50.0) | 4 (50.0) | 4 (50.0) | 16 (50.0) |
| Female | 4 (50.0) | 4 (50.0) | 4 (50.0) | 4 (50.0) | 16 (50.0) |
| Mean age (y) ± SD | 58.1 ± 7.70 | 54.0 ± 6.05 | 59.4 ± 6.16 | 54.1 ± 7.45 | 56.4 ± 6.97 |
| Ethnicity, n (%) | |||||
| Hispanic or Latino | 4 (50.0) | 8 (100.0) | 5 (62.5) | 8 (100.0) | 25 (78.1) |
| Not Hispanic or Latino | 4 (50.0) | 0 (0.0) | 3 (37.5) | 0 (0.0) | 7 (21.9) |
| Race, n (%) | |||||
| White | 8 (100.0) | 8 (100.0) | 8 (100.0) | 8 (100.0) | 32 (100.0) |
| Mean height (cm) ± SD | 166.4 ± 9.07 | 165.1 ± 7.10 | 166.0 ± 10.24 | 165.0 ± 11.69 | 165.6 ± 9.21 |
| Mean weight (kg) ± SD | 76.5 ± 17.48 | 76.1 ± 8.74 | 84.9 ± 20.79 | 76.8 ± 12.62 | 78.6 ± 15.29 |
| Mean BMI (kg/m2) ± SD | 27.6 ± 5.90 | 28.0 ± 3.36 | 30.5 ± 5.48 | 29.0 ± 2.10 | 28.5 ± 4.41 |
| Female reproductive status, n (%) | |||||
| Postmenopausal | 3 (37.5) | 3 (37.5) | 3 (37.5) | 1 (12.5) | 10 (31.3) |
| Surgically sterile | 1 (12.5) | 1 (12.5) | 1 (12.5) | 2 (25.0) | 5 (15.6) |
| Woman of childbearing potential | 0 (0.0) | 0 (0.0) | 0 (0.0) | 1 (12.5) | 1 (3.1) |
| N/A (male subject) | 4 (50.0) | 4 (50.0) | 4 (50.0) | 4 (50.0) | 16 (50.0) |
| Smoking history, n (%) | |||||
| Never smoked | 1 (12.5) | 1 (12.5) | 3 (37.5) | 3 (37.5) | 8 (25.0) |
| Current smoker | 5 (62.5) | 5 (62.5) | 5 (62.5) | 5 (62.5) | 20 (62.5) |
| Ex‐smoker | 2 (25.0) | 2 (25.0) | 0 (0.0) | 0 (0.0) | 4 (12.5) |
| No alcohol consumption, n (%) | 8 (100.0) | 8 (100.0) | 8 (100.0) | 8 (100.0) | 32 (100.0) |
| Caffeine consumption, n (%) | 8 (100.0) | 8 (100.0) | 8 (100.0) | 8 (100.0) | 32 (100.0) |
BMI, body mass index; NA, not applicable; SD, standard deviation.
None of the control subjects or those with mild or moderate hepatic impairment had detectable concentrations of AZL‐M‐F in plasma, indicating that mild or moderate hepatic impairment did not have any effect on the rapid hydrolysis of AZL‐M. Because there were no detectable concentrations, pharmacokinetic parameters were not determined.
Pharmacokinetics
Mean AZL and M‐II plasma concentrations versus time for both single and multiple dosing are provided in Figures 1 and 2. The AZL and M‐II plasma‐concentrations‐over‐time profiles were equal or slightly greater among subjects with mild or moderate hepatic impairment than in the matched controls on day 1 and day 8. Following the statistical analysis of the predose concentrations of AZL, steady‐state concentrations were established on day 6 for subjects with mild or moderate hepatic impairment and on day 7 for the matched control subjects.
Figure 1.
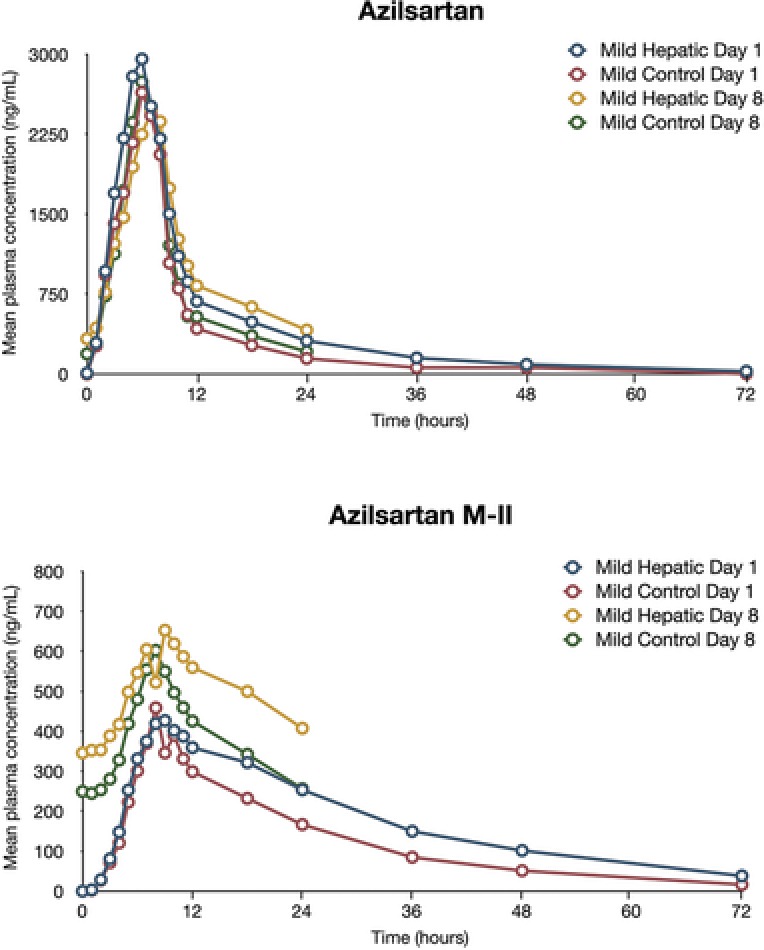
Mean plasma concentrations of azilsartan and azilsartan M‐II (major metabolite of azilsartan) in subjects with mild hepatic impairment and matched control subjects.
Figure 2.
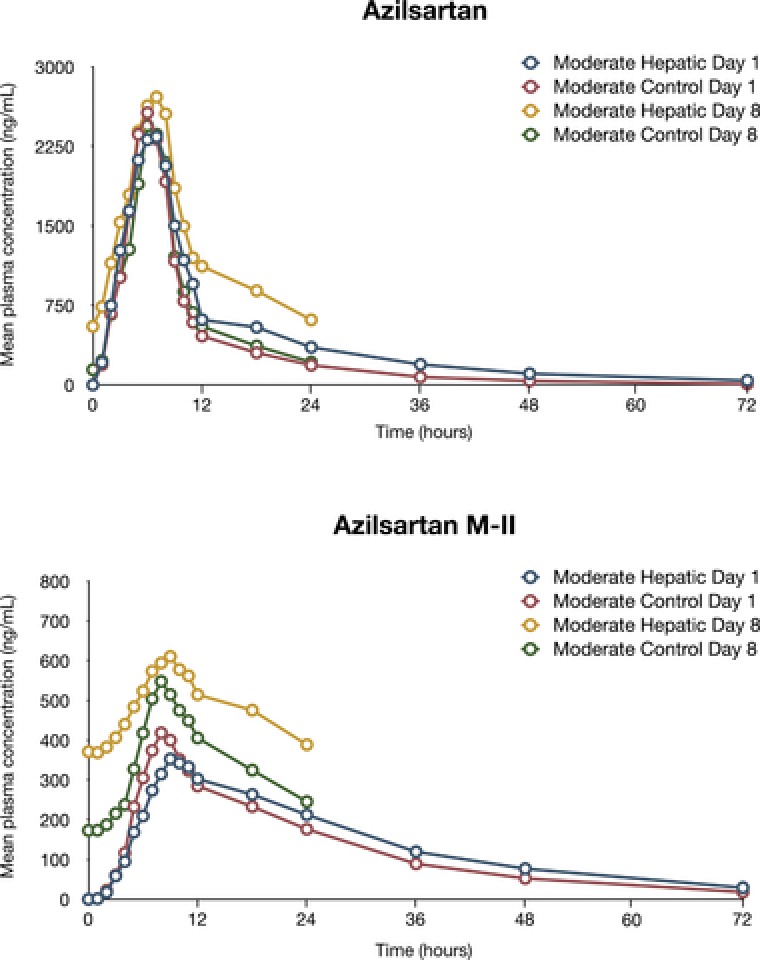
Mean plasma concentrations of azilsartan and azilsartan M‐II (major metabolite of azilsartan) in subjects with moderate hepatic impairment and matched control subjects.
Mild or moderate hepatic impairment did not have an effect on the extensive metabolism of AZL (Tables 2 and 3 and Table S3). In all subject groups, AZL was extensively metabolized (<10% of the dose was recovered as AZL in the urine of control subjects, and <16% of the dose was recovered as AZL in the urine of subjects with mild or moderate hepatic impairment). AZL renal clearance and urinary excretion were increased in subjects with mild or moderate hepatic impairment compared with matched control subjects; AZL t1/2 values were comparable in the groups (11 hours for control subjects vs 13–14 hours for subjects with mild or moderate hepatic impairment). Median tmax in the mild or moderate hepatic impairment groups was 2 hours on day 1 and 3 hours on day 8 and was similar to the median tmax in the matched‐control group (2 hours on days 1 and 8).
Table 2.
Effect of Mild Hepatic Impairment on AZL and M‐II
| Mild Hepatic Impairment LS Mean (n = 8) | Matched Control LS Mean (n = 8) | LS Mean Ratio Mild/Control | 90%CI for Ratioa | |
|---|---|---|---|---|
| AZL, day 1 | ||||
| AUC∞ (ng·h/mL) | 28 646.89 | 20 513.61 | 139.65 | (107.59–181.26) |
| Cmax (ng/mL) | 3018.72 | 2698.40 | 111.87 | (90.94–137.62) |
| tmax (h)b | 2.00 (1.50, 4.00) | 2.00 (1.50, 3.00) | n/a | n/a |
| t1/2 (h)c | 13.29 (23) | 11.01 (13) | n/a | n/a |
| AZL, day 8 | ||||
| AUCτ (ng·h/mL) | 24 610.20 | 19 238.97 | 127.92 | (99.84–163.89) |
| Cmax (ng/mL) | 2609.97 | 2826.70 | 92.33 | (75.87–112.37) |
| tmax (h)b | 3.00 (2.00, 4.00) | 2.00 (1.00, 3.00) | n/a | n/a |
| M‐II, day 1 | ||||
| AUC∞ (ng·h/mL) | 13 927.16 | 9948.21 | 140.00 | (106.59–183.88) |
| Cmax (ng/mL) | 426.75 | 451.71 | 94.48 | (70.33–126.90) |
| tmax (h)b | 6.00 (4.00, 12.00) | 5.00 (2.00, 8.00) | n/a | n/a |
| t1/2 (h)c | 17.54 (33) | 14.88 (15) | n/a | n/a |
| M‐II, day 8 | ||||
| AUCτ (ng·h/mL) | 11 895.35 | 9348.35 | 127.25 | (95.53–169.49) |
| Cmax (ng/mL) | 648.49 | 590.77 | 109.77 | (84.70–142.26) |
| tmax (h)b | 6.00 (3.00, 12.00) | 4.00 (3.00, 6.00) | n/a | n/a |
AUC∞, area under the plasma concentration–time curve from time 0 extrapolated to infinity; AUCτ, area under the plasma concentration–time curve from time 0 to tau; AZL, azilsartan; CI, confidence interval; Cmax, maximum observed plasma concentration; LS, least squares; M‐II, major metabolite of AZL; t1/2, elimination half‐life; tmax, time to reach the maximum plasma concentration.
Antilog of natural logarithmic scale 90%CI test‐reference mean difference, expressed as percentage.
Data for tmax are presented as median (minimum, maximum).
Data for t1/2 are presented as arithmetic mean (% coefficient of variation).
Table 3.
Effect of Moderate Hepatic Impairment on AZL and M‐II
| Moderate Hepatic Impairment LS Mean (n = 8) | Matched Control LS Mean (n = 8) | LS Mean Ratio Mild/Control | 90%CI for Ratioa | |
|---|---|---|---|---|
| AZL, day 1 | ||||
| AUC∞ (ng·h/mL) | 29 147.51 | 18 878.56 | 154.39 | (109.06–218.58) |
| Cmax (ng/mL) | 2590.56 | 2558.01 | 101.27 | (82.24–124.71) |
| tmax (h)b | 2.00 (1.00, 3.00) | 2.00 (1.50, 3.00) | n/a | n/a |
| t1/2 (h)c | 14.20 (30) | 11.29 (29) | n/a | n/a |
| AZL, day 8 | ||||
| AUCτ (ng·h/mL) | 29 568.73 | 17 986.00 | 164.40 | (119.45–226.26) |
| Cmax (ng/mL) | 2821.71 | 2392.49 | 117.94 | (91.26–152.41) |
| tmax (h)b | 3.00 (1.50, 4.00) | 2.00 (1.50, 4.00) | n/a | n/a |
| M‐II, day 1 | ||||
| AUC∞ (ng·h/mL) | 10 988.60 | 8867.69 | 123.92 | (80.24–191.38) |
| Cmax (ng/mL) | 324.55 | 366.58 | 88.54 | (54.12–144.83) |
| tmax (h)b | 7.00 (2.00, 10.00) | 4.00 (3.00, 6.00) | n/a | n/a |
| t1/2 (h)c | 18.08 (27) | 15.19 (15) | n/a | n/a |
| M‐II, day 8 | ||||
| AUCτ (ng·h/mL) | 11 550.27 | 8503.60 | 135.83 | (97.08–190.05) |
| Cmax (ng/mL) | 617.46 | 520.35 | 118.66 | (84.01–167.61) |
| tmax (h)b | 6.00 (2.00, 8.00) | 4.00 (3.00, 8.00) | n/a | n/a |
AUC∞, area under the plasma concentration–time curve from time 0 extrapolated to infinity; AUCτ, area under the plasma concentration–time curve from time 0 to tau; AZL, azilsartan; CI, confidence interval; Cmax, maximum observed plasma concentration; LS, least squares; M‐II, major metabolite of AZL; t1/2, elimination half‐life; tmax, time to reach the maximum plasma concentration.
Antilog of natural logarithmic scale 90% CI test‐reference mean difference, expressed as percentage.
Data for tmax are presented as median (minimum, maximum).
Data for t1/2 are presented as arithmetic mean (% coefficient of variation).
M‐II plasma exposures in subjects with mild or moderate hepatic impairment were greater (nonequivalent) than those observed in matched control subjects. M‐II t1/2 values were comparable in subject groups (15 hours for control subjects vs 18 hours for subjects with mild or moderate hepatic impairment), and renal clearance and excretion of M‐II were increased among subjects with mild or moderate hepatic impairment relative to the matched control subjects. Median tmax of M‐II in the mild or moderate hepatic impairment groups was 6–7 hours on day 1 and day 8 and was similar to the median tmax in the matched‐control group (4–5 hours on days 1 and 8).
Mild Hepatic Impairment
Relative to matched controls, AZL AUC∞ increased by 40% and Cmax increased by 12% in the mild hepatic impairment group (Child‐Pugh class A) following a single dose of AZL‐M. After administration of multiple doses of AZL‐M, AZL AUCτ increased by 28% and Cmax decreased by 8% in the mild hepatic impairment group relative to matched control subjects. The M‐II AUC∞ also increased by 40% and Cmax decreased by 6% in the mild hepatic impairment group relative to the matched control subjects following a single dose of AZL‐M. After administration of multiple doses of AZL‐M, M‐II AUCτ increased by 27% and Cmax increased by 10% in the mild hepatic impairment group relative to matched control subjects. From the equivalence testing, all AUC and Cmax values in the mild hepatic impairment group and the matched controls were nonequivalent. Figures 3 and 4 depict the AUC24 of AZL and M‐II, respectively, in subjects with mild or moderate hepatic impairment and the matched control subjects.
Figure 3.
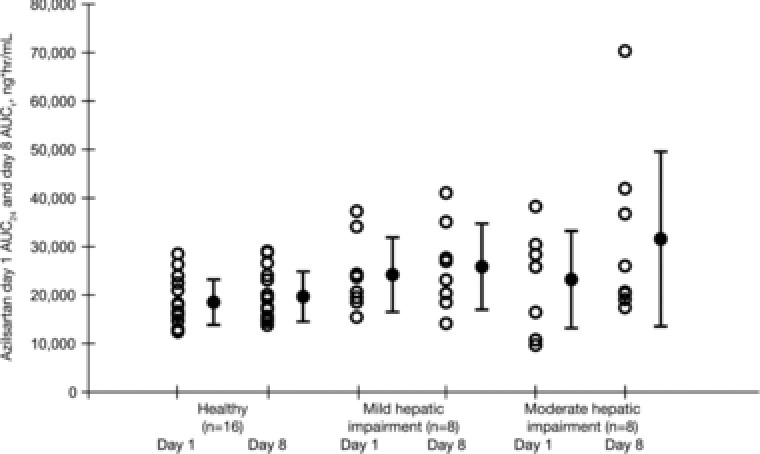
Individual and mean (SD) AUC24 of azilsartan in matched control subjects and in subjects with mild or moderate hepatic impairment following single and multiple 40‐mg doses of azilsartan medoxomil. AUC24, area under the plasma concentration–time curve from time 0 to 24 hours; AUCτ, area under the plasma concentration–time curve from time 0 to tau; SD, standard deviation.
Figure 4.
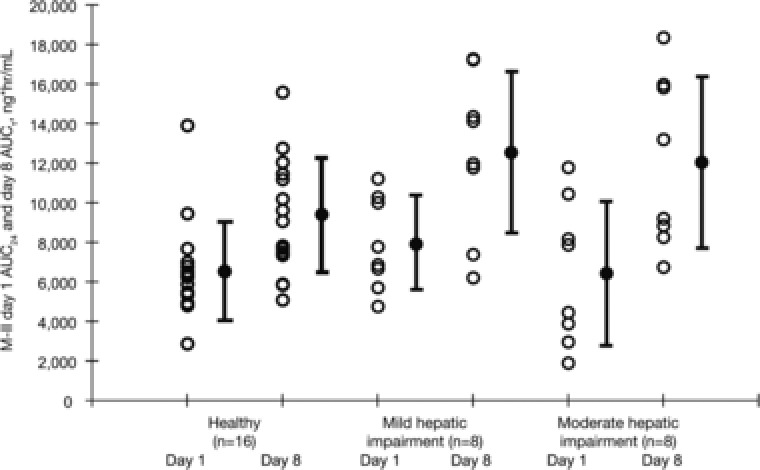
Individual and mean (SD) AUC24 of M‐II in matched control subjects and in subjects with mild or moderate hepatic impairment following single and multiple 40‐mg doses of azilsartan medoxomil. AUC24, area under the plasma concentration–time curve from time 0 to 24 hours; AUCτ, area under the plasma concentration–time curve from time 0 to tau; M‐II, major metabolite of azilsartan; SD, standard deviation.
Moderate Hepatic Impairment
Relative to matched controls, AZL AUC∞ increased by 54% and Cmax increased by 1% in the moderate hepatic impairment group (Child‐Pugh class B) following a single dose of AZL‐M. After administration of multiple doses of AZL‐M, AZL AUCτ increased by 64% and Cmax increased by 18% in the moderate hepatic impairment group relative to the matched controls. The M‐II AUC∞ increased by 24% and Cmax decreased by 19% in the moderate hepatic impairment group following a single dose of AZL‐M relative to the matched controls. After administration of multiple doses of AZL‐M, M‐II AUCτ increased by 36% and Cmax increased by 19% in the moderate hepatic impairment group relative to the matched controls. From the equivalence testing, all AUC and Cmax values — except day 1 AZL Cmax — in the moderate hepatic impairment group and the matched controls were nonequivalent.
Effect of Mild or Moderate Hepatic Impairment on Protein Binding
The ratios of the unbound fraction of AZL and M‐II to total were 0 and <0.02, respectively, at each time for all subjects in the mild to moderate hepatic impairment study. Therefore, after accounting for assay sensitivity, protein binding was estimated to be >99.8% for all subjects in this study.
Treatment‐Emergent Adverse Events
Administration of AZL‐M was well tolerated among subjects with mild or moderate hepatic impairment and control subjects. The overall incidence of adverse events was low (6 subjects, 19%), and all reported adverse events were mild in severity (Table 4). Incidence of adverse events tended to be slightly higher among subjects with mild or moderate hepatic impairment relative to matched controls (≤3 subjects with impairment vs ≤1 control subject). The only adverse event reported by more than 1 subject was asthenia (2 subjects with moderate hepatic impairment). Adverse events considered to have a possible or probable relationship to study medication were asthenia in the moderate hepatic impairment group and an increase in potassium in the mild hepatic impairment group. No adverse events causing withdrawal or serious adverse events were reported. Administration of AZL‐M did not have a clinically significant effect on clinical laboratory findings (chemistry, hematology, or urinalysis), vital signs, or ECGs in control subjects or in those with mild or moderate hepatic impairment.
Table 4.
Incidence (n [%]) of Individual Adverse Events
| Mild Hepatic Impairment (n = 8) | Mild Control (n = 8) | Moderate Hepatic Impairment (n = 8) | Moderate Control (n = 8) | |
|---|---|---|---|---|
| Gastrointestinal disorders | ||||
| Abdominal pain | 0 | 0 | 0 | 1 (12.5) |
| Diarrhea | 1 (12.5) | 0 | 0 | 0 |
| General disorders and administration site conditions | ||||
| Asthenia | 0 | 0 | 2 (25.0) | 0 |
| Infections and infestations | ||||
| Nasopharyngitis | 0 | 0 | 1 (12.5) | 0 |
| Investigations | ||||
| Blood potassium increased | 1 (12.5) | 0 | 0 | 0 |
| Urine analysis abnormal | 1 (12.5) | 0 | 0 | 0 |
Discussion
The pharmacokinetics of AZL derived from the AZL‐M prodrug have been studied in several special populations including subjects with mild, moderate, or severe renal impairment or end‐stage renal disease, pediatric subjects with hypertension, and elderly subjects (65–85 years). The differences in the pharmacokinetics of AZL between the sexes and races (white and black) have also been examined. These studies revealed no clinically significant differences in AZL exposure for these populations.19, 20, 21
In this single‐center, open‐label, parallel‐group study in 32 subjects with mild to moderate hepatic impairment, the single‐dose and multiple‐dose pharmacokinetic profiles of AZL and its metabolite M‐II were studied. Subjects with mild or moderate hepatic impairment did have increases in mean plasma exposure to AZL of up to 64% and to M‐II of up to 40% compared with matched control subjects. AZL‐M has a wide safety margin, as similar tolerability profiles have been observed in clinical studies with the 40‐ and 80‐mg doses11; therefore, the increases in exposure in subjects with mild to moderate hepatic impairment are not considered clinically meaningful. Other drugs in the class, notably valsartan and olmesartan medoxomil, had increases in exposure in subjects with hepatic impairment22, 23; subjects with mild to moderate hepatic impairment had increases in mean plasma exposure to valsartan of approximately 2‐fold and to olmesartan of up to 48% relative to matched control subjects. Also, healthy subjects have tolerated single and multiple doses of up to 320 mg AZL‐M.11
Subjects with mild or moderate hepatic impairment had increased renal clearance and urinary excretion of AZL and M‐II compared with matched control subjects; these increases suggest that renal clearance of AZL can compensate, at least in part, for reduced hepatobiliary secretion in hepatic impairment.24, 25 Administration of AZL‐M 40 mg was well tolerated in subjects with mild or moderate hepatic impairment.
Conclusion
Based on our study, we conclude that no starting dose adjustment for AZL‐M is necessary in subjects with mild to moderate hepatic impairment.
Supporting information
Figure S1
Figure S2
Figure S3
Acknowledgments
BlueMomentum, an Ashfield Company, assisted the authors with responses to journal comments and final revisions and was funded by Takeda Development Center Americas, Inc. Sam Schmitt, of Extenxion Media Group, LLC, revised and produced high‐resolution figures and was funded by Takeda Development Center Americas, Inc. The original submitted manuscript draft was written by the authors without medical writing assistance.
Declaration of Conflicting Interests
Z.Z. is an employee of Takeda. C.D. and A.K. were employees of Takeda during the time the research was conducted. R.A.P. received a research grant from Takeda and has a consulting agreement with Mitsubishi Tanabe Pharma Development America Inc. D.G. and A.B.A. have no conflicts of interest to report.
Funding
This study was sponsored by Takeda Development Center Americas, Inc.
Caroline Dudkowski and Aziz Karim were employees of Takeda during the time the research was conducted.
References
- 1. Perez A, Cao C. The impact of azilsartan medoxomil treatment (capsule formulation) at doses ranging from 10 to 80 mg: significant, rapid reductions in clinic diastolic and systolic blood pressure. J Clin Hypertens (Greenwich). 2017;19:312–321. [DOI] [PMC free article] [PubMed] [Google Scholar]
- 2. Gradman AH. Rationale for triple‐combination therapy for management of high blood pressure. J Clin Hypertens (Greenwich). 2010;12:869–878. [DOI] [PMC free article] [PubMed] [Google Scholar]
- 3. Gradman AH, Basile JN, Carter BL, et al. Combination therapy in hypertension. J Am Soc Hypertens. 2010;4:90–98. [DOI] [PubMed] [Google Scholar]
- 4. Rapsomaniki E, Timmis A, George J, et al. Blood pressure and incidence of twelve cardiovascular diseases: lifetime risks, healthy life‐years lost, and age‐specific associations in 1.25 million people. Lancet. 2014;383:1899–1911. [DOI] [PMC free article] [PubMed] [Google Scholar]
- 5. Mazzolai L, Burnier M. Comparative safety and tolerability of angiotensin II receptor antagonists. Drug Saf. 1999;21:23–33. [DOI] [PubMed] [Google Scholar]
- 6. Ross SD, Akhras KS, Zhang S, et al. Discontinuation of antihypertensive drugs due to adverse events: a systematic review and meta‐analysis. Pharmacotherapy. 2001;21:940–953. [DOI] [PubMed] [Google Scholar]
- 7. Elliott WJ, Plauschinat CA, Skrepnek GH, Gause D. Persistence, adherence, and risk of discontinuation associated with commonly prescribed antihypertensive drug monotherapies. J Am Board Fam Med. 2007;20:72–80. [DOI] [PubMed] [Google Scholar]
- 8. Smith DH. Comparison of angiotensin II type 1 receptor antagonists in the treatment of essential hypertension. Drugs. 2008;68:1207–1225. [DOI] [PubMed] [Google Scholar]
- 9. Taylor AA, Siragy H, Nesbitt S. Angiotensin receptor blockers: pharmacology, efficacy, and safety. J Clin Hypertens (Greenwich). 2011;13:677–686. [DOI] [PMC free article] [PubMed] [Google Scholar]
- 10. Siragy HM. A current evaluation of the safety of angiotensin receptor blockers and direct renin inhibitors. Vasc Health Risk Manag. 2011;7:297–313. [DOI] [PMC free article] [PubMed] [Google Scholar]
- 11. Edarbi (Azilsartan Medoxomil) Tablets . U.S. prescribing information. Atlanta, GA: Arbor Pharmaceuticals, LLC; 2014. http://www.accessdata.fda.gov/drugsatfda_docs/label/2014/200796s006lbl.pdf. Accessed January 17, 2017.
- 12. Edarbi (Azilsartan Medoxomil) Tablets . Summary of product characteristics. Taastrup, Denmark: Takeda Pharma A/S; 2014. http://www.ema.europa.eu/docs/en_GB/document_library/EPAR_-_Product_Information/human/002293/WC500119204.pdf. Accessed February 2, 2017.
- 13. Jones JD, Jackson SH, Agboton C, Martin TS. Azilsartan medoxomil (edarbi): the eighth angiotensin II receptor blocker. P T. 2011;36:634–640. [PMC free article] [PubMed] [Google Scholar]
- 14. Angeli F, Verdecchia P, Pascucci C, et al. Pharmacokinetic evaluation and clinical utility of azilsartan medoxomil for the treatment of hypertension. Expert Opin Drug Metab Toxicol. 2013;9:379–385. [DOI] [PubMed] [Google Scholar]
- 15. Baker WL, White WB. Azilsartan medoxomil: a new angiotensin II receptor antagonist for treatment of hypertension. Ann Pharmacother. 2011;45:1506–1515. [DOI] [PubMed] [Google Scholar]
- 16. Perry CM. Azilsartan medoxomil: a review of its use in hypertension. Clin Drug Investig. 2012;32:621–639. [DOI] [PubMed] [Google Scholar]
- 17. Zaiken K, Cheng JW. Azilsartan medoxomil: a new angiotensin receptor blocker. Clin Ther. 2011;33:1577–1589. [DOI] [PubMed] [Google Scholar]
- 18. FDA Summary Basis of Approval (NDA 200–796) . Azilsartan medoxomil. Center for Drug Evaluation and Research. Application number: 200796Orig1s000. https://www.accessdata.fda.gov/drugsatfda_docs/nda/2011/200796Orig1s000ClinPharmR.pdf. Accessed May 22, 2017.
- 19. Preston RA, Karim A, Dudkowski C, et al. Single center evaluation of the single‐dose pharmacokinetics of the angiotensin II receptor antagonist azilsartan medoxomil in renal impairment. Clin Pharmacokinet. 2013;52:347–358. [DOI] [PubMed] [Google Scholar]
- 20. Webb NJ, Wells T, Tsai M, et al. Single‐dose pharmacokinetics and safety of azilsartan medoxomil in children and adolescents with hypertension as compared to healthy adults. Eur J Clin Pharmacol. 2016;72:447–457. [DOI] [PMC free article] [PubMed] [Google Scholar]
- 21. Harrell RE, Karim A, Zhang W, Dudkowski C. Effects of age, sex, and race on the safety and pharmacokinetics of single and multiple doses of azilsartan medoxomil in healthy subjects. Clin Pharmacokinet. 2016;55:595–604. [DOI] [PMC free article] [PubMed] [Google Scholar]
- 22. Brookman LJ, Rolan PE, Benjamin IS, et al. Pharmacokinetics of valsartan in patients with liver disease. Clin Pharmacol Ther. 1997;62:272–278. [DOI] [PubMed] [Google Scholar]
- 23. von Bergmann K, Laeis P, Püchler K, et al. Olmesartan medoxomil: influence of age, renal and hepatic function on the pharmacokinetics of olmesartan medoxomil. J Hypertens Suppl. 2001;19:S33–S40. [DOI] [PubMed] [Google Scholar]
- 24. Fleck CH, Schultz M, Seidel D, et al. Relation between renal and hepatic excretion of drugs: X. Excretion of nalorphine in young and adult rats pretreated with hormones or xenobiotics. Exp Pathol. 1988;34:171–180. [DOI] [PubMed] [Google Scholar]
- 25. Brandoni A, Quaglia NB, Torres AM. Compensation increase in organic anion excretion in rats with acute biliary obstruction: role of the renal organic anion transporter 1. Pharmacology. 2003;68:57–63. [DOI] [PubMed] [Google Scholar]
Associated Data
This section collects any data citations, data availability statements, or supplementary materials included in this article.
Supplementary Materials
Figure S1
Figure S2
Figure S3