

Abstract
Background
Computational pathology platforms incorporate digital microscopy with sophisticated image analysis to permit rapid, continuous measurement of protein expression. We compared two computational pathology platforms on their measurement of breast tumor estrogen receptor (ER) and progesterone receptor (PR) expression.
Methods
Breast tumor microarrays from the Nurses’ Health Study were stained for ER (n=592) and PR (n=187). One expert pathologist scored cases as positive if ≥1% of tumor nuclei exhibited stain. ER and PR were then measured with the Definiens Tissue Studio (automated) and Aperio Digital Pathology (user-supervised) platforms. Platform-specific measurements were compared using boxplots, scatter plots, and correlation statistics. Classification of ER and PR positivity by platform-specific measurements was evaluated with areas under receiver operating characteristic curves (AUC) from univariable logistic regression models, using expert pathologist classification as the standard.
Results
Both platforms showed considerable overlap in continuous measurements of ER and PR between positive and negative groups classified by expert pathologist. Platform-specific measurements were strongly and positively correlated with one another (rho≥0.77). The user-supervised Aperio workflow performed slightly better than the automated Definiens workflow at classifying ER positivity (AUCAperio=0.97; AUCDefiniens=0.90; difference=0.07, 95% CI: 0.05, 0.09) and PR positivity (AUCAperio=0.94; AUCDefiniens=0.87; difference=0.07, 95% CI: 0.03, 0.12).
Conclusion
Paired hormone receptor expression measurements from two different computational pathology platforms agreed well with one another. The user-supervised workflow yielded better classification accuracy than the automated workflow. Appropriately validated computational pathology algorithms enrich molecular epidemiology studies with continuous protein expression data and may accelerate tumor biomarker discovery.
Keywords: Breast neoplasms, receptors, estrogen, receptors, progesterone, pathology, molecular, biology, computational
INTRODUCTION
Cancer epidemiologists increasingly rely on high-throughput measurement of host and tumor molecular characteristics in large study populations. Expression of proteins in breast tumor tissue is an essential facet of molecular characterization for both clinical and research purposes (1, 2). For example, immunohistochemical staining of breast tumors for estrogen receptor (ER) identifies patients who will benefit from adjuvant anti-estrogen therapy (3). Assessment of ER in combination with progesterone receptor (PR), human epidermal growth factor receptor 2 (HER2), cytokeratin 5/6, and epidermal growth factor receptor permits epidemiologists to explore how risk factor associations differ for breast cancer molecular subtypes (4). Unfortunately, characterization of tumor protein expression largely relies upon manual interpretation by trained pathologists, at the cost of significant time expenditure and inevitable inter-reader variability. Furthermore, workloads are often multiplied by the necessity of evaluating several protein targets at once. Pathologist evaluation of tumor protein expression has therefore become a rate-limiting step in modern molecular epidemiology studies. A potential solution to this problem is the adoption of computational pathology systems that incorporate digital microscopy with quantitative image analysis software (5). We compared the performance of two such systems in measuring breast tumor expression of ER and PR on continuous scales, compared with readings by a single expert pathologist.
MATERIALS AND METHODS
Study population
We compared performance of the Aperio and Definiens computational pathology systems by measuring expression of ER and PR in formalin-fixed, paraffin-embedded (FFPE) tumor tissues from breast cancer cases in the Nurses’ Health Study cohort (NHS). The NHS is thoroughly described elsewhere (6). Since 1993 tumor tissue has been requested from pathology departments at treating hospitals for NHS breast cancer cases without a history of another malignancy (except non-melanoma skin cancer). Of the 10,988 cases eligible for collection, tumor blocks and pathology data have been obtained for 6,591. For each breast cancer case, three 0.6-mm tumor cores were placed into one of 38 tissue microarrays (TMAs) for immunohistochemical (IHC) assays. Many more of these cases have been evaluated with the Definiens system than with the Aperio system. For the present study, 5 of the breast tumor TMAs (n=592 cases, representing the intersection between cases evaluated with Definiens and cases evaluated with Aperio) were evaluated for ER expression; 3 of these 5 TMAs (n=187) were also evaluated for PR expression.
Immunohistochemistry for hormone receptors and expert pathologist review
IHC assays for ER and PR were performed on 5-μm sections cut from the breast cancer TMAs. Before staining, paraffin was removed by serial xylene treatment followed by rehydration in graded alcohol/water solutions. Endogenous peroxidases were blocked by incubating tissues with 1% hydrogen peroxide in methanol for 10 minutes. Antigen were retrieved by incubating tissues in citrate buffer (pH 6.0) for 30 minutes at high heat. ER was detected with a monoclonal antibody (Dako Cytomation clone #1D5, Carpinteria, CA, USA) at a 1:200 dilution factor with a one-hour incubation at room temperature. PR was detected with a monoclonal antibody (Dako Cytomation clone #PgR636, Carpinteria, CA, USA) at a 1:50 dilution factor with a 30-minute incubation at room temperature. After washing away unbound primary antibody, tissues were incubated for one hour with a biotinylated horse-anti-mouse secondary antibody (Vector Labs, Burlingame, CA, USA) at a 1:250 dilution factor, followed by 1-hour incubation with Vectastain Elite ABC streptavidin-horseradish peroxidase conjugate (Vector Labs, Burlingame, CA, USA) at a 1:200 dilution factor. Bound complexes were visualized with diaminobenzidine following signal potentiation (0.5% copper sulfate in normal saline for 5 minutes). All slides were counterstained with hematoxylin. All TMAs were stained for ER or PR in single runs on a Dako Autostainer (Dako Corporation, Carpinteria, CA, USA). All TMAs were manually reviewed and scored by a single expert breast pathologist (LC) at the Beth Israel Deaconess Medical Center before any data were collected from the computational pathology systems.
Automated image analysis
Using expert breast pathologist classification as benchmarks, we compared the performance of two computational pathology systems on their continuous measurement of ER and PR positivity in breast tumors. The first system, Aperio Digital Pathology (Leica Biosystems, Buffalo Grove, IL, USA), integrates a digital microscope with image analysis software. In our implementation of the Aperio system, pathologists were required to review each tumor core image, manually outline regions of invasive tumor, flag regions to ignore (e.g., chromogen deposits, non-specific staining, and folded-over tissue), and specify an appropriate image analysis algorithm. The second system, Definiens Tissue Studio (Definiens AG, Munich, Germany), is a software suite which requires input of a raw TMA image from a third-party digital slide scanner. In our implementation of the Definiens system, we used the software to automatically identify regions of tumor tissue, and did not require manual review of each tissue core. As a result, our implementation of the Definiens system represented a workflow option with minimal user input that can spare time and personnel expense. ER and PR measurements on the Aperio platform used the built-in “nuclear v9” algorithm. ER and PR measurements on the Definiens platform used the built in Definiens Tissue Studio algorithm for quantification of protein expression from nuclear stains (complete parameters are available from the corresponding author).
Definitions of analytic variables
Expert pathologist classification of ER expression was recorded both dichotomously (negative vs. ≥1% of tumor nuclei positive) and categorically (negative, 1–9% of tumor nuclei positive, or ≥10% of tumor nuclei positive). Expert pathologist classification of PR expression was only classified dichotomously (negative vs. ≥1% of tumor nuclei positive). Both the Aperio and Definiens systems scored nuclear staining intensity on a four-level ordinal scale, with 0 denoting no stain and 3 denoting the strongest staining. Among the wealth of data generated for each tissue core by the Definiens and Aperio algorithms are the total number of tumor nuclei evaluated and the number of tumor cores exhibiting each staining level. These measurements were summarized for each tumor core using two quantities, the positivity index and the histological score. The positivity index is equal to the proportion of tumor nuclei with any positive staining (range: 0—100) and gives equal weight to all staining intensities. In contrast, the histological score (h) weights the proportion of positive nuclei by their staining intensity (range: 0—300). In the equation below, pi denotes the proportion of tumor nuclei exhibiting staining at different intensity levels (i=0 for no staining, i=1 for low staining, i=2 for moderate staining, and i=3 for strong staining). For the breast cancer cases—each of which was represented by up to 3 tumor cores—ER and PR positivity index and histological score were summarized as the mean across evaluated cores.
We collected descriptive data on demographic factors and tumor characteristics for the breast cancer cases using biennial NHS questionnaires and the pathology reports from treating hospitals. Age was defined at the time of breast cancer diagnosis. Year of diagnosis was categorized into six periods: 1990–1991, 1992–1993, 1994–1995, 1996–1997, 1998–1999, and 2000–2002. Tumor size was categorized as 0.1—1.0 cm, 1.1—2.0 cm, and ≥2.1 cm. Tumor histology and grade were based on evaluation of TMAs by BIDMC breast pathologists. Histology was classified as invasive ductal carcinoma, invasive lobular carcinoma, both invasive ductal and lobular carcinoma, in situ disease, or other histological type. Grade was classified as well-, moderately-, or poorly differentiated.
Statistical analysis
We tabulated the frequency and proportion of breast cancer cases measured for ER and PR on the Definiens and Aperio platforms according to demographic and tumor characteristics. For cases represented by 3 tumor cores with a nonzero mean measurement, we calculated the coefficient of variation (CV; the standard deviation divided by the mean) of the measurement across cores. We characterized the location and dispersion of continuous ER and PR measurements with summary statistics and boxplots within joint strata of computational pathology platform and dichotomous expert pathologist classification. Mean measurements across platforms were compared with Wilcoxon signed rank tests. To compare case-by-case agreement on continuous ER and PR measurements we plotted platform-specific values of cases’ positivity index or histological score against one another and calculated Pearson correlation coefficients.
For ER we evaluated correlations between the platform-specific continuous measurements and the ordinal expert pathologist classification (negative, 1–9% of tumor nuclei positive, and ≥10% of tumor nuclei positive) using Spearman correlation coefficients without correction for de-attenuation (7). We compared correlation coefficients between platforms by calculating differences and accompanying 95% confidence intervals.
We compared the platforms’ ER and PR classification accuracies using dichotomous expert pathologist classifications as standards. Using pathologist ER and PR call as regressands, we fit multivariable logistic models with paired Aperio and Definiens measurements (mean positivity index or mean histological score) as independent variables. From these models we calculated the area under receiver operating characteristic (ROC) curves (AUC) estimated from platform-specific measures. Using the ROC curves we determined classification statistics (sensitivity and specificity) for positivity index or histological score cut-points of 5, 10, and 20. We also calculated classification statistics for the optimal cut-points, which we defined as those yielding the maximum sum of sensitivity and specificity. Classification performance was compared by calculating differences in platform-specific AUCs and accompanying 95% confidence intervals.
All analyses were performed with SAS version 9.4 (SAS Institute, Cary, NC, USA); statistical tests were two-sided with a type I error rate of 5%.
RESULTS
Table 1 shows tumor and demographic characteristics for the evaluated cases. There were 592 breast cancer cases evaluated for ER expression and 187 breast cancer cases evaluated for PR expression by both the Definiens and Aperio systems. The distribution of evaluable core count was similar between the two systems. Overall, about two-thirds of the breast cancer cases were represented by 3 evaluable tumor cores. Among these cases, the median coefficient of variation (CV) for continuous ER and PR measurements ranged between 23.1—33.3%, with maximum values ranging from 114—173%. The distribution of CV values was similar for both platforms and for both positivity index and histological score (Supplemental Table 1 and Supplemental Table 2). The proportion of cases represented by only a single tumor core ranged from 7% (for ER measured by Definiens) to 15% (for PR measured by Definiens). Year of diagnosis ranged between 1990—2002 for cases with ER measurements and 1990—1997 for cases with PR measurements. ER and PR subsets were similar with respect to the distribution of patient age, tumor size, and histological types. Invasive cancer cases with PR measurements were less likely to have poorly differentiated tumors compared with invasive cases with ER measurements.
Table 1.
Characteristics of breast cancer cases assessed for estrogen receptor and progesterone receptor expression by the Definiens and Aperio computational pathology platforms.
| Characteristic | Estrogen receptor (n=592) | Progesterone receptor (n=187) |
|---|---|---|
|
| ||
| Tumor cores evaluated by Definiens, n (%) | 42 (7) | 28 (15) |
| 1 | 135 (23) | 38 (20) |
| 2 | 415 (70) | 121 (65) |
| 3 | ||
|
| ||
| Tumor cores evaluated by Aperio, n (%) | ||
| 1 | 73 (12) | 17 (9) |
| 2 | 132 (22) | 31 (17) |
| 3 | 387 (65) | 139 (74) |
|
| ||
| Age at diagnosis, mean (sd) | 63.0 (7.4) | 60.8 (7.3) |
|
| ||
| Year of diagnosis, n (%) | ||
| 1990–1991 | 52 (9) | 30 (16) |
| 1992–1993 | 98 (17) | 46 (25) |
| 1994–1995 | 119 (20) | 71 (38) |
| 1996–1997 | 120 (20) | 40 (21) |
| 1998–1999 | 120 (20) | 0 (0) |
| 2000 –2002 | 82 (14) | 0 (0) |
| (missing) | 1 | 0 |
|
| ||
| Tumor size in cm, n (%)** | ||
| 0.1—1.0 | 161 (32) | 48 (30) |
| 1.1—2.0 | 204 (41) | 64 (40) |
| ≥2.1 | 135 (27) | 47 (30) |
| (missing) | 12 | 4 |
|
| ||
| Histology, n (%) | ||
| invasive ductal carcinoma | 324 (56) | 96 (53) |
| invasive lobular carcinoma | 62 (11) | 18 (10) |
| invasive ductal/lobular carcinoma | 91 (16) | 38 (21) |
| in situ | 92 (16) | 28 (15) |
| other | 8 (1) | 2 (1) |
| (missing) | 15 | 5 |
|
| ||
| Grade, n (%)** | ||
| well-differentiated | 117 (23) | 42 (26) |
| moderately differentiated | 278 (55) | 95 (59) |
| poorly differentiated | 85 (17) | 17 (10) |
| (missing) | 12 | 2 |
Among invasive cases.
The distribution of continuous ER and PR measurements are depicted graphically for the positivity index in Figure 1 and for the histological score in Supplemental Figure 1. Corresponding summary statistics are reported in Supplemental Table 1 and Supplemental Table 2. Among cases classified as ER-negative by an expert pathologist [n=116 (20%)], the mean positivity index was similar for both platforms, but was measured with less precision by Definiens (Definiens: mean ± sd=11.4 ± 14.3, range=0.1—84.8; Aperio: mean ± sd=10.3 ± 7.9, range=0—38.5, p for difference= 0.21); a similar pattern was evident for histological score. Among cases classified as ER-positive by an expert pathologist [n=476 (80%)], the mean positivity index on the Definiens platform was lower than the mean positivity index on the Aperio platform (Definiens: mean ± sd=42.1 ± 24.8, range=0.9—99.1; Aperio: mean ± sd=54.7 ± 26.0, range=4.9—99.6; p for difference<0.0001); a similar pattern was evident for the histological score. Regardless of platform, there was considerable overlap in the ranges of ER measurements between the positive and negative categories of expert pathologist classification. In both the PR-negative stratum [n=62 (33%)] and the PR-positive stratum [n=125 (67%)], mean positivity index and mean histological score were higher on the Definiens platform than on the Aperio platform. As seen with ER, there was considerable overlap in the ranges of PR measurements between strata of PR status by expert pathologist.
Figure 1.
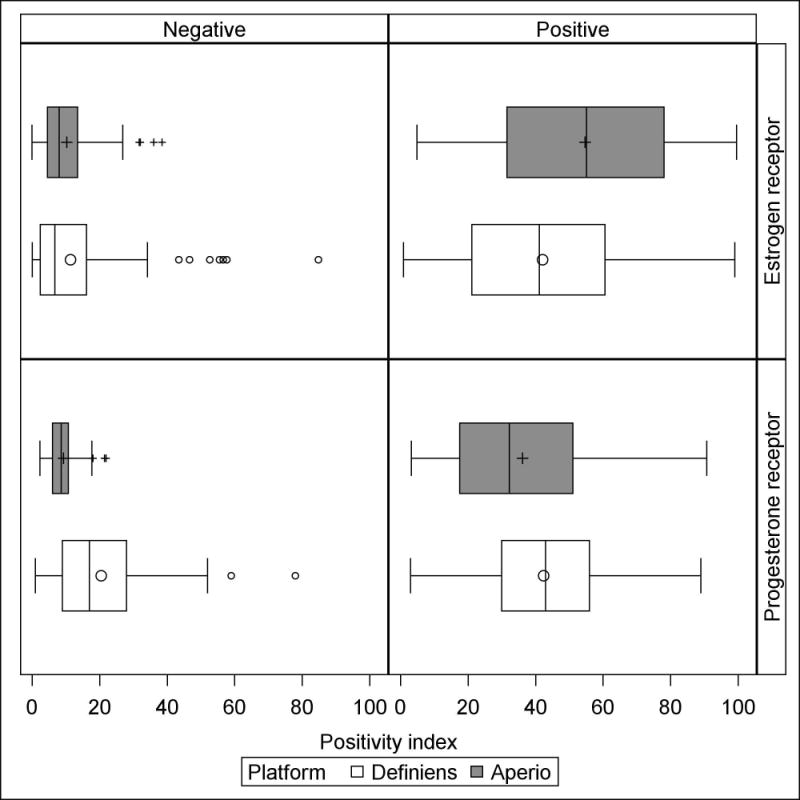
Boxplots portraying location and dispersion of the mean positivity index for estrogen receptor and progesterone receptor measurements by the Definiens and Aperio platforms, stratified by dichotomous expert pathologist classification. Estrogen receptor and progesterone receptor data are based on 592 and 187 subjects, respectively. Outlier marks in boxplots correspond to observations with values greater than 1.5 times the interquartile range above the 75th percentile.
The boxplots in the upper-left panel of Figure 1—which represent the distribution of mean ER positivity index among cases classified as negative by expert pathologist—show several high outlier observations on both platforms. These outlier observations are from 7 individual breast cancer cases. Only one of these cases was an outlier on both platforms. Of the remaining 6 outliers, 5 were unique to Definiens and only 1 was unique to Aperio. Visual analysis of tumor cores from these cases showed that cores from the single outlier on both platforms and all 5 of the outliers unique to the Definiens system had regions of folded or sloughing tissue in addition to chromogen deposits that were misinterpreted as positive nuclei. The single statistical outlier unique to the Aperio system appeared to be truly ER-positive, and its positivity index measurements from Aperio and Definiens were quite similar (38.53 and 34.20, respectively).
Figure 2 shows scatter plots of Definiens mean positivity index against corresponding Aperio measures for both ER and PR (scatter plots based on histological score are shown in Supplemental Figure 2). Marker shapes encode each case’s dichotomous ER or PR status determined by expert pathologist. We saw strong, positive correlations between Definiens and Aperio measurements of the ER positivity index (Pearson rho=0.83, 95% CI: 0.81, 0.86) and between Definiens and Aperio measurements of the PR positivity index (Pearson rho=0.77, 95% CI: 0.71, 0.83). Among cases deemed negative by pathologists, Definiens positivity index measurements tended toward higher values than corresponding Aperio measurements. Supplemental Figure 2 shows strong, positive correlations between the ER and PR histological scores measured by Definiens and Aperio (for ER, Pearson rho=0.85, 95% CI: 0.83, 0.87; for PR, Pearson rho=0.81, 95% CI: 0.76, 0.86). While the Definiens histological score also showed a tendency toward higher values than the Aperio histological score among cases deemed negative by pathologists, the magnitude was much less pronounced than for the positivity index.
Figure 2.
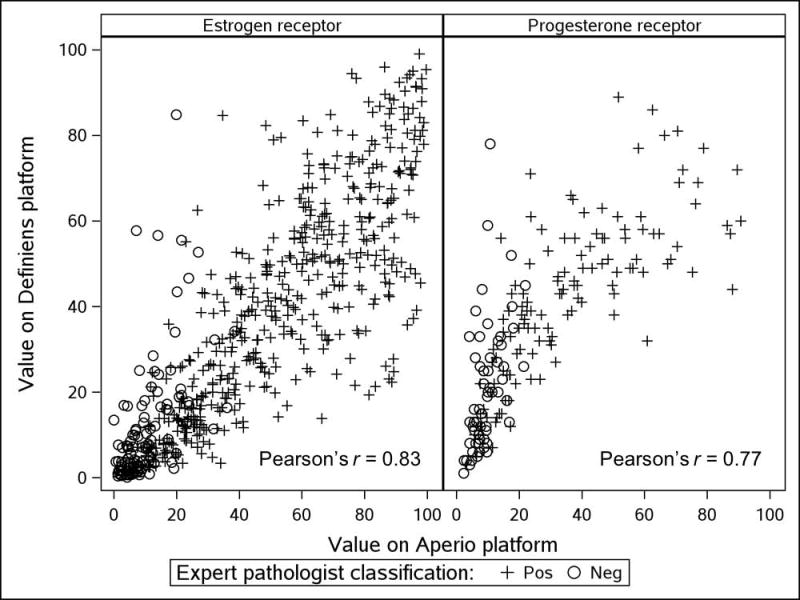
Scatter plots of ER and PR mean positivity index measurements by Aperio and Definiens platforms, according to expert pathologist classification. ER and PR positivity defined as ≥1% of nuclei positive.
Table 2 reports Spearman correlations between platform-specific ER positivity index or histological score and the expert pathologists’ ordinal classification of ER expression (negative, 1–9% of tumor nuclei positive, or ≥10% of tumor nuclei positive). Within platforms, correlation coefficients were similar (or identical) for the positivity index and the histological score. Both measurements from the Aperio system were more strongly correlated with the 3-level ER variable than corresponding measurements from the Definiens system (e.g., Aperio positivity index Spearman rho=0.66; Definiens positivity index Spearman rho=0.54; difference=0.12, 95% CI: 0.08, 0.16).
Table 2.
Correlations between continuous measurements with 3-level pathologist-determined ER status. Nurses’ Health Study breast cancer cases with estrogen receptor measurement from both Definiens and Aperio platforms (n=592).
| Measurement | Spearman correlation coefficients | Comparison | ||||
|---|---|---|---|---|---|---|
| Aperio | Definiens | |||||
| Rho | (95% CI) | Rho | (95% CI) | Difference | (95% CI) | |
| positivity index | 0.66 | (0.62, 0.71) | 0.54 | (0.49, 0.60) | 0.12 | (0.08, 0.16) |
| histological score | 0.67 | (0.62, 0.71) | 0.57 | (0.51, 0.62) | 0.10 | (0.07, 0.13) |
Three-level estrogen receptor status by manual pathologist review; 0: negative, 1: 1 to 9% of tumor nuclei positive, 2: ≥10% tumor nuclei positive.
Table 3 compares Definiens and Aperio measurements on their potential to correctly classify cases as ER or PR positive, using dichotomous expert pathologist classifications (negative vs. ≥1% tumor nuclei positive) as standards. Both positivity index and histological score showed excellent ER and PR classification potential, reflected by AUCs ranging from 0.83 to 0.97. The AUCs for histological score were consistently (though modestly) higher than AUCs for positivity index within ER/PR and Definiens/Aperio groups (e.g., for PR measurements on the Definiens platform, positivity index AUC=0.83, 95% CI: 0.76, 0.89; histological score AUC=0.87, 95% CI: 0.81, 0.92). AUCs for Aperio measurements were consistently higher than AUCs for Definiens measurements (e.g., for ER positivity index, Aperio AUC=0.96, 95% CI: 0.95, 0.98; Definiens AUC=0.88, 95% CI: 0.84, 0.91). Differences between Aperio and Definiens AUC values ranged from 0.07 to 0.10 (Table 3).
Table 3.
Classification performance of continuous measurements with respect to dichotomized manual pathologist reading. Nurses’ Health Study breast cancer cases with estrogen receptor or progesterone receptor measurement from both Definiens and Aperio platforms.
| Measurement | No. cases | Aperio platform | Definiens platform | Comparison | |||
|---|---|---|---|---|---|---|---|
|
| |||||||
| AUC | (95% CI) | AUC | (95% CI) | Difference | (95% CI) | ||
| Estrogen receptor* | 592 | ||||||
| positivity index | 0.96 | (0.95, 0.98) | 0.88 | (0.84, 0.91) | 0.09 | (0.06, 0.12) | |
| histological score | 0.97 | (0.95, 0.98) | 0.90 | (0.87, 0.93) | 0.07 | (0.05, 0.09) | |
|
| |||||||
| Progesterone receptor** | 187 | ||||||
| positivity index | 0.92 | (0.89, 0.96) | 0.83 | (0.76, 0.89) | 0.10 | (0.05, 0.15) | |
| histological score | 0.94 | (0.91, 0.97) | 0.87 | (0.81, 0.92) | 0.07 | (0.03, 0.12) | |
Positivity criterion for gold standard manual pathologist review was presence of any positive nuclei.
Supplemental Table 3 shows classification parameters for different ER-positive cut-points of the positivity index and histological score. We defined optimal cut-points as those that yielded the greatest sum of sensitivity and specificity. For the Definiens platform the optimal positivity index cut-point was ≥21% (sensitivity=74.8%, false-positive rate [FPR]=12.9%) and the optimal histological score cut-point was ≥27 (sensitivity=75.5%, FPR=10.3%). For the Aperio platform the optimal positivity index cut-point was ≥25% (sensitivity=84.1%, FPR=4.3%) and the optimal histological score cut-point was ≥25 (sensitivity=88.7%, FPR=6.9%). Corresponding cut-points and classification parameters for progesterone receptor are reported in Supplemental Table 4.
DISCUSSION
We compared two commercially available computational pathology platforms on their measurement of continuous hormone receptor expression in archival breast tumor TMAs from the NHS cohort—an ideal example of the type of research setting which stands to benefit from adoption of computational pathology systems. The two platforms were implemented with different workflows. Our Aperio implementation required a considerably greater amount of effort per case evaluated, but was expected to yield a lower false-positive classification rate for the marker of interest in return. And while the Definiens system can be operated with a similar degree of user scrutiny and input, we chose to implement a largely automated process to increase time efficiency, although at the potential expense of higher false-positive classification rates.
We found considerable overlap in values of both positivity index and histological score (regardless of platform) between strata of pathologist-determined ER and PR status (Figure 1 and Supplemental Figure 1). Pathologists used a cutoff of ≥1% of tumor nuclei staining positive to classify dichotomous ER and PR status. Nonetheless, there were cases deemed ER negative by pathologists with positivity index values as high as 84.8 on the Definiens system and 38.5 on the Aperio system (Supplemental Table 1), and cases deemed PR negative by pathologists with positivity index values as high as 78.0 on the Definiens system and 21.9 on the Aperio system (Supplemental Table 2). This lack of congruence may be partially explained by low-intensity nuclear staining that is interpreted as positive by the computational pathology algorithms but is correctly recognized as non-specific staining by expert pathologists. It follows from this that the highest values of the Aperio system’s ER and PR positivity index ranges are substantially lower than the highest values of the Definiens system’s ER and PR positivity index ranges, since regions of non-specific staining would have been flagged for exclusion during the manual review process for Aperio.
Definiens and Aperio measurements correlated strongly with one another. However, scatter plots showed further evidence of the Definiens positivity index being overly sensitive among cases deemed ER or PR negative by expert pathologists (Figure 2), with a substantial number of observations exhibiting much higher readings than those returned by the Aperio. This was much less evident for the Definiens histological score, which weights positive nuclei according to their staining intensity and is therefore able to de-emphasize (but not completely discount) potential false-positive, lightly-stained nuclei.
Compared with Definiens, measurements from the Aperio system yielded stronger correlations with ordinal ER status (Table 2) and better classification accuracy with respect to gold-standard dichotomous ER and PR status (Table 3). However, the modest gains in correlation and classification accuracy were not in proportion to the considerably greater amount of time required by our Aperio implementation to prepare scanned tumor cores for image analysis. Both Aperio and Definiens allow users to customize image analysis parameters, and the Definiens system can be operated with as much user specification of analysis regions as the Aperio system. Together, these steps allow for fine-tuning the platforms’ output to match specific research objectives. The continuous measurements provided by the systems promise to expand future research endeavors, such as modeling cancer risk heterogeneity and predicting responses to adjuvant therapy according to increasing levels of clinically important biomarkers. The continuous data could also be used to define cut-points for dichotomous classifiers that minimize the proportion of false negative or false positive cases.
Other studies have evaluated performance of computational pathology systems for the measurement of breast tumor biomarkers. One group showed 100% concordance between semi-quantitative pathologist readings for ER (n=10 cases) and HER2 (n=23 cases) and corresponding semi-quantitative readings from both Definiens and Aperio using whole-slide tumor images (8). Another group used a custom-built, fully automated nuclear algorithm to measure ER and PR expression in 743 primary breast tumors (9). Validation against pathologist readings was done for only 18 cases, but showed a strong, positive correlation (Spearman ρ=0.9, P<0.001); the authors used the continuous ER and PR data to define optimal cut-points for predicting survival and response to tamoxifen treatment (9). To our knowledge, our study is the largest-yet comparison of computational pathology measurements with expert pathologist measurement of ER and PR in breast tumors.
It should be noted that the cases in our analysis were not a random sample of all breast cancer cases in the NHS cohort, and that ER and PR measurements were made for minor subsets of the 6,494 NHS breast cancer cases for which tumor tissues have been collected and placed in TMAs. The sizes of the ER and PR subsets were limited by the number of cases evaluated on the Aperio platform, which in turn was limited by that platform’s slower workflow. While such a highly selected sample might generate bias in an epidemiologic study of breast cancer risk factors, our objective was simply to make comparisons of measurements on common sets of tumor tissue from breast cancer cases. As such, our analytic samples were appropriate for achieving our aims.
Information bias is another potential limitation. We used manual classification of ER and PR status by an expert pathologist as gold standards for comparing platforms, even though they are subject to measurement error. One potential bias scenario under such measurement error is that cases could be falsely classified negative by pathologists while yielding positive signal in image analysis algorithms. This could partly explain the high range of positivity index values among ER- and PR-negative cases described above. It is impossible to speculate about the existence and magnitude of this bias in the absence of a better standard. However, our assessment of statistical outliers among cases deemed ER-negative by an expert pathologist showed only one instance where an apparently positive tumor core was deemed negative by the pathologist.
In summary, the highly automated implementation of the Definiens platform performed marginally poorer than the highly supervised implementation of the Aperio platform in classifying breast tumor ER and PR status in tissue microarrays. With careful optimization and validation, automated computational pathology platforms may prove quite useful for molecular epidemiology studies in which finer classification of protein expression beyond typical ordinal or dichotomous schemes is desired or necessary.
Supplementary Material
Take home messages.
Computational pathology platforms may be used to enrich molecular epidemiology studies with continuous protein expression data.
An algorithm with extensive user supervision performed better at classifying breast tumor hormone receptor status than a more time-efficient fully automated algorithm.
With careful development and validation, automated computational pathology algorithms may equip molecular epidemiology studies with data for finer definition of tumor molecular subtypes in a time- and cost-efficient manner.
Acknowledgments
We would like to thank the participants and staff of the Nurses’ Health Study for their valuable contributions as well as the following state cancer registries for their help: AL, AZ, AR, CA, CO, CT, DE, FL, GA, ID, IL, IN, IA, KY, LA, ME, MD, MA, MI, NE, NH, NJ, NY, NC, ND, OH, OK, OR, PA, RI, SC, TN, TX, VA, WA, WY. The authors assume full responsibility for analyses and interpretation of these data.
Financial support
This study was supported by the following grants from the National Cancer Institute at the U.S. National Institutes of Health: UM1 CA186107 and P01 CA87969. TPA was supported by a Career Catalyst Award from Susan G. Komen for the Cure (CCR13264024) and by the Mary Kay Foundation (003-14).
Footnotes
Conflict of Interest Statement
Author AHB has an equity interest in PathAI, Inc. No other author reports a potential conflict of interest.
References
- 1.Calhoun BC, Collins LC. Predictive markers in breast cancer: An update on ER and HER2 testing and reporting. Semin Diagn Pathol. 2015;32:362–9. doi: 10.1053/j.semdp.2015.02.011. [DOI] [PubMed] [Google Scholar]
- 2.Liu H. Application of immunohistochemistry in breast pathology: a review and update. Arch Pathol Lab Med. 2014;138:1629–42. doi: 10.5858/arpa.2014-0094-RA. [DOI] [PubMed] [Google Scholar]
- 3.Burstein HJ, Temin S, Anderson H, Buchholz TA, Davidson NE, Gelmon KE, et al. Adjuvant endocrine therapy for women with hormone receptor-positive breast cancer: american society of clinical oncology clinical practice guideline focused update. J Clin Oncol. 2014;32:2255–69. doi: 10.1200/JCO.2013.54.2258. [DOI] [PMC free article] [PubMed] [Google Scholar]
- 4.Tamimi RM, Colditz GA, Hazra A, Baer HJ, Hankinson SE, Rosner B, et al. Traditional breast cancer risk factors in relation to molecular subtypes of breast cancer. Breast Cancer Res Treat. 2012;131:159–67. doi: 10.1007/s10549-011-1702-0. [DOI] [PMC free article] [PubMed] [Google Scholar]
- 5.Prasad K, Prabhu GK. Image analysis tools for evaluation of microscopic views of immunohistochemically stained specimen in medical research-a review. J Med Syst. 2012;36:2621–31. doi: 10.1007/s10916-011-9737-7. [DOI] [PubMed] [Google Scholar]
- 6.Colditz G, Hankinson S. The Nurses’ Health Study: lifestyle and health among women. Nature reviews Cancer. 2005;5:388–96. doi: 10.1038/nrc1608. [DOI] [PubMed] [Google Scholar]
- 7.Rosner B, Wang W, Eliassen AH, Hibert E. Comparison of Dependent Pearson and Spearman Correlation Coefficients with and without Correction for Measurement Error. Biometrics & Biostatistics. 2015;6:226. [Google Scholar]
- 8.Lloyd MC, Allam-Nandyala P, Purohit CN, Burke N, Coppola D, Bui MM. Using image analysis as a tool for assessment of prognostic and predictive biomarkers for breast cancer: How reliable is it? J Pathol Inform. 2010;1:29. doi: 10.4103/2153-3539.74186. [DOI] [PMC free article] [PubMed] [Google Scholar]
- 9.Rexhepaj E, Brennan DJ, Holloway P, Kay EW, McCann AH, Landberg G, et al. Novel image analysis approach for quantifying expression of nuclear proteins assessed by immunohistochemistry: application to measurement of oestrogen and progesterone receptor levels in breast cancer. Breast Cancer Res. 2008;10:R89. doi: 10.1186/bcr2187. [DOI] [PMC free article] [PubMed] [Google Scholar]
Associated Data
This section collects any data citations, data availability statements, or supplementary materials included in this article.