Abstract
Herba Gelsemii elegantis (GE) has been frequently used as a Chinese folk medicine but has high acute toxicity. In Traditional Chinese Medicine, it may be detoxified by Ramulus et Folium Mussaendae pubescentis (MP), but the detoxification mechanism has remained elusive. The present study aimed to evaluate the detoxification mechanisms by which MP modulates the effect of GE in rats, including the inhibition of hepatic cytochrome P (CYP)450 and glutathione S-transferase (GST) enzymes. Male Sprague Dawley rats were orally administered GE at three doses (0.36, 0.43 or 0.54 g/kg) alone and, at the highest dose, in combination with MP (21.6 g/kg) every day for 7 consecutive days. The control group of animals received the same volume of saline. The mRNA and protein expression of hepatic CYPs representative of two subfamilies (CYP2E1 and CYP1A2) were separately assessed by reverse-transcription quantitative polymerase chain reaction (RT-qPCR), western blot and immunohistochemistry assays. The mRNA and protein expression as well as enzyme activity of hepatic GST were assessed by RT-qPCR, western blot and colorimetric assays, respectively. The results indicated that GE significantly inhibited CYP2E1 mRNA and protein expression in a dose-dependent manner. Co-administration of MP increased CYP2E1 mRNA and protein expression as compared with the high GE dose alone. Cells expressing CYP2E1, located around the hepatic vascular plexus under a clear background, were identified by immunohistochemical staining. The results for CYP1A2 were similar to those for CYP2E1. At all concentrations used, GE significantly inhibited GST mu 1 (GSTm1) mRNA and protein expression in a dose-dependent manner, as compared with the control. Combination of GE and MP increased the mRNA and protein expression of GSTm1 as compared with the high dose of GE. However, the differences in GST-pi mRNA and protein expression between the GE and GE + MP groups were not significant. Of note, rats co-treated with MP were significantly protected from the decrease in GST activity produced by GE. The present study indicated that co-administration of GE and MP upregulated the activities of CYP450 and GST enzymes when compared with GE alone. This modulation may explain for the effect of MP in reducing the acute toxicity of GE.
Keywords: Herba Gelsemii elegantis, ramulus et folium Mussaendae pubescentis, cytochrome P450, glutathione S-transferase, detoxification
Introduction
Herba Gelsemii elegantis (GE) is a toxic plant that is well-known throughout the world. However, it has been used as a Chinese folk medicine for the treatment of malignant tumors, pain, rheumatic arthritis, psoriasis and immune function (1–3). Despite the benefits of GE preparations for human health, it is not broadly used due to its high toxicity. Although the toxic effects of GE have been evaluated using animal models (3), there has been no scientific report on how to decrease its toxicity, to the best of our knowledge.
In Chinese folk medicine, GE is commonly taken with Ramulus et Folium Mussaendae pubescentis (MP) to decrease its toxicity (4). MP belongs to the Rubiaceae family and has been used as an antipyretic and antidotal herb for thousands of years. Taking the preliminary results on the toxicity and efficacy of the two Chinese herbs, GE and MP, into account, a novel formula comprising the dichloromethane extract of GE and the aqueous extract of MP at the ratio of 1:40 (GM) was derived. However, the mechanisms of this detoxification have remained elusive.
It is generally known that organisms have the ability to detoxify exogenous toxicants. Proposed mechanisms to explain this detoxification include inhibition of the bioactivation of xenobiotics by phase-I metabolic enzymes, induction of phase-II detoxification enzymes and scavenging of ultimate electrophilic species (5). The phase-I detoxification system, composed primarily of cytochrome P450 (CYP450) enzymes, is frequently the first line of enzymatic defense against exogenous toxicants. CYP450 enzymes are important for the function of the toxicant metabolism in the body. Chief among them are CYP2E1 and CYP1A2. CYP2E1 is a significant enzyme that is responsible for not only drug metabolism but also the catalysis of numerous poisons and carcinogens (6,7). CYP1A2 is abundantly expressed in the human and rodent liver and may have a vital role in activating numerous pro-poisons and pro-carcinogens (8). Previous studies suggested that GE dichloromethane extracts and active constituents were able to selectively inhibit CYP2E1 and CYP1A2 activities in vitro (9). Thereafter, the phase-II detoxification enzymes are involved in the metabolism of a variety of phase-I metabolic intermediates. Glutathione (GSH) S-transferase (GST) is a crucial phase-II metabolic enzyme in the body. The major GST enzymes associated with detoxification include GST mu 1 (GSTm1) and GST-pi (10). They catalyze the combination of GSH and toxic metabolic intermediates to detoxify them, leading to the formation of water-soluble substances (11).
In light of the importance of metabolic enzymes in the detoxification-associated metabolism, the present study postulated that detoxification mechanisms of MP may be caused in inducing or inhibiting phase-I metabolic enzymes and phase-II detoxification enzymes. However, few studies have assessed whether MP detoxification mechanisms are associated with induction or inhibition of metabolic enzymes (12). For this reason, the aim of the present study was to assess the modulation effect of MP on the toxicity of GM by inhibition of hepatic CYP450 and GST enzymes in rats. For this purpose, reverse-transcription quantitative polymerase chain reaction (RT-qPCR), western blot and immunohistochemical (IHC) assays were separately performed to examine the effects of MP on the mRNA and protein expression of CYP450 enzymes in GE-induced rat livers. Furthermore, RT-qPCR, western blot analysis and a colorimetry assay were separately performed to detect the effects of MP on the mRNA, protein expression and enzyme activity of GST enzymes in GE-induced rat livers.
Materials and methods
Chemicals and reagents
Primary antibodies against CYP2E1 (cat. no. ab28146), CYP1A2 (cat. no. ab22717), GSTm1 (cat. no. ab108084), GST-Pi (cat. no. ab138491) and β-actin (cat. no. ab8226) were obtained from Abcam (Cambridge, MA, USA). TRIzol reagent was supplied by Thermo Fisher Scientific, Inc. (Waltham, MA, USA). The TransScript One-Step gDNA Removal and cDNA Synthesis SuperMix was purchased from TransGen Biotech (Beijing, China). Biotinylated secondary antibodies (goat anti-rat; cat. no. Ab202-01; and goat anti-rabbit; cat. no. Ab203-01), enhanced chemiluminescence (ECL) plus (cat. no. E411-04) and bicinchoninic acid (BCA) protein determination (cat. no. E112-02) were provided by Vazyme Biotech Co., Ltd. (Nanjing, China). GST assay kits (cat. no. A004) were provided by Nanjing Jiancheng Bioengineering Institute (Nanjing, China). All the other chemicals were at least of analytical grade and were obtained from common commercial sources.
Preparation and chemical determination of extracts
The extraction method of GE with dichloromethane was identical to those described previously (9). The concentration of GE in the dichloromethane fraction was 0.05 g/ml. The extraction of MP was also identical to that described previously (13). After dispersion in 150 ml water, it was extracted with 450 ml petroleum ether, 450 ml dichloromethane and 450 ml ethyl acetate separately. Thereafter, the residual aqueous part was collected. The concentration of MP in the aqueous part was 2.0 g/ml. Two parts were filtered and evaporated under reduced pressure to obtain GE dichloromethane and MP aqueous extracts with typical yields of 0.67±0.071 and 5.78±0.20%, respectively. The high-performance liquid chromatography fingerprint of the chemical constituents of the dichloromethane fraction of GE was determined as previously described (14). The dichloromethane extract mainly contained indole alkaloids, including humantenmine, koumine and humantenine (9,14). The major chemical constituents of the aqueous extract of MP were triterpenoids. The triterpenoid content, which was determined as previously described (15), was 13.26±1.46 mg/g.
Animals, treatments and tissue preparation
A total of 50 healthy male Sprague Dawley rats (~200 g; 6–8 week old) were obtained from SLRC Laboratory Animal Co., Ltd. (Shanghai, China). The animals were had access to commercial rat feed and distilled water ad libitum and were randomly divided into five experimental groups containing 10 animals per group. They were maintained in a controlled environment at a temperature of 25±1°C under a 12 h light/dark cycle. After acclimatizing for one week, they were treated with GE (0.36, 0.43 and 0.54 g/kg) alone and, at the highest dose, also in combination with MP (21.6 g/kg) simultaneously by oral gavage once a day for one week. The control group of animals received the same volume of saline. All the procedures were according to international ethical guidelines and the National Institutes of Health Guide for the Care and Use of Laboratory Animals. The animal protocol was approved by the Ethics Committee of Fujian University of Traditional Chinese Medicine (Fuzhou, China).
A total of 2 rats succumbed in each of the high- and medium-dose GE groups. Surviving rats were sacrificed 1 h after the last lavage and the livers were quickly excised. The livers were washed with cold saline and specimens of it were fixed with 4% paraformaldehyde for IHC analysis. The remnants of the livers were stored at −80°C for the other analyses.
Determination of CYP450 enzyme expression
RT-qPCR analysis of CYP2E1 and CYP1A2 mRNA levels
Total RNA isolation was performed using TRIzol and the RNA concentration was determined using a NanoDrop 2000C spectrophotometer (Thermo Fisher Scientific, Inc.). RNA (1 µg) was reverse-transcribed using SuperScript® III First-Strand Synthesis System according to the supplier's instructions. The obtained complementary DNA was used to determine the amount of CYP2E1, CYP1A2 by mRNA PCR. β-actin was used as a housekeeping gene for normalization. The sequences of the primers used for amplification of CYP2E1, CYP1A2 and β-actin transcripts were as follows: CYP2E1 forward, 5′-CATCAATCTTGTCCCTTCCAACCTA-3′ and reverse, 5′-TTCTCTGGATCTGGAAACTCATGG-3′; CYP1A2 forward, 5′-CACGGCTTTCTGACAGACCC-3′ and reverse, 5′-GGTTGACCTGCCACTGGTTTAT-3′; β-actin forward, 5′-TGGGTATGGAATCCTGTGGCA-3′ and reverse, 5′-TGTTGGCATAGAGGTCTTTAGGG-3′. The thermal cycling conditions were as follows: Initial denaturation at 95°C for 3 min, followed by 35 cycles of denaturation at 95°C for 30 sec, annealing at 53°C for 30 sec and extension at 72°C for 30 sec. PCR amplification products were separated by 1.5% agarose gel electrophoresis and visualized by ethidium bromide staining. The mRNA levels were expressed as the ratio of the specified gene's signal in the selected amplification cycle divided by the β-actin signal (16).
Western blot analysis of CYP2E1 and CYP1A2 protein expression
Liver tissue was homogenized in radioimmunoprecipitation assay lysis buffer using a homogenizer and centrifuged at 12,000 × g at 4°C for 10 min to obtain the supernatants for further analysis. The protein concentration was determined by the BCA method. Equal amounts of protein samples (40 µg/lane) were denatured in gel-loading buffer at 100°C for 5 min, fractionated by 10% SDS-PAGE (standard gel) and transferred onto a 0.45 µm polyvinylidene fluoride membrane (EMD Millipore, Billerica, MA, USA). The membranes were blocked for 2 h with 5% milk in PBS containing 0.1% Tween-20 (PBST) and incubated with desired primary antibody against CYP2E1, CYP1A2 and β-actin (at a dilution of 1:1,000, 1:2,500 and 1:7,000, respectively) overnight at 4°C. The membranes were then incubated with desired secondary antibody (at a dilution of 1:6,000, 1:7,000 and 1:5,000, respectively) for 1 h at room temperature, followed by ECL detection. The protein expression was expressed as the ratio to β-actin.
IHC analysis of CYP2E1 and CYP1A2 protein expression
The fixed liver samples were embedded in paraffin and cut into 5-µm-thick sections. The liver sections were then deparaffinized and rehydrated by treatment with a series of xylenes and graded alcohols. Thereafter, the sections were subjected to antigen retrieval and the endogenous peroxidase activity was quenched with hydrogen peroxide. After blocking non-specific proteins with normal serum in PBST, the sections were incubated with desired primary antibodies to CYP2E1 and CYP1A2 (at a dilution of 1:200 and 1:400, respectively) overnight at 4°C. After washing with PBS, the sections were incubated with 100 µl biotinylated anti-rabbit immunoglobulin G antibody for 10 min at room temperature and then treated with the avidin biotin complex (both Fuzhou Maixin Biotech Co., Ltd., Fuzhou, China) for 10 min. They were finally incubated with diaminobenzidine for 4 min. After staining, twenty fields of view (magnification, ×100) were randomly selected in each slide, and the density of stained cells in each field was calculated using the true color multi-functional cell image analysis management system (Image-Pro Plus, version 6.0; Media Cybernetics, Rockville, MD, USA). A quantification assay is represented as the surface density and number density of positively stained cells. Surface density = area of positively stained cells/total statistical area. Number density = number of positively stained cells/total statistical area.
Determination of GST enzyme activities
RT-qPCR analysis for GSTm1 and GST-pi mRNA levels
RT-qPCR was performed as described above with slight adjustments as follows: The primer sequences for GSTm1 and GST-pi were as follows: GSTm1 forward, 5′-CGACGCTCCCGACTATGACA-3′ and reverse, 5′-CACGAATCCGCTCCTCCTCT-3′; GST-pi forward, 5′-GCACCTGGGTCGCTCTTTA-3′ and reverse, 5′-GGGCCTTCACATAGTCATCCTT-3′. The following thermal cycling conditions were applied: Initial denaturation at 95°C for 3 min, followed by 35 cycles of denaturation at 95°C for 30 sec, annealing at 58°C for 30 sec and extension at 72°C for 30 sec.
Western blot analysis of GSTm1 and GST-pi protein expression
Western blot analysis was performed according to the abovementioned procedure with the conditions lightly adjusted as follows: The dilution of the primary antibodies to GSTm1, GST-pi and β-actin was 1:1,000, 1:2,000 and 1:7,000, respectively. The dilution of the secondary antibodies to the GSTm1, GST-pi and β-actin goat anti-rabbit antibodies was 1:6,000, 1:6,000 and 1:5,000, respectively.
Colorimetric analysis of GST enzyme activity
Liver tissue was homogenized in saline using a homogenizer and centrifuged at 15,000 × g for 10 min to obtain the supernatants for further analysis. GST activity was measured by the method of Habig et al (17) via reduced GSH. The concentration of GSH indicated the activity of GST. One unit of enzyme activity was defined as the amount that reduced 1.0 µmol/l GSH per min at 37°C.
Statistical analysis
Values are expressed as the mean ± standard deviation. A one-way analysis of variance followed by least significant difference post-hoc tests was used for the comparison of multiple groups using SPSS software (version 12.0; SPSS Inc., Chicago, IL, USA). P<0.05 was considered to indicate a statistically significant difference.
Results
Effect of extracts on CYP450 enzymes expression in rat liver
RT-qPCR, western blot analysis and IHC assays were separately performed to examine the effects of MP on the mRNA and protein expression of hepatic CYPs in GE-induced rats. Two types of CYP that were associated with detoxification were selected, namely CYP2E1 and CYP1A2.
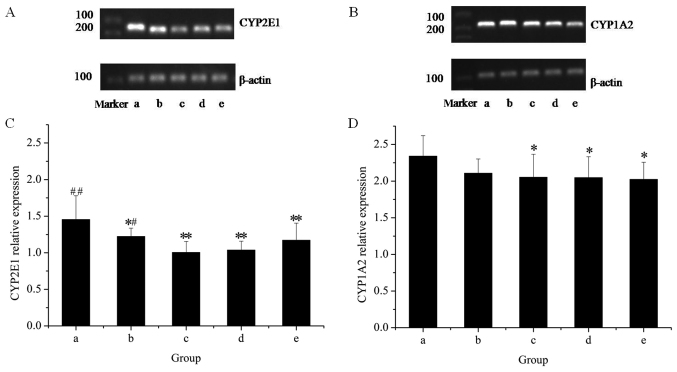
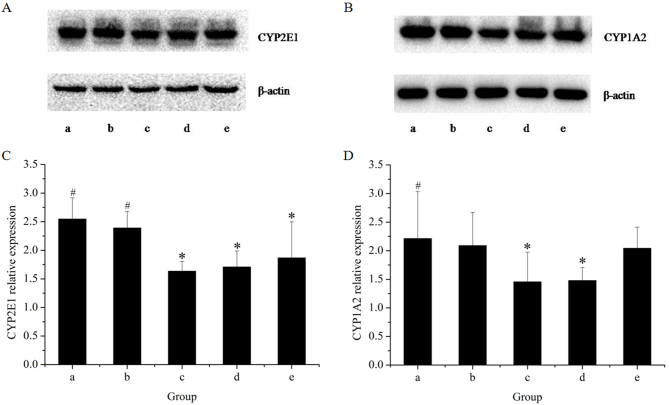
The effects of the extracts on the mRNA and protein expression of CYP2E1 in rat livers are presented in Figs. 1 and 2, respectively. The results of the RT-qPCR assay indicated that treatment with GE at all concentrations (0.36, 0.43 and 0.54 g/kg) significantly inhibited CYP2E1 mRNA expression in a dose-dependent manner, as compared with the control. However, co-administration of MP increased the mRNA expression of CYP2E1 as compared with that in the high-dose GE group. Western blot analysis revealed that the pattern of protein expression was similar to the respective mRNA levels. These results suggested that CYP2E1 expression was decreased by GE, which was inhibited by co-administration of MP.
Figure 1.
Reverse-transcription quantitative polymerase chain reaction analysis of hepatic CYP450 using the amplimers of CYP2E1 and CYP1A2. Gels displaying bands for (A) CYP2E1 and (B) CYP1A2 amplimers. Quantification of (C) the CYP2E1/β-actin ratio and (D) the CYP1A2/β-actin ratio. Lanes: a, control group; b, GE and aqueous extract of Ramulus et Folium Mussaendae pubescentis combination group; c, high-dose GE group; d, medium-dose GE group; e, low-dose GE group. *P<0.05, **P<0.01 vs. controls; #P<0.05, ##P<0.01 vs. high-dose GE group. CYP, cytochrome P450; GE, Herba Gelsemii elegantis dichloromethane extract.
Figure 2.
Western blot analysis of hepatic CYP450 using antibodies against CYP2E1 and CYP1A2. Western blot bands for (A) CYP2E1 and (B) CYP1A2. Quantification of (C) the CYP2E1/β-actin ratio and (D) the CYP1A2/β-actin ratio. Lanes: a, control group; b, GE and aqueous extract of Ramulus et Folium Mussaendae pubescentis combination group; c, high-dose GE group; d, medium-dose GE group; e, low-dose GE group. *P<0.05 vs. control; #P<0.05 vs. high-dose GE group. CYP, cytochrome P450; GE, Herba Gelsemii elegantis dichloromethane extract.
To further reveal the modulation effects on hepatic CYPs, the mRNA and protein expression of CYP1A2 was examined (Figs. 1 and 2). The results of the RT-qPCR assay revealed that GE treatments alone caused a significant decline in CYP1A2 mRNA expression as compared with that in the control group. Co-treatment with MP slightly increased the mRNA expression of CYP1A2 as compared with that in the high-dose GE group, but the difference was not statistically significant. Western blot analysis indicated that treatments administered to the high- and medium-dose GE groups significantly inhibited CYP1A2 protein expression as compared with the control. The effect of co-treatment with MP was similar to the results of mRNA levels.
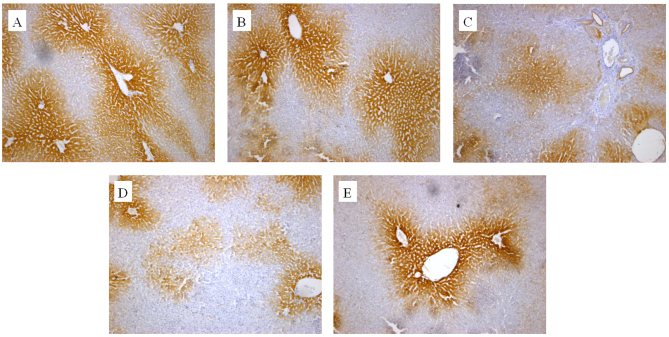
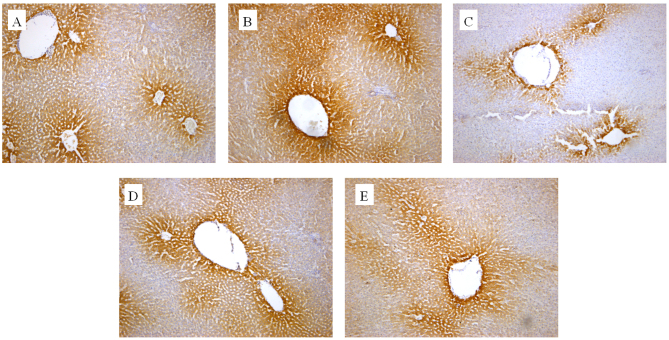
The in vivo effect of the extracts on CYP2E1 and CYP1A2 protein expression was also determined by an IHC assay. As presented in Figs. 3 and 4, cells expressing the respective proteins exhibited yellow brown or dark brown staining. These stained cells were located around the hepatic vascular plexus with a clear background. According to microscopic examination, CYP2E1 protein expression was markedly reduced by administration of GE and mildly increased by administration of GE + MP, which was in good agreement with the results of RT-qPCR and western blot assays. Processing with an image analysis system and statistical analysis revealed that the surface density and number density of CYP2E1-expressing cells in the control group was 54.29±6.53 and 0.71±0.065, while that in high-dose GE group was 31.47±5.99 and 0.47±0.079 and that in the GE and MP combination group was 43.77±8.01 and 0.70±0.11, respectively (Table I). The results for CYP1A2 protein expression were the similar to those for CYP2E1 protein expression (Fig. 4 and Table II). Taken together, it was demonstrated that MP upregulated CYP2E1 and CYP1A2 expression in vivo.
Figure 3.
Immunohistochemical analysis of hepatic CYP450 using antibody against CYP2E1. Representative photomicrographs of (A) controls group, (B) GE and aqueous extract of Ramulus et Folium Mussaendae pubescentis combination group, (C) high-dose GE group, (D) medium-dose GE group and (E) low-dose GE group (magnification, ×100). CYP, cytochrome P450; GE, Herba Gelsemii elegantis dichloromethane extract.
Figure 4.
Immunohistochemical analysis of hepatic CYP450 using antibody against CYP1A2. Representative photomicrographs of (A) controls group, (B) GE and aqueous extract of Ramulus et Folium Mussaendae pubescentis combination group, (C) high-dose GE group, (D) medium-dose GE group and (E) low-dose GE group (magnification, ×100). CYP, cytochrome P450; GE, Herba Gelsemii elegantis dichloromethane extract.
Table I.
Effect of herbal extracts on the protein expression of cytochrome P450 2E1 in rat livers.
| Group | n | GE dose (g/kg) | Surface density (×10−2) | Number density (×10-2 cell/µm2) |
|---|---|---|---|---|
| Control | 10 | – | 54.29±6.53a | 0.71±0.065b |
| Combination of GE and MP | 10 | 0.54 | 43.77±8.01ac | 0.70±0.11b |
| High-dose GE | 8 | 0.54 | 31.47±5.99c | 0.47±0.079d |
| Medium-dose GE | 8 | 0.43 | 34.28±5.32c | 0.53±0.10d |
| Low-dose GE | 10 | 0.36 | 35.33±6.72c | 0.69±0.13 |
P<0.01
P<0.05 vs. high-dose GE group
P<0.01
P<0.05 vs. control. Values are expressed as the mean ± standard deviation for groups. GE, Herba Gelsemii elegantis dichloromethane extract. A quantification assay is represented as the surface density and number density of positively stained cells. Surface density = area of positively stained cells/total statistical area; number density = number of positively stained cells/total statistical area.
Table II.
Effect of herbal extracts on the protein expression of cytochrome P450 1A2 in rat liver.
| Group | n | GE dose (g/kg) | Surface density (×10−2) | Number density (cell ×10−2/µm2) |
|---|---|---|---|---|
| Control | 10 | – | 48.66±6.32a | 0.69±0.089b |
| Combination of GE and MP | 10 | 0.54 | 43.80±8.70b | 0.59±0.093 |
| High-dose GE | 8 | 0.54 | 37.18±9.99c | 0.53±0.1d |
| Medium-dose GE | 8 | 0.43 | 38.34±10.14c | 0.59±0.083 |
| Low-dose GE | 10 | 0.36 | 40.18±4.06c | 0.66±0.21 |
P<0.01
P<0.05 vs. high-dose GE group
P<0.01
P<0.05 vs. control. Values are expressed as the mean ± standard deviation for groups. GE, Herba Gelsemii elegantis dichloromethane extract. A quantification assay is represented as the surface density and number density of positively stained cells. Surface density = area of positively stained cells/total statistical area; number density = number of positively stained cells/total statistical area.
Effects of herbal extracts on GST enzyme activities in rat liver
RT-qPCR, western blot and colorimetric assays were performed to detect the effects of MP on the mRNA and protein expression, as well as enzyme activity of hepatic GST in GE-induced rats. Two types of GST associated with detoxification, namely GSTm1 and GST-pi, were selected for analysis.
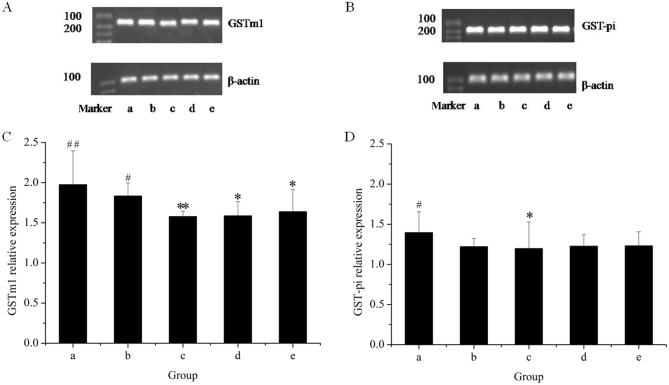
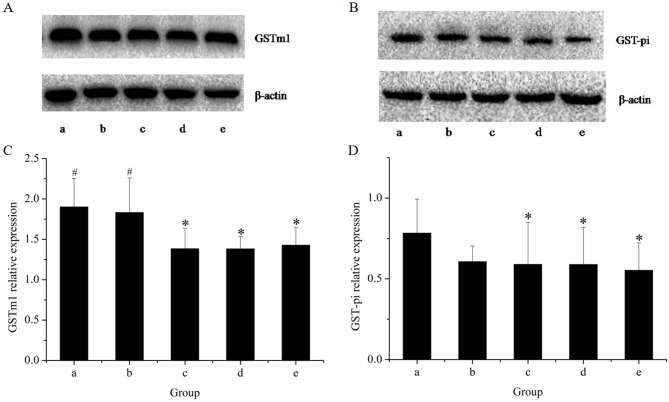
The effects of the herbal extracts on GSTm1 mRNA and protein expression in rat livers are presented in Figs. 5 and 6, respectively. The results of the RT-qPCR assay indicated that treatment with GE at all concentrations (0.36, 0.43 and 0.54 g/kg) significantly inhibited GSTm1 mRNA expression in a dose-dependent manner. However, in the GE and MP combination group, the mRNA expression of GSTm1 was increased as compared with that in the high-dose GE group. Western blot analysis revealed the same effects on GSTm1 protein expression as those on the respective mRNA levels. The results indicated that downregulation of GSTm1 expression by GE was counteracted by MP.
Figure 5.
Reverse-transcription quantitative polymerase chain reaction analysis of hepatic GST using amplimers of GSTm1 and GST-pi. Gels displaying bands for (A) GSTm1 and (B) GST-pi. Quantification of (C) the GSTm1/β-actin ratio and (D) the GST-pi/β-actin ratio. Lanes: a, control group; b, GE and aqueous extract of Ramulus et Folium Mussaendae pubescentis combination group; c, high-dose GE group; d, medium-dose GE group; e, low-dose GE group. *P<0.05, **P<0.01 vs. control; #P<0.05, ##P<0.01 vs. high-dose GE group. GE, Herba Gelsemii elegantis dichloromethane extract; GSTm1, glutathione S-transferase mu 1.
Figure 6.
Western blot analysis of hepatic GST that used antibodies against GSTm1 and GST-pi. Western blot bands for (A) GSTm1 and (B) GST-pi. Quantification of (C) the GSTm1/β-actin ratio and (D) the GST-pi/β-actin ratio. Lanes: a, control group; b, GE and aqueous extract of Ramulus et Folium Mussaendae pubescentis combination group; c, high-dose GE group; d, medium-dose GE group; e, low-dose GE group. *P<0.05 vs. control; #P<0.05 vs. high-dose GE group. GE, Herba Gelsemii elegantis dichloromethane extract; GSTm1, glutathione S-transferase mu 1.
To further explore the modulation effects on hepatic GST, the present study examined the mRNA and protein expression of GST-pi (Figs. 5 and 6, respectively). The results of the RT-qPCR assay indicated that all treatments caused an evident decline in GST-pi mRNA expression as compared with the control. The greatest decline was observed in the high-dose GE group. Combined treatment with MP slightly increased the mRNA expression of GST-pi as compared with that in the high-dose GE group, but the difference was not statistically significant. The results of the western blot analysis illustrated that the pattern of protein expression was similar to that for the respective mRNA levels.
As presented in Fig. 7, administration of GE alone markedly decreased the activity of GST, and this inhibitory effect was dose-dependent. However, rats treated with GE + MP were significantly protected from the decrease in GST activity produced by GE. This result suggested that GST activity was enhanced after cotreatment with MP.
Figure 7.
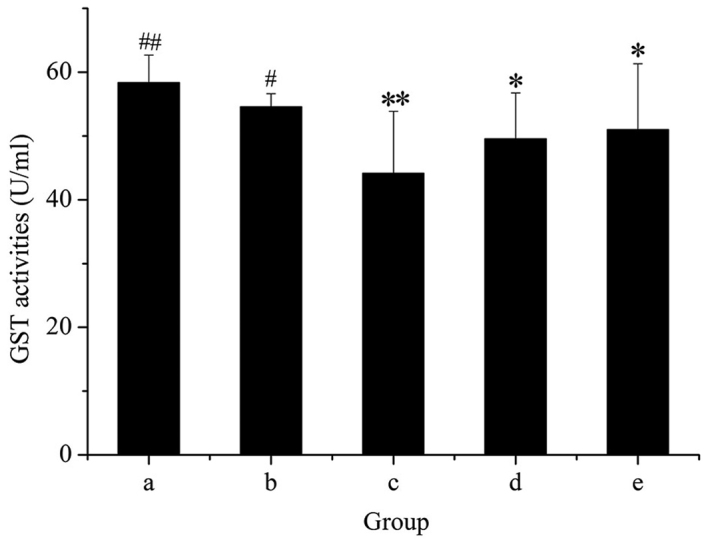
Colorimetric analysis of hepatic GST activity. Groups: a, control group; b, GE and aqueous extract of Ramulus et Folium Mussaendae pubescentis combination group; c, high-dose GE group; d, medium-dose GE group; e, low-dose GE group. *P<0.05, **P<0.01 vs. control; #P<0.05, ##P<0.01 vs. high-dose GE group. GE, Herba Gelsemii elegantis dichloromethane extract; GST, glutathione S-transferase.
Discussion
The liver, as an important organ of metabolism and excretion, is frequently endowed with the task of detoxification. Detoxification mechanisms are generally considered to be associated with induction or inhibition phase-I metabolic enzymes and phase-II detoxification enzymes. CYP450 enzymes, which are significant phase-I metabolic enzymes, have a vital role in the metabolism of xenobiotics and endogenous substances (18). Of particular interest in an in vitro toxicity study of GE was the involvement of CYP2E1 and CYP1A2 in its metabolism (9). In the present study, GE inhibited the mRNA and protein expression of CYP2E1 and CYP1A2. However, administration of GE + MP increased the mRNA and protein expression of CYP2E1 and CYP1A2 as compared with that in the group treated with GE alone. This result suggested a potential induction effect of MP on rat hepatic CYP450 inhibited by GE. However, this result was not in accordance with the increased expression of CYP2E1 in the case of liver injury (19). Several factors may explain for this difference. First, GE may have been so poisonous that the enzyme's expression was deactivated following continuous administration of GE. Furthermore, the exogenous toxicant was transformed into its metabolic intermediate by phase-I metabolic enzymes, followed by later involvement of phase-II detoxification enzymes. Therefore, the modulation effect of GST as a phase-II enzyme was explored in the subsequent experiments.
GST, an important phase-II detoxification enzyme, is a soluble protein located in the cytosol that functionally binds GSH, as well as xenobiotics or endogenous substances (10). It has a significant role in the detoxification and excretion of xenobiotics or metabolic intermediates, since it increases the solubility of hydrophobic substances (20). Following assessment of the inhibition of the CYP450 pathway by GE and the counteracting effect of MP, the detoxification pathway involving GST was then investigated. The results indicated that GE inhibited GST activity as well as the mRNA and protein expression of GSTm1 and GST-pi. However, the rats cotreated with MP were significantly protected from the decrease in the activity, as well as mRNA and protein expression of GSTm1 produced by GE. This result indicated a potential induction effect of MP on GST to counteract the inhibition by GE in rat livers. This modulation may explain for the role of MP in reducing the acute intoxication effect of GE.
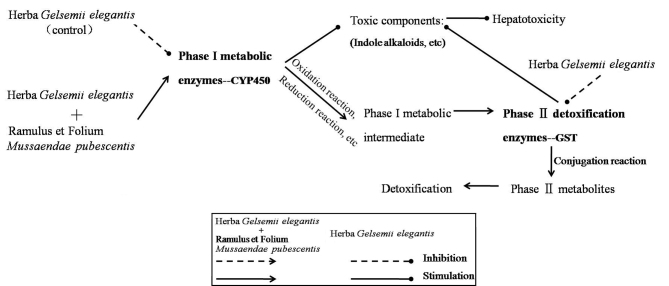
The scheme in Fig. 8 summarizes the mechanism deduced from the results obtained in the present study. By inhibiting the expression of CYP450 and GST, GE decreased phase I and II metabolic enzyme activity, which metabolizes indole alkaloids and other toxic components (9). Following co-treatment with MP, detoxification was achieved through upregulation of CYP450 expression in phase I metabolites [oxidation/reduction reaction of toxic components (21)] and enhancing GST enzyme activity in phase II metabolites [conjugation reaction of phase I metabolites (10)]. It was demonstrated that MP had a potent detoxification effect upon GE-induced acute intoxication in rat livers. The detoxification mechanism may in part comprise the modulation of CYP450 and GST enzymes. These results suggested that MP may allow for the pharmaceutical application of GE due to reducing its toxic side effects. Further study to characterize the active components of MP and to elucidate the mechanisms of action is in progress.
Figure 8.
Potential mechanisms for the detoxification of Herba Gelsemii elegantis dichloromethane extract by aqueous extract of Ramulus et Folium Mussaendae pubescentis via inhibition of phase I and phase II enzymes in rats. GST, glutathione S-transferase; CYP450, cytochrome P450.
Acknowledgements
The present study was supported by the National Natural Science Foundation of China (grant nos. 81773921 and 81303240) and the Specialized Research Fund for the Doctoral Program of Higher Education (grant no. 20133519110005).
References
- 1.Xu Y, Qiu HQ, Liu H, Liu M, Huang ZY, Yang J, Su YP, Yu CX. Effects of koumine, an alkaloid of Gelsemium elegans Benth., on inflammatory and neuropathic pain models and possible mechanism with allopregnanolone. Pharmacol Biochem Behav. 2012;101:504–514. doi: 10.1016/j.pbb.2012.02.009. [DOI] [PubMed] [Google Scholar]
- 2.Editorial Committee of Chinese Materia Medica, corp-author. the Administration Bureau of Traditional Chinese Medicine: Chinese Materia Medica (ZhonghuaBencao) Shanghai Science and Technology: Shanghai. 2000;6:1–215. [Google Scholar]
- 3.Rujjanawate C, Kanjanapothi D, Panthong A. Pharmacological effect and toxicity of alkaloids from gelsemium elegans benth. J Ethnopharmacol. 2003;89:91–95. doi: 10.1016/S0378-8741(03)00267-8. [DOI] [PubMed] [Google Scholar]
- 4.Yang F, Lu Y, Li Y, Meng ZQ, Liang NS. Experimental research on antineoplastic effect of extract from Gelsemiu Elegans Benth. Guangxi Zhong Yi Yao. 2004;1:51–53. (In Chinese) [Google Scholar]
- 5.Yang CS, Chhabra SK, Hong JY, Smith TJ. Mechanisms of inhibition of chemical toxicity and carcinogenesis by diallyl sulfide (DAS) and related compounds from garlic. J Nutr. 2001;131:1041S–1045S. doi: 10.1093/jn/131.3.1041S. [DOI] [PubMed] [Google Scholar]
- 6.Ronis MJJ, Lindros KO, Ingelman S. The cytochrome P450 2E subfamily. In: Ioannides C, editor. Cytochromes P450, metabolic and toxicological aspects. CRC Press; Boca Raton, FL: 1996. pp. 211–239. [Google Scholar]
- 7.Bradford BU, Kono H, Isayama F, Kosyk O, Wheeler MD, Akiyama TE, Bleye L, Krausz KW, Gonzalez FJ, Koop DR, Rusyn I. Cytochrome P450 CYP2E1, but not nicotinamide adenine dinucleotide phosphate oxidase, is required for ethanol-induced oxidative DNA damage in rodent liver. Hepatology. 2005;41:336–344. doi: 10.1002/hep.20532. [DOI] [PubMed] [Google Scholar]
- 8.Gallagher EP, Kunze KL, Stapleton PL, Eaton DL. The kinetics of aflatoxin B1 oxidation by human cDNA-expressed and human liver microsomal cytochromes P450 1A2 and 3A4. Toxicol Appl Pharmacol. 1996;141:595–606. doi: 10.1006/taap.1996.0326. [DOI] [PubMed] [Google Scholar]
- 9.Wang Y, Wu S, Chen Z, Zhang H, Zhao W. Inhibitory effects of cytochrome P450 enzymes CYP1A2, CYP2A6, CYP2E1 and CYP3A4 by extracts and alkaloids of gelsemium elegans roots. J Ethnopharmacol. 2015;166:66–73. doi: 10.1016/j.jep.2015.03.002. [DOI] [PubMed] [Google Scholar]
- 10.Dourado DF, Fernandes PA, Ramos MJ. Glutathione transferase classes alpha, pi, and mu: GSH activation mechanism. J Phys Chem B. 2010;114:12972–12980. doi: 10.1021/jp1053875. [DOI] [PubMed] [Google Scholar]
- 11.Townsend DM, Manevich Y, He L, Hutchens S, Pazoles CJ, Tew KD. Novel role for glutathione S-transferase pi. regulator of protein S-glutathionylation following oxidative and nitrosative stress. J Biol Chem. 2009;284:436–445. doi: 10.1074/jbc.M805586200. [DOI] [PMC free article] [PubMed] [Google Scholar]
- 12.Lu TL, Su LL, Ji D, Gu W, Mao CQ. Interaction between CYP450 enzymes and metabolism of traditional chinese medicine as well as enzyme activity assay. Zhongguo Zhong Yao Za Zhi. 2015;40:3524–3529. (In Chinese) [PubMed] [Google Scholar]
- 13.Wang Y, Wu S, Li D, Wang H. Uniform design research on the compatibility toxicity of Gelsemium Elegans Benth and Mussaenda Pubescens. Chin J Mod Appl Pharm. 2016;2:150–154. [Google Scholar]
- 14.Lu XH, Wang YH, Wang HS, Li DS, Wu SS. Study on the HPLC fingerprint of chemical constituents in dichloromethane extraction of gelsemium elegans. Shizhen Guo Yi Guo Yao. 2016;5:1055–1057. (In Chinese) [Google Scholar]
- 15.Yu HM, Lu XH, Wang YH, Wu SS. Establishment of determination method of total triterpenoids in Mussaendapubescens. J Liaoning Univ TCM. 2015;2:40–42. [Google Scholar]
- 16.Spencer WE, Christensen MJ. Multiplex relative RT-PCR method for verification of differential gene expression. Bio Techniques. 1999;27:1044–1046. doi: 10.2144/99275rr04. [DOI] [PubMed] [Google Scholar]
- 17.Habig WH, Pabst MJ, Jacoby WB. Glutathiene S-transferases. The first enzymatic step in the mercapturic acid formation. J Biol Chem. 1974;249:7130–7139. [PubMed] [Google Scholar]
- 18.Autrup H. Genetic polymorphisms in human xenobiotica metabolizing enzymes as susceptibility factors in toxic response. Mutat Res. 2000;464:65–76. doi: 10.1016/S1383-5718(99)00167-9. [DOI] [PubMed] [Google Scholar]
- 19.Li L, Li W, Kim YH, Lee YW. Chlorella vulgaris extract ameliorates carbon tetrachloride-induced acute hepatic injury in mice. Exp Toxicol Pathol. 2013;65:73–80. doi: 10.1016/j.etp.2011.06.003. [DOI] [PubMed] [Google Scholar]
- 20.Truong Q, Bradley SA, Doss GA, Kumar S, Reddy VB. Glutathione S-transferase catalyzed desulfonylation of a sulfonylfuropyridine. Drug Metab Dispos. 2010;38:108–114. doi: 10.1124/dmd.109.029801. [DOI] [PubMed] [Google Scholar]
- 21.Vancutsem PM, Babish JG. In vitro and in vivo study the effects of enrofloxacin on hepatic cytochrome P450. potential for drug interactions. Vet-Hum Toxicol. 1996;38:254–256. [PubMed] [Google Scholar]


