

Abstract
Introduction:
A cross-sectional study on occupational stress was conducted on loco pilots in 2008, in view of loco pilots being one of the high strain jobs in Indian Railways. Subsequently, a comparative cross-sectional study on occupational stress was conducted among section controllers in 2011, which is another high strain job of Indian Railways.
Objective:
The studies were conducted to analyze and compare occupational stress and hypertension.
Setting and Design:
A cross-sectional study on occupational stress and hypertension was conducted among 230 loco pilots in 2008, and subsequently, a comparative cross-sectional study was conducted among 82 section controllers in 2011.
Materials and Methods:
A closed end 24 item questionnaire on occupational stress was administered. Systolic blood pressure above 140 mmHg and diastolic blood pressure above 90 mmHg were considered as hypertension as per the VII Joint National Committee. Chi-square test and t-test were used for testing significance at P < 0.05.
Results:
The mean stress score was 8.56 in loco pilots and 7.32 in section controllers. The number of loco pilots with more than 12 stress factors was 49 (21.3%) and the number of section controllers with more than 12 stress factors was 7 (8.5%). The number employees with more than 12 stress factors in different categories of loco pilots were 30 (32%) in the goods category, 12 (12%) in the mail/passenger category, and 7 (19%) in the shunter category, and 3 (11%) in the supervisory category and 4 (7%) in the on-board category of section controllers. The prevalence of hypertension in loco pilots was 36.52% (84) and in the section controllers was 53.66% (44). The prevalence of hypertension in the category with more than 12 stress factors was 30.61% (15) in the loco pilots and 28.57% (2) in the section controllers. The prevalence of hypertension in the both the study groups were higher in the older age, with a family history of hypertension, and with a body mass index of more than 25 kg/m2. The mean occupational stress and employees with more than 12 stress factors were higher in the loco pilots group. The goods category of loco pilots had highest stress factors. The prevalence of hypertension was high in the category with risk factors such as older age, family history of hypertension and BMI above 25 kg/m2.
Keywords: Category and hypertension, loco pilots, occupational stress, section controllers
INTRODUCTION
Railway loco pilots are important members of the Indian Railways. The job requires alertness and concentration of the staff. The section controllers of the Operating Department of Railways manage train movement. The section controllers work in the control rooms at the major railway stations at Bangalore, Mysore, and Hubli in the South Western Railway of Indian Railways. They manage the movement of the trains between stations. The section controller job requires alertness, concentration, and decision making. The loco pilot and section controller jobs are high strain jobs with high demand.
Robert Karasek,[1] a sociologist at the University of Massachusetts, developed the concept of the Job Demand Control model in 1979, which showed that job strain occurs in a work environment with considerable demand and low control. He classified jobs into four psychological categories. Active jobs are high demand jobs with high control such as physicians, engineers, and teachers. High strain jobs are high demand jobs with low control such as industrial establishments, service organizations, and transport establishments. Low strain jobs are low demand jobs with high control such as architects and natural scientists. Passive jobs are low demand jobs with low control such as watchman and janitor. High strain jobs are associated with a risk of coronary artery disease.
Dr. Schnall,[2] Director, Social Epidemiologist, explained that production line personnel with low control are far more likely to have hypertension than managers or executives. The passive jobs at the other end of the spectrum are equally bad and tend to have an association with mental disorders and are prone to becoming demoralized and apathetic.
The Effort Reward Imbalance Model of Siegrist J[3] emphasizes on reward rather than the control structure of the work. The rewards are three transmitter systems, i.e., either money (adequate salary), esteem (respect), or security/career opportunities (promotion, job security). Thus, a high demand job that does not include any of the above three is an example of an imbalance model.
Dr. Dingli Xu,[4] Southern Medical University, China, in a meta-analysis study reported that epidemiological studies have shown that high strain jobs are associated with an increased risk for coronary heart disease; this meta-analysis included data from more than 130,000 individuals and found that being exposed to high strain jobs was associated with an increased risk of stroke. The researchers calculated a population attributable risk for stroke with high strain jobs of 4.4% overall and 6.5% for women, especially for ischemic stroke. The harmful effect of work stress may be more significant in women.
Hypertension is a cardiovascular risk factor and one of the important cause for cerebrovascular disease stroke, ischemic heart disease, and chronic renal disease. Hypertension is an important public health problem in India and annually causes 1.1 million deaths (globally 9.4 millions) as per Rajeev Gupta et al.[5] accounting for 10.8% of all deaths and 4.6% of all disability adjusted life years (DALYs).
The overall prevalence of hypertension in India was 29.8% and regional prevalence was 27.6% in rural India and 33.8% in Urban India as per Anchala et al.[6]
Hypertension being asymptomatic, it is important to check blood pressure regularly and organizations' must conduct regular screening for blood pressure.
A cross-sectional study on occupational stress and hypertension was conducted among loco pilots in 2008. Subsequently, a cross-sectional study on occupational stress and hypertension was conducted among section controllers in 2011 for comparing occupational stress and hypertension among the loco pilots and section controllers.
Objective
The study among loco pilots was conducted to analyze the occupational stress and hypertension in loco pilots. The study among section controllers was conducted to analyze the occupational stress and hypertension in section controllers, as well as to compare the findings with those of loco pilots.
MATERIALS AND METHODS
The study group consisted of 230 loco pilots (engine drivers). Loco pilots working in the Bangalore Division of South Western Railways were included as the study population. The work and work-related stress of the loco pilots was discussed with senior loco pilots along with a member of the loco pilots' association. A closed-ended occupational stress questionnaire was prepared as per the stress factors discussed with the senior loco pilots. The questionnaire was tested by conducting a pilot study on 30 loco pilots and was modified accordingly. Written consent for the study was obtained from the controlling officer of the loco pilots, and an oral consent was obtained from the loco pilots at the time of interview. The study among loco pilots was conducted between April 2008 and October 2008. All the loco pilots working at Bangalore, Byappanahalli, and Jolarpettai stations and deemed fit to attend their duty were informed about the study and called for examination. They were examined in the crew control rooms at the above mentioned railway stations where they report for duty to receive their train movement. Each station was visited three to four times to include all the loco pilots working at the three stations. The 24-item, closed-ended questionnaire was administered by the investigator orally to the loco pilots and the responses were simultaneously entered in the questionnaire. Each occupational stress question was considered to be a stress factor. Employees with more than 12 positive stress factors (50%) out of the 24 questions were considered to have occupational stress in the study. Blood pressure was recorded using a mercury sphygmomanometer in the sitting posture by the investigator. The average of the three readings was taken as the employee's blood pressure. The systolic blood pressure above 140 mmHg and diastolic blood pressure above 90 mmHg was considered to be hypertension as per the VII Joint National Committee. Employees with blood pressure levels above the normal were re-examined after one or two days, and if the blood pressure continued to be above the normal even on the third occasion, the employee was referred to the Railway Hospital for further management and was considered to be hypertensive. The known hypertension employees were considered to be hypertensives. Statistical significance was tested applying Chi-square test for comparison between the loco pilots and section controllers, the two study groups, and between different categories of the two study groups, with test of significance at P < 0.05. The t-test was applied for testing the mean of the stress scores between the two study groups and between the different categories of individual study groups, with a test of significance at P < 0.05.
The occupational stress study of the loco pilots showed that occupational stress was higher in the younger and goods category of loco pilots. There was no relation between the occupational stress and hypertension. In view of the above results, a comparative study was planned. The section controller job, being one of the high strain jobs of Indian Railways, was selected for conducting a comparative study on occupational stress. The section controller study group consisted of 82 section controllers working in the South Western Railway at Hubballi, Bangalore, and Mysore Divisional offices. The study was conducted in 2011 after obtaining written consent from the controlling officers of the section controllers. The section controllers were examined in the annexure of the control rooms at Hubballi, Bangalore, and Mysore Railway Divisional offices. All the section controllers on the rolls at the three divisional offices and fit to attend their duty were examined. Oral consent was taken from the employees at the time of interview, and the closed-ended 24-item questionnaire was administered by the investigator to the section controllers; blood pressure was measured by the investigator in the sitting posture.
Limitations of the study
The first cross-sectional study was conducted on loco pilots in 2008, subsequently, to compare results obtained in the study of occupational stress and hypertension among loco pilots; the second cross-sectional study was conducted on section controllers in 2011. The second study was conducted similar to the first study, using the same occupational stress factors to assess the occupational stress in section controllers. The limitation of the study was that the two studies were conducted at different periods with an interval of 3 years.
RESULTS
The study groups were classified according to age into 2 categories, less than 41 years and more than 40 years. There were 104 (45.2%) employees less than 41 years of age and 126 (54.8%) employees more than 40 years of age in the loco pilot group, and there were 20 (24.4%) employees less than 41 years of age and 62 (75.6%) employees more than 40 years of age in the section controller group.
The loco pilots study group was classified into three categories, i.e., the goods category, mail/passenger category, and shunter category. The section controller study group was classified into two categories, i.e., the on-board (6 hours) category and supervisory (8 hours) category. There were 94 (40.9%) employees in the goods category, 99 (43%) in the mail/passenger category, and 37 (16.1%) employees in the shunter category of the loco pilot study group. There were 55 (67.1%) employees in the on-board (6 hours) category and 27 (32.9%) employees in the supervisory (8 hours) category of section controller study group.
The mean stress score in loco pilots was 8.56 with a standard deviation (SD) of ± 4.3 and the mean stress score in section controllers was 7.32 with a SD of ± 3.7. t-test score was 2.4606 and P value was 0.022632 (significant at < 0.05) [Table 1]
The number of loco pilots with more than 12 stress factors was 49 (21.3%) and the mean stress score in this category was 15.16 with a SD of ±1.94. The number of section controllers with more than 12 stress factors was 7 (8.5%), and the mean stress score in this category was 14.7 with a SD of ±1.28. The Chi-square score between the two stress categories of the two study groups was 6.691, which was statistically significant at P < 0.01 (0.00969) [Table 1]
The mean stress scores of the different categories of loco pilots was 10.2 in the goods category, 7.36 in the mail/passenger category, and 7.5 in the shunter category. The mean stress scores for the different categories of section controllers were 8.04 in the supervisory category and 6.96 in the on-board category [Table 2]
The number of employees with more than 12 stress factors in the different categories of loco pilots was 30 (32%) in the goods category, 12 (12%) in the mail/passenger category, and 7 (19%) in the shunter category [Table 2]; the Chi-square score was 11.4175 and the P value was 0.003317, which was significant. The number of employees with more than 12 stress factors in the different categories of section controllers was 3 (11%) in the supervisory category and 4 (7%) in the on-board category [Table 2]; the Chi-square score was 0.3417 and the P value was 0.558835, which was not statistically significant
The relation between the number of employees with more than 12 stress scores and age in the loco pilots was 36 (34.62%) in the less than 41 years age group and 13 (10.32%) in the more than 40 years age group; the Chi-square score was 20.063 with a P value of < 0.00001, which was significant. The number of employees with more than 12 stress scores and age in the section controllers was 2 (10%) in the less than 41 years age group and 5 (8.06%) in the more than 40 years age group; the Chi-square score was 0.0726 and P value was 0.78765, which was not significant
Five stress factors were present in more than 50% of the study groups of loco pilots and section controllers. The stress factor (a) job is demanding and increased was present in 166 (72%) loco pilots and 68 (82.9%) section controllers. The stress factor (b) lots of responsibilities in the job was present in 230 (100%) loco pilots and 82 (100%) section controllers. The stress factor (c) noise disturbance at work place was present in 204 (89%) loco pilots and 49 (59.8%) section controllers, and the Chi-square score was 33.0147, which was statistically significant at P < 0.01. The stress factor, (d) conflicts in meeting the demands of the job and family was present in 134 (58%) loco pilots and in 42 (51.2%) section controllers. The stress factor, (e) work interferes with family responsibilities was present in 171 (74%) loco pilots and 41 (50%) section controllers; the Chi-square score was 16.454, which was statistically significant at P < 0.01
The prevalence of hypertension in the loco pilots was 36.5% (84) and that in the section controllers was 53.7% (44) [Table 3]; the chi square score was 7.337, which was statistically significant at P < 0.01. The lower prevalence of hypertension in loco pilots could be due to regular periodic medical examination
-
The prevalence of hypertension with relation to more than 12 stress factors was 30.6% (15) in the loco pilots and 28.6% (2) in the section controllers [Table 3]; the Chi-square score between the two stress categories with hypertension in the two study groups was 4.4426 and P value was 0.035053, which was significant at < 0.05.
Rosenthal et al.[7] reported that the possible relation between job strain and blood pressure levels has been extensively studied but the literature is replete with conflicting results regarding the relationship between occupational stress and hypertension
The number of employees with relation to more than 12 stress factors and hypertension in the different categories of loco pilots was 36.6% (11) in the goods category, 25% (03) in the mail/passenger category, and 14.3% (01) in the shunter category; the Chi-square score was 13.1832 and P value was 0.00137, which was significant at <0.01. Among the section controllers, it was 33.3% (01) in the supervisory category and 25% (01) in the on-board category [Table 4]; the chi square was 0.1141 and the P value was not significant
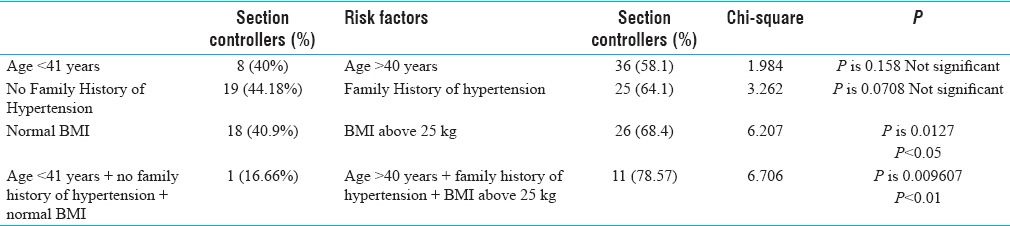
The prevalence of hypertension with relation to the combined factors of age less than 41 years, no family history of hypertension, and normal weight in loco pilots was 17.24% (5) and in the combined factors of more than 40 years of age with family history of hypertension and overweight/obesity (BMI >25 kg/m2) was 73.08% (19) [Table 5]; the Chi-square score was 17.377 and the P value is 0.000031 (significant at < 0.0001). In the section controllers, the prevalence of hypertension in the combined category of age less than 41 years with no family history of hypertension and normal weight (BMI <25 kg/m2) was 16.66% (1) and in the combined category with age more than 40 years with family history of hypertension and overweight/obesity was 78.57% (11) [Table 6]; the Chi-square score was 6.706 and P value was 0.0096 (significant at < 0.01).
Table 1.
Stress scores of the two study groups
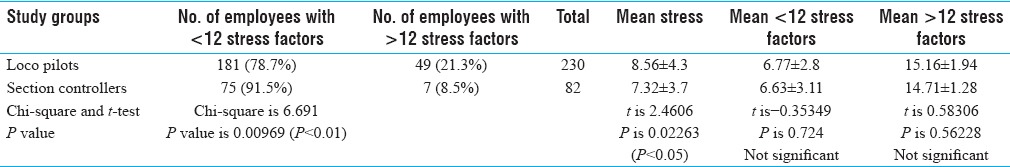
Table 2.
Mean stress scores and more than 12 stress factors in different categories
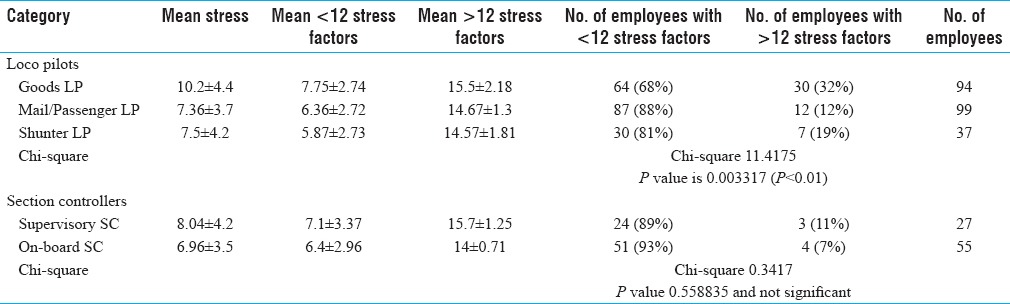
Table 3.
Hypertension and stress scores in the two study groups
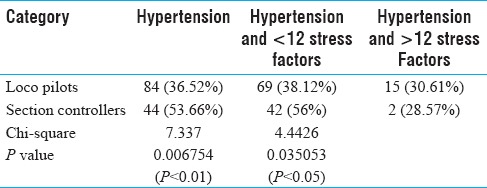
Table 4.
Hypertension and different categories of the two study groups
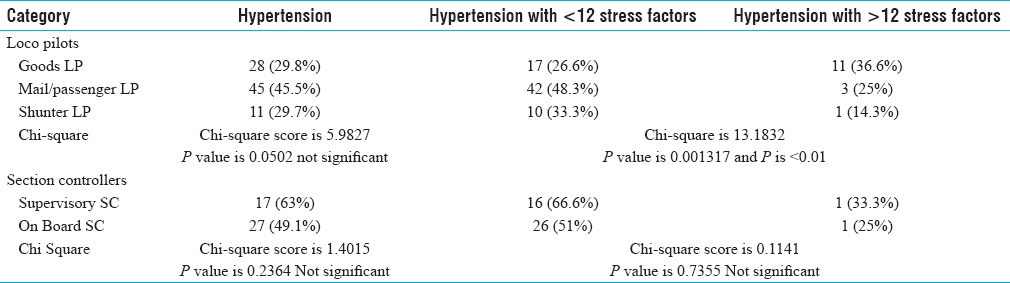
Table 5.
Hypertension and age, BMI, and family history hypertension in loco pilots
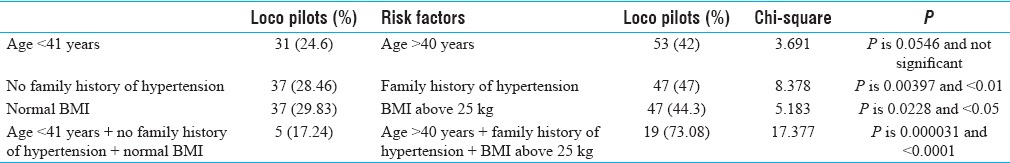
Table 6.
Hypertension and age, BMI, and family history of hypertension in section controllers
DISCUSSION
The mean occupational stress was comparatively higher in the loco pilots group. The number of employees with more than 12 stress factors was higher in the loco pilot study group
The mean stress score was highest in the goods category of the loco pilots. The number of employees with more than 12 stress factors was the highest in the goods category of loco pilots
The employees with more than 12 stress factors with relation to the age were highest in the age with age less than 41 years in the loco pilot group
The five stress factors present in more than 50% of both the study groups of loco pilots and section controllers were (a) job is demanding and increased, (b) lots of responsibilities in the job, (c) noise disturbance at work place, (d) conflicts in meeting the demands of the job and family, and (e) work interferes with family responsibilities
The prevalence of hypertension was higher in the category with 12 and less than 12 stress factors compared to more than 12 stress factors in both the study groups
The number of employees with hypertension and more than 12 stress factors were the highest in the goods category of loco pilots
The prevalence of hypertension with relation to age, family history of hypertension, and BMI either individually or in combination, was higher in the categories with older age, with family history of hypertension and BMI above 25 kg/m2 in both the study groups.
Recommendations
The loco pilots and section controllers to be counselled regarding the occupational stresses discussed in this study. The loco pilots with less than 41 years of age and the goods categories working conditions to be reviewed. The loco pilots and section controllers to be counselled on hypertension and lifestyle modifications such as regular exercise (physical activity), maintaining normal weight, healthy food habits, reduced salt intake and stop smoking.
Scheduled programme of periodic medical examination for the staff and executives and monitoring hypertension as well as other lifestyle and noncommunicable diseases. Maintain health records of the employees for easy retrieval and review.
Financial support and sponsorship
Nil.
Conflicts of interest
There are no conflicts of interest.
REFERENCES
- 1.Karasek R, Brisson C, Kawakami N, Houtman I, Bongers P, Amick B. The Job Content Questionnaire (JCQ): an instrument for internationally comparative assessments of psychosocial job characteristics. J Occup Health Psychol. 1998;3:322–55. doi: 10.1037//1076-8998.3.4.322. [DOI] [PubMed] [Google Scholar]
- 2.Barrera M. Who's to blame for job strain? Occup Health Saf. 2008;77:34,36,38. [PubMed] [Google Scholar]
- 3.de Jonge J, Bosma H, Peter R, Siegrist J. Job strain, effort-reward imbalance and employee well-being. Soc Sci Med. 2000;50:1317–27. doi: 10.1016/s0277-9536(99)00388-3. [DOI] [PubMed] [Google Scholar]
- 4.Huang Y, Xu S, Hua J, Zhu D, Liu C, Hu Y, et al. Association between job strain and risk of incident stroke: A meta-analysis. Neurology. 2015;85:1648–54. doi: 10.1212/WNL.0000000000002098. [DOI] [PubMed] [Google Scholar]
- 5.Gupta R, Yusuf S. Towards better hypertension management in India. Indian J Med Res. 2014;139:657–60. [PMC free article] [PubMed] [Google Scholar]
- 6.Anchala R, Kannuri NK, Pant H, Khan H, Franco OH, Di Angelantonio E, et al. A systematic review and Meta-analysis of prevalence, awareness and control of hypertension. J Hypertension. 2014;32:1170–7. doi: 10.1097/HJH.0000000000000146. [DOI] [PMC free article] [PubMed] [Google Scholar]
- 7.Rosenthal T, Alter A. Occupational stress and hypertension. J Am Soc Hypertens. 2012;6:2–22. doi: 10.1016/j.jash.2011.09.002. [DOI] [PubMed] [Google Scholar]