

Abstract
Background:
Saliva is a unique fluid, which is important for normal functioning of the oral cavity. Diabetes mellitus (DM) is a disease of absolute or relative insulin deficiency characterized by insufficient secretion of insulin by pancreatic beta-cells. The diagnosis of diabetes through blood is difficult in children, older adults, debilitated and chronically ill patients, so diagnosis by analysis of saliva can be potentially valuable as collection of saliva is noninvasive, easier and technically insensitive, unlike blood. The aim of the study was to correlate blood glucose level (BGL) and salivary glucose level (SGL) in DM patients.
Methodology:
A cross-sectional study was conducted in 120 patients, who were categorized as 40 controlled diabetics, 40 uncontrolled diabetics and 40 healthy, age- and sex-matched individuals constituted the controls. The blood and unstimulated saliva samples were collected from the patients at the different intervals for fasting, random and postprandial levels. These samples were then subjected for analysis of glucose in blood and saliva using glucose oxidase/peroxidase reagent in HITACHI 902(R) Automatic analyzer, and the results were recorded.
Results:
The mean SGLs were higher in uncontrolled and controlled diabetic groups than in nondiabetic group. A highly statistically significant correlation was found between fasting saliva glucose and fasting blood glucose in all the groups.
Conclusion:
With increase in BGL, increase in SGL was observed in patients with diabetes suggesting that SGL can be used for monitoring glycemic level in DM.
Keywords: Blood glucose, diabetes mellitus, fasting, glucose, postprandial hyperglycemia, saliva
INTRODUCTION
Diabetes mellitus (DM) is perhaps one of the oldest diseases known to humankind. Egyptian manuscript reported it for the first time about 3000 years ago.[1] DM is a combination of heterogeneous disorders commonly presenting with glucose intolerance as well as hyperglycemia, as a result of lack of insulin, defective insulin action, or both.[2] Diabetes has become a common global health problem worldwide. It has turned out to be one of the leading reasons of death and disability.[3]
The International Diabetes Federation's most recent estimates indicate that around 8.3% of adults (382 million individuals) are suffering from this disease.[4]
The main concern is that this figure is set to rise further by 592 million in not more than 25 years. With 175 million of undiagnosed cases at present, an enormous crowd with diabetes are rolling in the direction of complications unprepared.[4] Prevention, well-timed diagnosis and management are important in patients with DM.[5]
For this reason, the investigative procedures must be customarily employed to diagnose and monitor diabetes. The most consistently employed procedures are blood investigations. These are invasive procedures and offer a great deal of discomfort and anxiety, especially to pediatric and geriatric patients. Considering this, there is a critical need for the development of noninvasive procedure for diagnosing and monitoring diabetes.[6]
Saliva is only one of its kind and curiosity in it as a diagnostic media has vastly developed.[7]
The aim of our study was to evaluate the “Correlation of salivary glucose level with blood glucose level in diabetes mellitus.”
Source of data and sample size
The present study was conducted in the Department of Oral Pathology and Microbiology, Teerthanker Mahaveer Dental College and Research Centre, Moradabad, on individuals with ages ranging from 20 to 75 years.
Inclusion criteria:
Patients diagnosed with DM in age range 20–75 years
Age- and gender-matched healthy individuals for control.
Exclusion criteria:
Patients having any other systemic diseases and on regular medication for the same
Pregnant women
Mentally compromised
Uncooperative patients.
The present study included 120 patients who were categorized into 3 groups, each consisting of 40 patients.
Group A: Patients with controlled DM
Group B: Patients with uncontrolled DM
Group C: Age- and sex-matched healthy nondiabetic individuals (control).
METHODOLOGY
Saliva and blood samples were collected from the patients at the different intervals; after 8 h of fasting, that is, in the morning before 9 am; postprandial, after 2 h of having food and randomly, that is, at any time of the day.
Salivary sample collection
The unstimulated whole saliva was used for the estimation of salivary glucose. Unstimulated whole saliva (2 ml) was collected by draining method with study participants sitting straight in a comfortable position in a calm isolated room.
Blood sample collection
A volume of 2 ml of peripheral venous blood was collected from the antecubital vein with syringe into a sterile test-tube.
Salivary glucose and blood glucose estimation
Each unstimulated saliva sample and blood sample were centrifuged at 3000 rpm for 20 min. Clear supernatants were processed immediately for estimation of glucose. Glucose was analyzed by glucose oxidase end-point assay. HITACHI® 902 Automatic analyzer was used for the estimation of glucose and readings were noted for both.
RESULTS
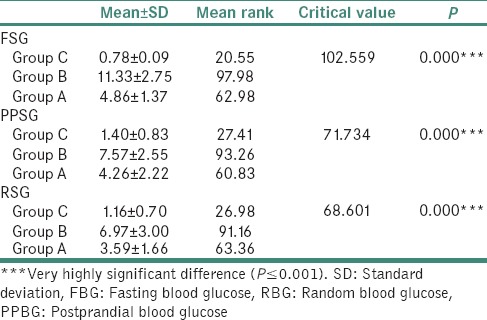
The mean fasting blood glucose (FBG), postprandial blood glucose (PPBG), random blood glucose (RBG) and fasting saliva glucose (FSG), postprandial salivary glucose (PPSG), random salivary glucose (RSG) was compared among Group C, Group B and Group A using the Kruskal–Wallis test. There was a significant difference across the 3 groups [Tables 1 and 2].
Table 1.
Comparison of mean FBG, PPBG and RBG among Group C, Group B and Group A using the Kruskal-wallis test
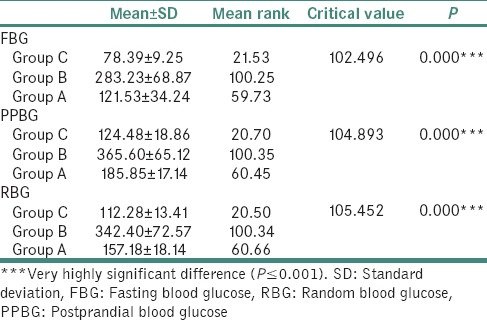
Table 2.
Comparison of mean FSG, PPSG and RSG among Group C, Group B and Group A using the Kruskal-wallis test
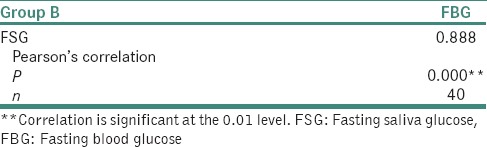
The correlation between FBG and FSG was assessed for all 3 groups using the Pearson's correlation test. There was a significant correlation between FBG and FSG [Tables 3–5].
Table 3.
Correlation between FBG and FSG for Group C using the Pearson's Correlation test
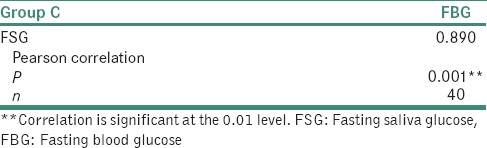
Table 5.
Correlation between FBG and FSG for Group A, using the Pearson's Correlation test
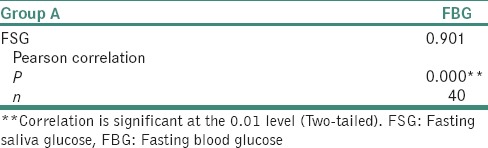
Table 4.
Correlation between FBG and FSG for Group B using the Pearson's Correlation test
DISCUSSION
Diabetes is one of the globally wide-spread disease. Blood is taken as analytical body fluid for its diagnosis. A range of diagnostic devices is available in the market to determine the blood glucose level (BGL). A need arises to establish a noninvasive procedure to establish the glucose level without taking blood.[8]
Saliva has a great role in the homeostasis of the oral cavity because it stabilizes the ecosystem of the oral cavity; and hence, it serves as a brilliant marker to timely discover the disease that further leads to more successful treatment, risk estimation, estimation of glucose level and it is a simple, noninvasive alternative to blood and urine tests.[9,10] Saliva is said to be the ultrafiltrate of blood. Glucose is one of the blood components that are transferable across the salivary gland epithelium in proportion to its concentration in blood. Whole saliva is the biologic fluid that is simple to collect.[10] If a glucose level measuring procedure is developed that can monitor glucose level noninvasively, it will make early detection of DM possible.[8]
Of all salivary parameters, salivary glucose, appears to be most closely related to the oral environment in patients with diabetes. Normal glucose levels in saliva are 0.5–1.00 mg/100 ml and do not considerably have an effect on oral health or support the growth of microorganisms.
Biochemistry reveals that the normal value of salivary glucose in a healthy nondiabetic individual is <2 mg/dl.[11]
In the present study, statistically significant correlation was found between salivary glucose level (SGL) and BGL in patients with diabetes and controls as well. Significantly higher mean SGL was found in group with diabetes compared to healthy nondiabetic group. For Group A Controlled Diabetic group, the mean FSG was 4.86 ± 1.37 mg/dl, and the mean FBG was 121.53 ± 34.24 mg/dl. Pearson's correlation test showed significant correlation at 0.01 level.
Few studies that are documented had the values in accordance to our study. The study by Abikshyeet et al. revealed the mean FSG as 4.22 ± 3.59 mg/dl for diabetic group.[12] Soares et al. obtained mean of FSG of diabetic group as 5.91 ± 2.19 mg/dl.[13] In the study by Panchbhai et al. in 2010, the mean FSG was 7.64 ± 6.44 mg/dl.[14] Panchbhai again did a study in 2012 and found FBG as 6.83 mmol/l.[10]
Many studies are acknowledged where the values of SGL of controlled diabetics did not match the values of our study. Rosamund Harrison and William H. Bowen conducted a study and recorded the SGL as 11.0 ± 2 μg/ml for good controlled DM.[15] As for the study by López et al. the values recorded for diabetic group was 1.48 ± 2.15 mg/dl.[16] The study done by Kumar et al. had 7.4–17.8 mg/dl as SGL in controlled diabetic group.[17] Studies conducted by Mussavira et al. had 3.41 mg/dl as mean FSG in controlled diabetic group.[18] Ravindran et al. did a study and observed mean of FSG as 6.567 ± 3.04 mg/dl for the diabetic group.[19]
In our study, controlled diabetics (Group A) mean PPSG was 4.26 ± 2.22 mg/dl. The mean of PPBG was 185.85 ± 17.15 mg/dl. Pearson's correlation test revealed nonsignificant correlation (P > 0.05). A study conducted previously by Panchbhai in 2012 and PPBG for controlled diabetics was recorded as 9.07 mmol/l, and PPSG for the same group was 0.42 mmol/l, which was not in accordance to our values.[10] Our study for Group A revealed the mean RSG level was 3.59 ± 1.66 mg/dl and mean RBG level was 157.18 ± 18.14 mg/dl. Pearson's correlation test revealed nonsignificant correlation. (P > 0.05) values obtained by Balan et al. had RBG 120-200 mg/dl, and RSG was 4.95 ± 2.479 mg/dl, which was similar to our value.[20] The study by Shahbaz et al. revealed mean RSG for controlled diabetics as 7.4–17.8 mg/dl which did not match our values of the present study.[17]
In our study for Group B that is uncontrolled diabetic group, the mean of FSG Level was 11.33 ± 2.75 mg/dl. The mean of FBG level was 283.23 ± 68.87. Pearson's correlation test showed significant correlation at the 0.01 level.
Few studies had values in accordance to our study. The study by Hegde et al. revealed mean SGL as 10.46 ± 6.50 mg/dl for diabetic group.[21] Panchbhai et al. obtained mean of FSG of uncontrolled diabetic group as 8.09 ± 6.45 mg/dl.[14] In the study by Agrawal et al., the mean FBG of the patients in diabetic group was 171.31 ± 54.23 mg/dl, and the mean FSG of the patients in diabetic group was 10.93 ± 1.93 mg/dl.[8] Mirzaii-Dizgah et al. found FBG as 134–336 mg/dl and FSG as 9–15 mg/dl for diabetic group.[22] FSG was 10.4–15.5 mg/dl in the study by Kumar et al.[17] Satish et al. found FSG for diabetic group as 12.11 ± 6.38 mg/dl.[23]
In our study for Group B, the mean PPSG level was 7.57 ± 2.55 mg/dl. The mean of PPBG was 365.60 ± 65.12 mg/dl. Pearson's correlation test revealed significant correlation at 0.01 level.
Postprandial values of study by Panchbhai et al. did not match our values.[10] Our present study revealed the mean RSG level was 6.9 ± 3.00 mg/dl RBG level was 342.40 ± 72.57 mg/dl. Pearson's correlation test revealed significant correlation at 0.01 level. The study performed by Balan et al. had RBG <200 mg/dl and RSG was 13.35 ± 6.61 mg/dl which was similar to our value.[20]
In our study for Group C healthy nondiabetic group, the mean of FSG Level was 0.78 ± 0.09 mg/dl, and the mean of FBG level was 78.39 ± 9.25. Pearson's correlation test showed significant correlation at 0.01 level.
Few studies that are documented had the values in accordance to our study. Harrison and Bowen did a study and recorded the SGL as 5.0 ± 1.0 μg/ml for healthy subjects.[15] López et al. conducted a study and revealed 0.75 ± 1.57 mg/dl as SGL for nondiabetics.[16] The study by Abikshyeet et al. revealed mean FSG as 1.23 ± 0.52 mg/dl and mean FBG as 86.82 ± 9.46 mg/dl for nondiabetic group.[12] Shahbaz et al. obtained mean of FSG of the healthy group as 0.813 ± 0.077 mg/dl, and mean FBG as 82.96 ± 6.92 mg/dl for the same group.[24] Vagish Kumar revealed mean FSG for healthy individuals as 0.64 ± 1.23 mg/dl and mean FBG as 115.78 ± 21.04 mg/dl.[25]
Many studies have been conducted, and their values of SGL for healthy group did not match the values of our study. The study done by Hegde et al. the values recorded for healthy group was 7.41 ± 3.44 mg/dl.[21] The study done by Panchbhai et al. had 1.89 ± 1.44 mg/dl as SGL in nondiabetic group.[14] The studies conducted by Agrawal et al. had 6.08 ± 1.16 mg/dl as mean FSG and FBG as 92.11 ± 9.39 mg/dl in nondiabetic group.[8] Pratibha et al. in their study got 4.33 ± 0.29 mg/dl as mean FSG in nondiabetics.[26] Mirzaii-Dizgah et al. revealed mean FBG as 74–118 mg/dl and mean FSG as 0–7 mg/dl.[22] Satish et al. in their study obtained mean FSG as 4.32 ± 0.62 mg/dl and mean FBG as 90.5 ± 11.19 mg/dl.[23] Gupta et al. concluded the mean FSG for healthy individuals as 6.58 mg/dl.[27] In a study done by Mussavira et al., the healthy group had mean FSG as 2.07 mg/dl.[17] Ravindran et al. did a study and observed mean of FSG as 1.867 ± 0.9732 mg/dl for the nondiabetic group.[19]
In our study, for Group C, mean PPSG level was 1.40 ± 20.83 mg/dl. The mean of PPBG was 124.48 ± 18.86 mg/dl. Pearson's correlation test revealed nonsignificant correlation (P > 0.05).
Our study in relation to Group C revealed the mean RSG level was 1.16 ± 0.70 mg/dl and mean RBG level was 112.28 ± 13.41 mg/dl. Pearson's correlation test revealed nonsignificant correlation (P > 0.05.) The study performed by Balan et al. had RBG <120 mg/dl and RSG was 1.18 ± 0.675 mg/dl for healthy group which was similar to our value.[20] The study by Shahbaz et al. revealed mean RSG for healthy individuals as 2.2–6.8 mg/dl which did not match our values of the present study.[17]
The regression coefficient presents the amount of increase or decrease in the serum glucose for a unit change in the salivary glucose. This means from a known value of SGL; we can calculate BGL using the regression equation.
FBG = 68.650 + 28.050 FSG [Graph 1]
PPBG = 106.086 + 27.037 PPSG [Graph 2]
RBG = 95.607 + 27.710 RSG [Graph 3].
Graph 1.
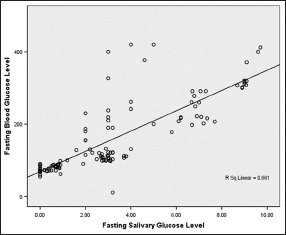
Correlation between fasting salivary and blood glucose level
Graph 2.
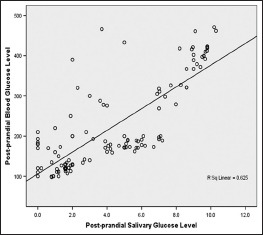
Correlation between postprandial salivary and blood glucose level
Graph 3.
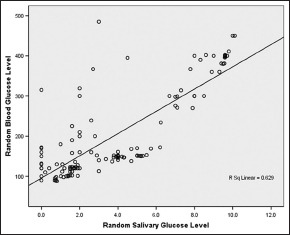
Correlation between random salivary and blood glucose level
Regression coefficient was formulated by few studies. The study conducted by Abikshyeet et al.[12] revealed the regression equation as serum glucose = 99.664 + 13.027 salivary glucose.
Shahbaz et al.[24] obtained the regression equation as serum glucose = 94.56 salivary glucose + 13.37.
Both the abovementioned equations were derived from the overall data of SGL and BGL; their values were in accordance to the equation obtained for random SGL and BGL of our study.
Numerous researchers have worked in the field of salivary diagnostics for DM. The present study is unique because the salivary as well as blood samples were obtained from the same patient and were subjected for estimation of fasting, postprandial and random glucose levels. This study also involved the derivation of the equation of regression coefficient for the prediction of BGL from SGL for all three parameters that is for random, postprandial and fasting glucose levels.
CONCLUSION
This study reveals that salivary glucose is increased in diabetics. Significant correlation was found between FSG level and FBG level of controlled diabetes, uncontrolled diabetes and healthy individuals. This means that saliva can be used as adjuvant diagnostic tool to blood in early diagnosis for DM. Saliva also finds great advantage over blood in case of children, elderly, critically ill and debilitated patients.
However, further studies need to be undertaken involving larger sample size, using different methods of saliva and blood collection, by taking glycosylated hemoglobin to estimate BGLs. The patients who are on medications show alteration in salivary secretion and its flow, and these criteria must be taken into consideration. The standardized procedure of salivary glucose estimation for DM may herald a new era in noninvasive method of diagnosis.
Declaration of patient consent
The authors certify that they have obtained all appropriate patient consent forms. In the form, the patients have given his consent for his images and other clinical information to be reported in the journal. The patients understand that name and initials will not be published and due efforts will be made to conceal identity, but anonymity cannot be guaranteed.
Financial support and sponsorship
Nil.
Conflicts of interest
There are no conflicts of interest.
REFERENCES
- 1.Olokoba AB, Obateru OA, Olokoba LB. Type 2 diabetes mellitus: A review of current trends. Oman Med J. 2012;27:269–73. doi: 10.5001/omj.2012.68. [DOI] [PMC free article] [PubMed] [Google Scholar]
- 2.Piero M. Diabetes mellitus – A devastating metabolic disorder. Asian J Biomed Pharm Sci. 2015;4:1–7. [Google Scholar]
- 3.Singh S. The genetics of type 2 diabetes mellitus: A review. J Sci Res. 2011;55:35–48. [Google Scholar]
- 4.International Diabetes Federation. 2015. [Last accessed on 2015 Sep 14]. Available from: http://www.idf.org .
- 5.Patel P, Macerollo A. Diabetes mellitus: Diagnosis and screening. Am Fam Physician. 2010;81:863–70. [PubMed] [Google Scholar]
- 6.Nagalaxmi V, Priyanka V. Can saliva be a marker for predicting type 1 diabetes mellitus.-A pilot study? J Indian Acad Oral Med Radiol. 2011;23:579–82. [Google Scholar]
- 7.Streckfus CF, Bigler LR. Saliva as a diagnostic fluid. Oral Dis. 2002;8:69–76. doi: 10.1034/j.1601-0825.2002.1o834.x. [DOI] [PubMed] [Google Scholar]
- 8.Agrawal RP, Sharma N, Rathore MS, Gupta VB, Jain S, Agarwal V, et al. Noninvasive Method for Glucose Level Estimation by Saliva. J Diabetes Metab. 2013;4:266. [Google Scholar]
- 9.Elkafri IH, Mashlah A, Shaqifa A. Relationship between blood glucose levels and salivary pH and buffering capacity in type II diabetes patients. East Mediterr Health J. 2014;20:139–45. [PubMed] [Google Scholar]
- 10.Panchbhai AS. Correlation of salivary glucose level with blood glucose level in diabetes mellitus. J Oral Maxillofac Res. 2012;3:e3. doi: 10.5037/jomr.2012.3303. [DOI] [PMC free article] [PubMed] [Google Scholar]
- 11.Carda C, Mosquera-Lloreda N, Salom L, Gomez de Ferraris ME, Peydró A. Structural and functional salivary disorders in type 2 diabetic patients. Med Oral Patol Oral Cir Bucal. 2006;11:E309–14. [PubMed] [Google Scholar]
- 12.Abikshyeet P, Ramesh V, Oza N. Glucose estimation in the salivary secretion of diabetes mellitus patients. Diabetes Metab Syndr Obes. 2012;5:149–54. doi: 10.2147/DMSO.S32112. [DOI] [PMC free article] [PubMed] [Google Scholar]
- 13.Soares MS, Batista-Filho MM, Pimentel MJ, Passos IA, Chimenos-Küstner E. Determination of salivary glucose in healthy adults. Med Oral Patol Oral Cir Bucal. 2009;14:e510–3. doi: 10.4317/medoral.14.e510. [DOI] [PubMed] [Google Scholar]
- 14.Panchbhai AS, Degwekar SS, Bhowte RR. Estimation of salivary glucose, salivary amylase, salivary total protein and salivary flow rate in diabetics in India. J Oral Sci. 2010;52:359–68. doi: 10.2334/josnusd.52.359. [DOI] [PubMed] [Google Scholar]
- 15.Harrison R, Bowen WH. Flow rate and organic constituents of whole saliva in insulin-dependent diabetic children and adolescents. Pediatr Dent. 1987;9:287–91. [PubMed] [Google Scholar]
- 16.López ME, Colloca ME, Páez RG, Schallmach JN, Koss MA, Chervonagura A, et al. Salivary characteristics of diabetic children. Braz Dent J. 2003;14:26–31. doi: 10.1590/s0103-64402003000100005. [DOI] [PubMed] [Google Scholar]
- 17.Kumar S, Padmashree S, Jayalekshmi R. Correlation of salivary glucose, blood glucose and oral candidal carriage in the saliva of type 2 diabetics: A case-control study. Contemp Clin Dent. 2014;5:312–7. doi: 10.4103/0976-237X.137925. [DOI] [PMC free article] [PubMed] [Google Scholar]
- 18.Mussavira S, Dharmalingam M, Omana Sukumaran B. Salivary glucose and antioxidant defense markers in type II diabetes mellitus. Turk J Med Sci. 2015;45:141–7. doi: 10.3906/sag-1306-116. [DOI] [PubMed] [Google Scholar]
- 19.Ravindran R, Gopinathan DM, Sukumaran S. Estimation of salivary glucose and glycogen content in exfoliated buccal mucosal cells of patients with type II diabetes mellitus. J Clin Diagn Res. 2015;9:ZC89–93. doi: 10.7860/JCDR/2015/11633.5971. [DOI] [PMC free article] [PubMed] [Google Scholar]
- 20.Balan P, Babu SG, Sucheta KN, Shetty SR, Rangare AL, Castelino RL, et al. Can saliva offer an advantage in monitoring of diabetes mellitus? - A case control study. J Clin Exp Dent. 2014;6:e335–8. doi: 10.4317/jced.51386. [DOI] [PMC free article] [PubMed] [Google Scholar]
- 21.Hegde A, Shenoy R, D’Mello P, Smitha A, Tintu A, Manjrekar P. Alternative markers of glycemic status in diabetes mellitus. Biomed Res. 2010;21:252–6. [Google Scholar]
- 22.Mirzaii-Dizgah I, Mirzaii-Dizgah M. Stimulated saliva glucose as a diagnostic specimen for detection of diabetes mellitus. J Arch Mil Med. 2013;1:24–7. [Google Scholar]
- 23.Satish BN, Srikala P, Maharudrappa B, Awanti SM, Kumar P, Hugar D, et al. Saliva: A tool in assessing glucose levels in diabetes mellitus. J Int Oral Health. 2014;6:114–7. [PMC free article] [PubMed] [Google Scholar]
- 24.Shahbaz S, Katti G, Ghali SR, Katti C, Diwakar DD, Guduba V, et al. Salivary alterations in type 1 diabetes mellitus patients: Salivary glucose could be noninvasive tool for monitoring diabetes mellitus. Indian J Dent Res. 2014;25:420–4. doi: 10.4103/0970-9290.142512. [DOI] [PubMed] [Google Scholar]
- 25.Vagish Kumar LS. Salivary glucose levels and its correlation with serum glucose and glycemic status in diabetic patients. Cukurova Med J. 2014;39:7–18. [Google Scholar]
- 26.K M P, Johnson P, Ganesh M, Subhashini AS. Evaluation of salivary profile among adult type 2 diabetes mellitus patients in South India. J Clin Diagn Res. 2013;7:1592–5. doi: 10.7860/JCDR/2013/5749.3232. [DOI] [PMC free article] [PubMed] [Google Scholar]
- 27.Gupta A, Singh SK, Padmavathi BN, Rajan SY, Mamatha GP, Kumar S, et al. Evaluation of correlation of blood glucose and salivary glucose level in known diabetic patients. J Clin Diagn Res. 2015;9:ZC106–9. doi: 10.7860/JCDR/2015/12398.5994. [DOI] [PMC free article] [PubMed] [Google Scholar]