

Abstract
Chromosomes of eukaryotes adopt highly dynamic and complex hierarchical structures in the nucleus. The three-dimensional (3D) organization of chromosomes profoundly affects DNA replication, transcription and the repair of DNA damage. Thus, a thorough understanding of nuclear architecture is fundamental to the study of nuclear processes in eukaryotic cells. Recent years have seen rapid proliferation of technologies to investigate genome organization and function. Here, we review experimental and computational methodologies for 3D genome analysis, with special focus on recent advances in high-throughput chromatin conformation capture (3C) techniques and data analysis.
Recent studies have revealed the existence of millions of potential cis-regulatory elements in the human genome, with a great number of them residing in intergenic regions and away from their target gene promoters1,2. The distal elements, which largely consist of enhancers, influence the transcription of target genes through looping of chromatin fibres3–11 during animal development12–16. Evidence of chromatin looping has been detected for many enhancers17–21. However, the mechanisms by which chromatin interactions are formed and maintained during development remain to be elucidated.
The chromosome conformation capture (3C) method and its studying chromatin interactions in eukaryotic cells22–27 (TABLE 1). These techniques have uncovered general features of genome organization, which include the existence of hierarchical chromatin structures, such as compartments22, topologically associating domains (TADs)6,10, sub-TADs11, insulated domains17 and chromatin loops27.However, different C-technologies and analysis strategies have produced variable data on chromatin domains and DNA loops; for example, 100-fold differences have been seen in the total number of statistically significant chromatin interactions between studies19,27; and different studies have used similarly sounding terminologies to describe different structural features (such as ‘loops’ versus ‘significant interactions’ and ‘contact domains’ versus ‘topological domains’), thus clouding our understanding of chromosome topology in cells19,27. It is unclear whether the differences in numbers of chromatin domains and loops identified in different studies are due to experimental protocols or data analysis algorithms.
Table 1.
A tabulation of known chromosome conformation capture technologies
| Assay abbreviation | Full assay name | Refs | Related protocols or guidelines |
|---|---|---|---|
| 1 versus 1* | |||
| 3C | Chromosome conformation capture | 43 | 97–100 |
| 1 versus Many/All* | |||
| Multiplexed 3C-seq | Multiplexed chromosome conformation capture sequencing | 101 | 102 |
| Open-ended 3C | Open-ended chromosome conformation capture | 103 | – |
| 3C-DSL | Chromosome conformation capture combined with DNA selection and ligation | 104 | – |
| 4C | Circular chromosome conformation capture | 45 | 105 |
| 4C | Chromosome conformation capture-on-chip | 51 | – |
| 4C-seq | Chromosome conformation capture-on-chip combined with high-throughput sequencing | 106 | 46,72, 107,108 |
| TLA | Targeted locus amplification | 30 | – |
| e4C | Enhanced chromosome conformation capture-on-chip | 109 | 110 |
| ACT | Associated chromosome trap | 111 | 112 |
| Many versus Many* | |||
| 5C | Chromosome conformation capture carbon copy | 52 | 113–116 |
| ChIA–PET | Chromatin interaction analysis paired-end tag sequencing | 23 | – |
| Many versus All* | |||
| Capture-3C | Chromosome conformation capture coupled with oligonucleotide capture technology | 25 | – |
| Capture-HiC | Hi-C coupled with oligonucleotide capture technology | 58 | – |
| All versus All* | |||
| GCC | Genome conformation capture | – | 117 |
| Hi-C | Genome-wide chromosome conformation capture | 22 | 69,70,118 |
| ELP | Genome-wide chromosome conformation capture with enrichment of ligation products | 119 | – |
| TCC | Tethered conformation capture | 24 | – |
| Single-cell Hi-C | Single-cell genome-wide chromosome conformation capture | 38 | 96 |
| In situ Hi-C | Genome-wide chromosome conformation capture with in situ ligation | 27 | – |
| DNase Hi-C | Genome-wide chromosome conformation capture with DNase I digestion | 49 | – |
| Micro-C | Genome-wide chromosome conformation capture with micrococcal nuclease digestion | 50 | – |
‘1’, ‘Many’ and ‘All’ indicate how many loci are interrogated in a given experiment. For example, ‘1 versus All’ indicates that the experiment probes the interaction profile between 1 locus and all other potential loci in the genome. ‘All versus All’ means that one can detect the interaction profiles of all loci, genome-wide, and their interactions with all other genomic loci.
In this Review, we discuss recent experimental and computational advances in C-technologies. We briefly catalogue all C-technologies, and place special emphasis on a few key areas of recent technological advancements regarding methods for chromatin fragmentation, approaches for proximity ligation and the use of a target-enrichment step before performing ultra-high-throughput sequencing. We also thoroughly explore the recent computational advancements that have been developed to analyse data sets produced by C-technologies (termed C-data). We detail the approaches for interrogating various C-data sets, placing special emphasis on methodologies to account for experimental biases, assessment of the resolution of a data set, extraction of global chromosome organization features and identification of chromatin interactions. We also propose key factors for consideration when selecting the appropriate computational methods to analyse C-data. Owing to space limitations, this Review does not cover alternative applications of C-data, such as haplotype phasing28–30, genome assembly31–33, metagenomic applications34–36 and three-dimensional (3D) chromosome modelling22,24,37,38. Readers can find excellent reviews on these topics elsewhere5,39–42. We conclude by providing perspective on the challenges that remain ahead.
C-technologies: advances and adaptations
3C was invented as a general method to study chromosome organization in eukaryotic cells43. It combines protein crosslinking and proximity ligation of DNA to detect long-range chromatin interactions between pairs of genomic loci. Briefly, nuclei are isolated following treatment of cells with formaldehyde, which crosslinks the chromatin proteins to their associated DNA to fix the chromatin structure. The crosslinked DNA is then digested using restriction enzymes and the ends of the digested DNA fragments are re-ligated in diluted conditions that strongly favour ligation of the juxtaposed DNA fragments. The frequency of ligation between two genomic loci is then assessed using PCR or direct DNA sequencing. Although proximity ligation had earlier been used to detect DNA loops between the rat prolactin promoter and a distal enhancer in uncrosslinked cells44, the inclusion of formaldehyde crosslinking in 3C enhanced the efficiency and robustness of proximity ligation reactions43, thereby enabling broad adoption of the 3C technique for high-throughput analyses of chromosome architecture.
Over the years, many additional modifications have been introduced to 3C techniques that further enhanced the scale, resolution and efficiency of chromosome conformation analyses. First, with the rapid advances in DNA sequence analysis technologies, 3C quickly developed into genome-scale methods with the adoption of microarray technology and eventually ultrahigh-throughput DNA sequencing as a way to measure the frequency of proximity ligation products (TABLE 1). As only a fraction of DNA fragments generated by the C-technologies are legitimate ligation products between distinct genomic loci, it is necessary both to enrich for ligation junctions and to reduce or eliminate unligated DNA fragments. To achieve this, biotin-labelling with biotin-conjugated nucleotides has been used to fill-in the 5ʹ overhangs left by restriction digestion before proximity ligation. Following proximity ligation, the ligation products are biotin-labelled at the ligation junctions22,23. Biotinylated nucleotides at the ends of unligated DNA molecules are conventionally removed by a dedicated T4 DNA polymerase reaction22 or during the end-repair step of the library preparation procedure27. Biotinylated ligation junctions are eventually isolated by affinity purification and subject to ultra-high-throughput DNA sequencing, generating genome-wide chromatin contact maps that reflect chromosome organization in a cell population. The first rendition of this procedure, known as Hi-C, has now been widely used22.
To increase the resolution of chromosome conformation analyses, modifications have also been made to the restriction digestion step (FIG. 1a). At the very core of C-technologies is the need to first fragment the chromatin of crosslinked nuclei to generate DNA ends capable of re-ligating to other spatially proximal fragmented ends43. Until recently, restriction digestion has been generally carried out using ‘6-cutters’ — type II restriction enzymes that recognize a six-base-pair sequence motif. The finest resolution possible using 6-cutter fragmentation would in theory be the size of the restriction fragment generated (termed fragment-level resolution). The closest to achieving this was a recent high-resolution analysis of human fetal lung fibroblast, which achieved nearly fragment-level resolution, requiring over 3.4-billion valid chromatin contacts (over 5.6-billion raw read-pairs)19. Although 4-cutters potentiate higher-resolution analyses of genome conformation by means of producing smaller restriction-fragment sizes, the total number of restriction fragments genome-wide is ~16-fold higher and the total number of possible pairwise contacts is 256-fold higher. Accordingly, 4-cutter fragmentation was initially applied in targeted chromatin conformation analysis using 4C (circular chromosome conformation capture; also known as chromosome conformation capture-on-chip) technology, as 4C interrogates the chromatin looping landscape of only a single restriction fragment with the rest of the genome, rather than all possible pairwise contacts genome-wide45,46. Genome-wide analyses with 4-cutter fragmentation were performed in flies47, in part owing to their relatively small genome size compared to mouse or human, which significantly reduces the total number of possible pairwise contacts. To date, the finest resolution analysis of mammalian genomes has been carried out using a 4-cutter27. In this study, 4.9 billion valid chromatin contacts were required to obtain 1 kb-resolution Hi-C maps in a single cell type (‘1 kb resolution’ is explained further below). Other methods have now been used for chromatin fragmentation, each offering a unique set of advantages and disadvantages. DNase I has recently been shown to fragment chromatin of crosslinked nuclei for Hi-C applications48,49 (FIG. 1a). Similarly, micrococcal nuclease (MNase) has been used to fragment chromatin before proximity ligation in yeast nuclei, helping to achieve nucleosome-level resolution of chromatin organization50. In addition, mechanical shearing was used to fragment chromatin in a 4C protocol variant and was suggested to be sufficient to fragment chromatin for Hi-C49, although to our knowledge no Hi-C data from mechanical shearing have yet been published.
Figure 1. Experimental modifications to genome-wide chromosome conformation capture (3C)-based technologies (C-technologies).
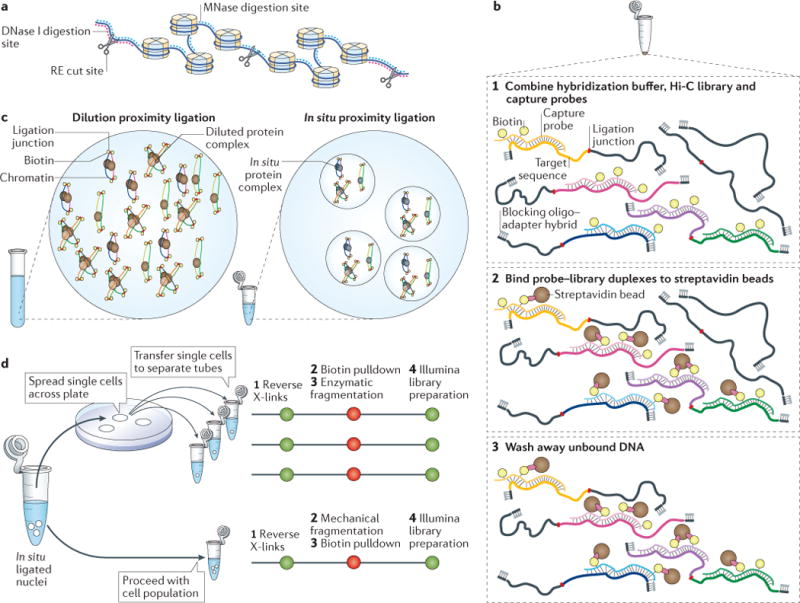
a| Chromatin fragmentation can be achieved using type II restriction enzymes (REs), which cut at enzyme-specific recognition motifs22,47, endonucleases such as DNase I, which fragments DNA at sites of open chromatin48,49, and micrococcal nuclease (MNase), which fragments chromatin in histone linker sequences50. b | Hi-C includes the sequencing of all biotin-labelled ligation products, which are enriched by biotin-affinity purification and subsequent library preparation22,69,70. In Capture-HiC, sequences of interest can be enriched from a Hi-C DNA library to obtain highly multiplexed, targeted interaction profiles29,53–60. This involves the hybridization of biotinylated capture-probes to DNA sequences of interest (step 1), the immobilization of this library of probe–target sequence duplexes on streptavidin beads (step 2) and the washing away of unbound DNA, leaving only the captured probe–library duplexes (step 3). c | Proximity ligation in Hi-C sample preparation was originally done after nuclei were lysed and chromatin complexes were diluted, to favour intramolecular ligation events22,69,70 (left). An alternative strategy is to carry out the proximity ligation step within intact nuclei27,38 before nuclear lysis and DNA–protein crosslink reversal (right). d | Single-cell Hi-C38,96 (top) differs from cell-population Hi-C22,69,70 (bottom) by the plating of nuclei, the sorting of them individually into tubes and the processing of them using a modified library preparation protocol. X-links, crosslinks.
Conventional Hi-C requires billions of DNA sequencing reads to achieve truly genome-scale coverage at kilobase-pair resolution19,27. By contrast, the first targeted approaches, such as 4C and chromosome conformation capture carbon copy (5C), are PCR-based C-technologies, using PCR enrichment to analyse chromatin contact profiles of a single locus45,51 or across a continuous locus, respectively52. Although these methods are less expensive than Hi-C and are based on relatively straight-forward protocols, they suffer from low throughput (4C) or complex primer design (5C) and, importantly, do not include the key advantage of Hi-C, which is the enrichment of valid ligation products using biotin-labelling of ligation junctions and affinity purification. To gain cost-effectiveness while preserving the efficiency afforded by genome-wide C-techniques, two strategies have been developed that also generate targeted 3C data. First, chromatin immunoprecipitation (ChIP) was introduced before the proximity ligation step to enrich for DNA associated with specific DNA-binding proteins, chromatin modifiers or histone modifications23. This method, termed chromatin interaction analysis by paired-end tag sequencing (ChIA-PET), allows for targeted analysis of chromatin conformation at binding sites of transcription factors or at transcriptionally active chromatin domains. It also has the benefit of achieving a higher resolution compared to Hi-C, as only ligation products involving the immunoprecipitated molecule are sequenced.
Second, Hi-C has recently been combined with target enrichment and sequencing (Capture-HiC) to reveal chromatin contacts of mammalian gene promoters49,53–57 and other specific genomic loci29,53,58–60. Unlike 4C and 5C, Capture-HiC involves first generating a library of proximity-ligated DNA fragments using one of several published Hi-C methods. Next, biotinylated RNA or DNA oligonucleotide probes are hybridized to specific sequences of interest (for example, gene promoters) within the Hi-C library, followed by affinity purification of the biotinylated probe–library duplexes, stringent washing of bound DNA and finally ultra-high-throughput DNA sequencing (FIG. 1b). Control over which genomic loci are interrogated in a Capture-HiC experiment is determined by the user when designing the capture probes. Importantly, ligation frequencies of probed regions detected from Capture-HiC experiments are highly similar to ligation frequencies measured by high-resolution, whole-genome Hi-C data29, yet Capture-HiC data sets are obtained at a small fraction of the cost because only the probed regions are analysed, underscoring both the quality and efficiency of this method. Current Capture-HiC approaches have varied substantially with respect to template Hi-C library preparation procedure, target selection, capture probe design and target enrichment protocol (TABLE 2). Thus, data generated from such experiments vary widely with respect to the quality of target enrichment; for example, the on-target rate differs between studies. One consistent tendency is that Capture-HiC data from studies with larger target size have substantially higher on-target rates than data from studies with smaller captured regions, ranging from ~65% on target in select promoter Capture-HiC studies54,56,57 to 5–15% when capturing small continuous regions or interspersed loci29,58,59. Interestingly, no reports to our knowledge have implemented the ‘double-capture’ strategy for small target sizes, which uses two consecutive captures to increase the on-target rates for difficult-to-capture templates61. Additionally, promoter Capture-HiC data generated using either RNA or DNA probes have reported differing on-target rates, with RNA probes currently outperforming DNA probes54–57. However, the first and only report of genome-wide promoter Capture-HiC using DNA probes also used 4-cutter library preparation, rather than 6-cutter, making it challenging to interpret which design approach is superior. Overall, variations in Hi-C library preparation, probe design, target size, number of probes allocated to each target locus and user expertise contribute to the variable quality and depth of coverage across loci in each study, making concrete experimental recommendations premature and creating challenges for downstream data analyses, as discussed in the next section.
Table 2.
Design and implementation of Capture-HiC experiments
| Oligo array vendor | Probe | Organism | Target (or targets) | Control (or controls) | Hi-C library protocol | Refs |
|---|---|---|---|---|---|---|
| Agilent SureSelect | RNA | Human | Breast cancer risk loci | Size-matched gene dessert regions | Hind III dilution Hi-C | 58 |
| Agilent SureSelect | RNA | Human | Colon cancer risk loci | N/A | Hind III dilution Hi-C | 59 |
| In-house* | RNA | Human | MHC and KIR loci | N/A | Hind III dilution Hi-C | 29 |
| In-house* | RNA | Human | Three ~2-Mb loci | N/A | Mbo I in situ Hi-C | 60 |
| Roche Nimblegen SeqCap | DNA | Human | LncRNA promoters | β-Globin LCR, NANOG, and SOX2 loci | DNase I dilution Hi-C | 49 |
| Agilent SureSelect | RNA | Mouse | Promoters | Random ligation library‡ | Hind III dilution Hi-C | 56 |
| Agilent SureSelect | RNA | Mouse | Promoters | Random ligation library‡ | Hind III Dilution Hi-C | 57 |
| Agilent SureSelect | RNA | Human | Promoters | Random ligation library‡ | Hind III Dilution Hi-C | 54 |
| Agilent SureSelect | RNA | Human | Promoters and autoimmune disease risk loci | HBA locus | Hind III dilution Hi-C | 53 |
| Roche Nimblegen SeqCap | DNA | Mouse | Promoters | Intergenic and exonic regions | Mbo I dilution Hi-C | 55 |
HBA, haemoglobin subunit alpha; LCR, locus control region; LncRNA, long non-coding RNA; N/A, not applicable.
Single-strand DNA oligonucleotides are obtained from CustomArray and synthesized into RNA probes in-house.
In the random ligation library, crosslinks are reversed before the proximity ligation reaction.
A substantial, although variable (~7–50%), proportion of Hi-C contacts detected in mammals using the original Hi-C protocol originate from inter-chromosomal (‘trans’) ligation events6,19,22,28,62–68. The reported frequency of trans contacts varies tremendously across cell types and even biological replicates, and they are much less reproducible than the intra-chromosomal (‘cis’) contacts. This raises the possibility that many of these ligation products result from random inter-molecular ligations occurring during sample preparation in diluted conditions. In the original Hi-C protocol, following restriction digestion and biotin-labelling, nuclei are lysed using sodium dodecyl sulphate (SDS) and crosslinked chromatin complexes are diluted before proximity ligation22,69,70 (FIG. 1c). Since the inception of Hi-C, 4C protocols have forgone the nuclear lysis step by way of omitting SDS treatment; conducting proximity ligation without intentional lysis of dilution, resulting in fewer observed trans contacts71,72. A recent study also indicated that in Hi-C, nuclear lysis and dilution of chromatin complexes before proximity ligation can be omitted, corroborating the observation that proximity ligation can occur within intact nuclei38 (FIG. 1c). By adapting Hi-C with this modified ligation procedure (a process from here termed in situ Hi-C), a substantial improvement in the fraction of legitimate, informative ligation products is achieved without affecting the accuracy of conformation capture27,38,65, with fewer random trans contacts, higher reproducibility of contacts across a range of distances and even reduction of previously described experimental bias65. Thus, in situ Hi-C seems to be the preferred protocol moving forward. However, as Hi-C data can be used only to infer genome organization based on observed contact frequencies, true evaluation of the superior protocol requires comparison to a set of known true interaction frequencies, which does not exist in a comprehensive fashion. Moreover, evaluating data quality based solely on the fraction of observed trans or long-range cis contacts is not entirely appropriate, as cells may indeed have highly intermingled chromosomes, depending perhaps on cell cycle stage. Instead, additional metrics should be used for assessing data quality, such as estimating random collision frequency6 and analysis of read orientation as a function of linear genomic distance19,27.
The improved efficiency of in situ proximity ligation and Hi-C facilitated the examination of chromatin organization in single mammalian cells using single-cell Hi-C, which provided a deeper understanding of cell-to-cell variability in chromosome architecture38 (FIG. 1d). In single-cell Hi-C, cell populations are subjected to the initial steps of in situ Hi-C but, before crosslink reversal, the intact nuclei are sorted into individual tubes and subjected to a modified Hi-C-library preparation procedure and multiplexed PCR amplification. This strategy was applied in mouse T helper cells and produced genome-wide contact maps for 74 individual cells, with 10 of these maps being of high enough quality for further analysis38. The resulting single-cell contact maps, despite being very sparse (at 1 Mb bin size), confirmed the existence of chromosome territories and TADs while highlighting the cell-to-cell variability of chromosome architecture. Merged single-cell maps are similar to Hi-C data generated from millions of cells, supporting the reliability of the single-cell data. A key limitation of the method is that only a small number of unique chromatin contacts, up to 30,000 in the published work38, were detected. This represents less than 2.5% of the total number of theoretical chromatin contacts in a mouse cell. The sparse data set probably results from inefficient steps in the existing protocol, such as enzymatic chromatin fragmentation, biotin-labelling, proximity ligation and conventional Illumina TruSeq library preparation. Removing the biotin-labelling step and performing sticky-end ligation, as in 3C, may potentiate the detection of more unique ligation junctions, as ligation junction detection will not depend on high efficiency of the enzymatic biotin-labelling reaction or the efficiency of blunt-end ligation. Additionally, more-efficient library preparation methods designed specifically to handle low inputs, such as tag-mentation73, may improve the yield and absolute number of detectable ligation junctions.
Computational analysis of C-data
The rapid development of C-technologies and fast accumulation of large amounts of data have posed great challenges for data analysis and interpretation, and necessitated the development of sophisticated computational tools that can accurately identify long-range chromatin interactions and reveal the general principles of chromatin motion and organization. It is important to note that, although the observed frequency of proximity-ligation products has been used to infer the 3D distances between a pair of DNA sequences, procedures including crosslinking, chromatin fragmentation, biotin-labelling and re-ligation can all introduce biases that complicate the interpretation of observed contact frequencies74–76. Additionally, the resolution of analysis in the available data sets remains to be rigorously defined. To overcome these challenges, statistically solid and computationally efficient bioinformatics pipelines are essential. Several computational algorithms and tools have been developed in recent years, specifically for analysing C-data. Below, we discuss several key issues that need to be considered.
Accounting for experimental bias
Similarly to analysis of data generated by ChIP followed by sequencing (ChIP-seq) and RNA sequencing (RNA-seq), analysis of C-data can be confounded by multiple layers of bias that originate from different steps of experimental procedures. Accounting for these biases (at times referred to as bias removal or normalization) is the first and arguably the most important step in C-data analysis. Efficient and effective removal of multiple systematic biases is critical for the success of any subsequent analysis of C-data as well as for the proper interpretation of results.
In general, there have been two types of approaches to account for biases in C-data. The first class of bias-removal approaches account for biases in an explicit fashion — by assuming that all sources of systematic biases are known based on biases determined empirically from the observed data (FIG. 2; TABLE 3). The second class of bias-removal approaches account for biases in an implicit way — by assuming no known source (or sources) of bias, and assuming that the cumulative effect of the bias is captured in the sequencing coverage of each locus (or ‘bin’). In other words, as Hi-C is a genome-wide assay, the implicit models assume that each locus should receive equal sequence coverage after biases are removed. These implicit models all rely on some implementation of matrix-balancing algorithms, and from here on they are referred to as the matrix-balancing methods (FIG. 2; TABLE 3). Therefore, selecting the appropriate bias-removal methodology depends on whether the sources of the biases in the data are assumed to be known or unknown. In a seminal study, restriction enzyme fragment lengths, GC content and sequence mappability were identified as three major sources of experimental biases in Hi-C data77. The key challenge is to estimate the combinatorial bias effect between two interacting loci. To address this challenge, the binary contact status between any two fragment-ends was modelled as the Bernoulli random variable. Next, to estimate the bias effects, the maximal likelihood approach was applied to the joint likelihood function, which is defined as the product of Bernoulli probability mass function for all possible fragment end pairs. In practice, to make such computation feasible, all interacting loci were first grouped into bins based on the percentiles of each bias factor. Next, an empirical distribution was used to estimate such combinational bias effects, leading to a statistically effective but computationally intensive bias-removal method77. Later on, HiCNorm, which is a generalized linear regression-based method, was developed to remove the above-mentioned three systematic biases in Hi-C data78 (FIG. 2b; TABLE 3). Differing from the first explicit model77, which used a Bernoulli distribution to model the binary contact status between any two fragment-ends, HiCNorm directly models the contact frequency between any two bins as a Poisson distribution or a negative binomial distribution78. Noticeably, analysing binned Hi-C data enables HiCNorm to adopt a simple parametric form for the combinatorial bias effect, resulting in much-improved computational efficiency.
Figure 2. Comparison of computational methods to account for bias in Hi-C data.
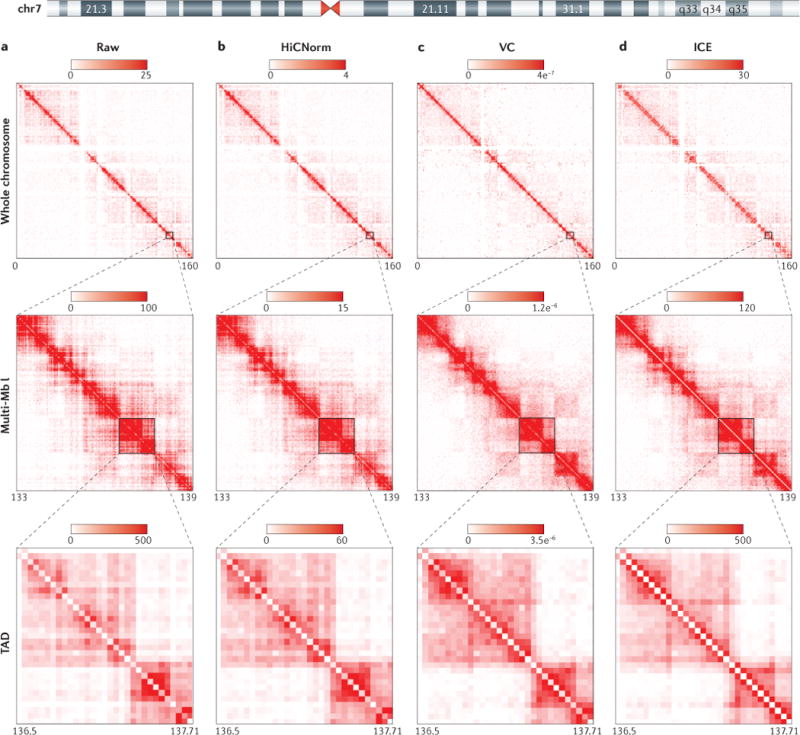
We reprocessed high-resolution Hi-C data from IMR90 cells19 uniformly until the bias-removal step, at which point either raw contact matrices were generated or normalization was conducted with one of three methods. Here, we illustrate a semi-quantitative comparison of human chromosome 7 (chr7) for 3 genomic resolutions (whole chromosome, a multi-megabase (multi-Mb) locus and a topologically associating domain (TAD)) at 40 kb bin size for a raw Hi-C contact matrix (part a), an explicit model of bias removal (HiCNorm) (part b), and two methods of matrix-balancing algorithms for bias removal, namely a fast, rough, single-iteration balancing method, vanilla coverage (VC) (part c) and iterative correction and eigenvector decomposition (ICE) (part d). It can be visually appreciated that the explicit or implicit assumptions made by each method to account for biases result in quantitative differences in the normalized interaction frequency between loci. The intensity gradient is a linear increase from zero to the maximum noted (units are observed read counts for the raw matrices, and normalized read counts for the normalized matrix columns). Depicted are a series of symmetrical Hi-C contact matrices at various genomic resolutions. The rows (i) and columns (j) of each matrix represent bins along a chromosome, in this case various regions of human chr7. Each matrix entry [i,j] represents the observed or normalized interaction frequency between a pair of genomic loci. Pairwise interactions observed at higher frequency are depicted as a darker red colour along the colour gradient, whereas light red coloration represents very few observed interactions in the Hi-C data. The gradient units for raw matrices (part a) are ‘observed interaction frequency’ and the units for HiCNorm, VC and ICE (parts b–d) are ‘normalized interaction frequency’, which become increasingly apparent when analysing more-local Hi-C contacts (closer to the diagonal). Matrix entries near the matrix diagonal represent pairwise interactions between loci that are proximal in linear genomic distance (i~j), whereas matrix entries far off the diagonal (i≫j) represent pairwise interactions between loci that are very distal in linear genomic distance. For whole-chromosome and TAD resolutions, the maximal signal intensity was set to the ninety-ninth percentile for the given matrix. For the multi-Mb resolution, the maximal intensity was set to the ninety-fifth percentile value of the given matrix. Each matrix is a symmetrical matrix, NxN, and the chromosome coordinate information is given below each matrix in megabases.
Table 3.
Approaches to account for systematic biases in Hi-C data
| Approach | Model assumption* | Implementation‡ | Computational speed | Refs |
|---|---|---|---|---|
| Yaffe and Tanay | Three systematic biases | Perl and R | Slow | 77 |
| HiCNorm | Three systematic biases | R | Fast | 78 |
| ICE | Equal visibility | Python | Fast | 79 |
| Knight and Ruiz | Equal visibility | JAVA | Fast | 27 |
| HiC-Pro | Equal visibility | Python and R | Very fast | 80 |
ICE, iterative correction and eigenvector decomposition.
Model assumption refers to the inherent assumptions in the computational model used to account for bias in Hi-C data. These approaches can be classified based on their model assumptions: they are either explicit, assuming that systematic biases are known (three systematic biases), or implicit, assuming systemic biases are unknown and all the bias is captured by the sequencing coverage of each bin (equal visibility).
Implementation refers to the programming language in which the normalization programme is written.
In addition to these two explicit approaches, implicit, matrix-balancing approaches have been widely used to account for biases in Hi-C data and rely on two different assumptions. First, the combinatorial-bias effect between two interacting loci can be simplified as the product of the two locus-specific bias effects. Second, if there is no bias effect (that is, when all bias has been accounted for), the total genome-wide contact summation for each locus will be a constant, implying that each locus has ‘equal visibility’ to the Hi-C assay. Based on these two assumptions, classic matrix-balancing algorithms have been used to account for systemic bias. For example, the first method that described balancing Hi-C contact matrices was termed vanilla coverage22 (FIG. 2c). To account for bias, the observed contact frequency between locus A and locus B is divided by the product of the total genome-wide contact frequency at locus A and the total genome-wide contact frequency at locus B, and the ratio is used as the normalized contact frequency (FIG. 2c). Later, iterative correction and eigenvector decomposition (ICE) was introduced (FIG. 2d; TABLE 3); this process iterates through the vanilla coverage procedure until there is convergence of the normalized contact frequency, thereby further reducing the coverage variability from locus to locus but greatly increasing the computational cost to achieve bias removal79. Since ICE was introduced, several efforts have been made to improve its computational efficiency80,81. Meanwhile, a fast version of the matrix-balancing Sinkhorn–Knopp algorithm82, originally described by Knight and Ruiz83, has been applied to account for biases in the finest resolution Hi-C data sets27 (TABLE 3). Matrix-balancing methods may also be preferred when analysing Hi-C data prepared with other chromatin-fragmentation approaches, such as DNase I or mechanical sharing49, as matrix-balancing methods assume that the source of bias is unknown, and the presence of empirically determined biases from these Hi-C data sets has not yet been thoroughly examined. In practice, both explicit and implicit approaches have been used to account for biases in Hi-C data; therefore, it would be helpful to conduct a comprehensive comparison between the two approaches. To date, only a partial comparison has been made, which highlighted the differences in reproducibility of cis and trans interaction frequencies at low resolution84. A novel computational framework that combines the strengths of the two approaches may enable more accurate bias removal and higher computational efficiency.
As discussed above, Capture-HiC technologies measure chromatin conformation at target loci at high resolution54–59. Thus, in addition to the systemic experimental biases already present in Hi-C data, Capture-HiC data contain additional biases, owing to uneven capture efficiency at targeted loci as well as to some capture bias generated when both interacting sequences are targeted by capture probes (compared to when just one end is being probed), which manifests as sequence coverage variability at each locus54,56,85. To specifically account for such coverage asymmetry in Capture-HiC data, the CHiCAGO (Capture-HiC analysis of genomic organization) algorithm was developed; this estimates the bait-specific bias and the other-end-specific bias separately85. Moreover, it estimates the bait-specific bias by grouping the probed loci with similar local interacting profiles, whereas the other-end-specific bias is estimated by grouping the non-probed loci with similar distal interacting profiles. More studies are needed to fully explore the combinatorial effect of the bait-specific bias and the other-end-specific bias in Capture-HiC data.
Although several methods to account for experimental bias are available (TABLE 3), they should be used with great caution. The validity of each approach depends heavily on its explicit or implicit model assumptions. The explicit approaches assume that the systematic biases are known and taken into account in the statistical model to account for inherent biases in the observed Hi-C contact matrix. These methods can be overly conservative and run the risk of missing additional sample-specific biases whereby the normalized Hi-C data may still be affected by unknown biases, namely biases not taken into account in the explicit model. For example, DNA-circularization bias86 is not accounted for in the current explicit approaches. By contrast, the matrix-balancing approaches rely on the equal visibility assumption: that each locus throughout the genome has equal likelihood of being engaged in a 3D contact captured by the Hi-C protocol. Therefore, matrix-balancing algorithms assume that, after removing all biases, the normalized Hi-C contact matrix should have constant row (and column) summation. If these row summations are scaled to one, then each matrix entry represents an approximate contact probability between two loci, whereas following bias removal from explicit models, the matrix entries represent normalized contact counts. The equal visibility assumption may seem intuitive, as Hi-C is indeed a genome-wide sequencing technique and approximately equal coverage across the genome may be expected. However, there are many biases that are known to affect read coverage in Hi-C data, such as the restriction cut site position and the mappability and GC content of sequences flanking the restriction enzyme cut sites77. Moreover, it has also been appreciated that the restriction enzyme used in library preparation is biased towards cutting at open chromatin regions49. These experimental biases, some of which are unique to Hi-C and do not exist for other whole-genome sequencing library preparation methods, will clearly bias the Hi-C sequencing coverage; therefore, matrix-balancing assumes that the cumulative effect of all bias factors is captured in the coverage of each locus. Coverage distribution across bins in Hi-C data is Gaussian (continuous), with several bins having absolutely no coverage, owing to poorly annotated sequence content, lack of restriction enzyme cut sites or other known experimental biases. In general, the bins with no observed coverage are ignored during matrix-balancing. However, bins with very poor coverage can sometimes be corrected by orders of magnitude to have balanced coverage compared with the rest of the genome. Coverage of conventional whole-genome sequencing data is also not perfectly even, so the justification to balance coverage in Hi-C data is imperfect. Finally, as Hi-C data sets seem to be rapidly moving towards high-resolution analyses, it remains unclear which bias assumptions are more appropriate at smaller bin sizes compared with the larger bin sizes that have until recently predominated in the analyses of Hi-C data. Given the limitations of both explicit approaches and matrix-balancing approaches, we recommend that users conduct careful quality control and experimental validation for the normalized Hi-C data sets. In addition, to ensure reproducibility, it is desirable to compare the normalized results from multiple biological replicates and from different computational approaches. It is also good practice to conduct Hi-C data analyses using both types of bias-removal approaches, as this eliminates the possibility of making a discovery that is dependent on the type of bias-removal method.
Resolution of C-data
To study chromosomal spatial organization, the resolution at which to examine the data needs to be determined. As mentioned above, the resolution of a Hi-C experiment is often conveyed as the size of the genomic loci (or bins) used to compute the meaningful chromatin contacts between pairs of genomic loci19,27. To determine the correct resolution, it must first be appreciated that the linear increase of resolution requires a quadratic increase in total sequencing depth. For example, the first Hi-C study collected 8.7 million reads to study the human genome at 1 Mb and 100 kb resolutions22. The highest resolution Hi-C maps to date collected over 4.9 billion reads to study the human genome at 1 kb resolution27, demonstrating a 3-orders of magnitude increase in sequencing depth for a 2-orders of magnitude increase in resolution. Noticeably, the linear genomic distance between two interacting loci is also a key factor required to determine the appropriate resolution. Because Hi-C contact frequency dramatically decreases as the linear genomic distance increases, in practice, only interactions within a certain range of linear genomic distance are considered. For example, a recent study analysed 5–10-kb-resolution Hi-C data for pairwise interactions within a linear genomic distance of 2 Mb19.
Despite these general principles of resolution, researchers must still arbitrarily select the bin size for which to analyse their Hi-C data, and definitive guidelines for appropriate bin size determination are lacking. Most available approaches for determining bin size are heuristic and difficult to transfer to other experimental settings. For example, resolution has been defined in one study as the smallest bin size for which more than 1,000 valid chromatin contacts can be observed in at least 80% of the bins27. Although this lays out a quantitative criterion, it lacks clear theoretical and experimental justification. It may be argued that the resolution of Hi-C data should be determined by the specific biological questions at hand and interpreted from a statistical perspective. For example, suppose the computational task is the detection of enhancer–promoter interactions. First, a set of experimentally validated interacting loci (true positives) and a set of random collisions (true negatives) must be collected; then, the strength (frequency) of chromatin contacts for both must be quantified. The difference in the distribution of chromatin interaction frequency between the true positives and true negatives can then be used to calculate the total sequencing depth that is required to justify the statistical validity of the pre-specified sensitivity and specificity. Such statistically based power analyses and careful experimental design will help to determine the optimal resolution of a specific Hi-C data set and to facilitate appropriate biological interpretation and discovery.
Analyses of features of global chromatin conformation
The development of the Hi-C technique enabled the characterization of global features of chromatin organization (TABLE 4), leading to the discovery of compartmentalization of chromosome folding within the nucleus22. Genomic regions at two distinct nuclear compartments, arbitrarily labelled compartment A and compartment B, display high contact frequency within the same compartment and low contact frequency between the compartments. Compartment A roughly corresponds to the euchromatin and features higher gene density, whereas compartment B corresponds to the heterochromatin and is largely made up of gene deserts. Compartment B is also closely correlated with lamina-associated domains (LADs). Interestingly, this large-scale genome compartmentalization is highly dynamic during the differentiation of human embryonic stem cells62 and between normal and cancer cells22, suggesting compartmentalization has a crucial role in mediating genome function and cell identity.
Table 4.
Approaches for the analysis of global chromatin conformation
| Approach | Objective | Pros | Cons | Refs |
|---|---|---|---|---|
| PCA | Detect nuclear compartments | Easy to implement; straightforward interpretation | First eigenvector may not work; arbitrary compartment assigning | 22 |
| DI/HMM | Detect TADs | Model the change of upstream and downstream interaction bias | Heuristic tuning parameters | 6 |
| Arrowhead | Detect TADs | High computational efficiency with dynamic programming | Heuristic tuning parameters | 27 |
| Insulation score | Detect TADs | Robust to different sequencing depth; can detect dynamics of TAD boundaries | Heuristic tuning parameters | 90 |
| Armatus | Detect TADs | TAD calling robust in different resolutions | Fails to provide uncertainty in TAD calling | 88 |
| HiCseg | Detect TADs | Models the uncertainty in Hi-C data | Fails to detect multi-level TADs | 89 |
DI, directionality index; HMM, hidden Markov model; PCA, principle component analysis; TAD, topologically associating domain.
Principal component analysis (PCA) on intra- or inter-chromosomal Hi-C contact maps can be applied to designate compartments A and B22,27. More specifically, the sign of the first eigenvector determines the compartment label. Although PCA is easy to implement and has straightforward interpretation, it has two major caveats. First, for some chromosomes, the sign of the first eigenvector represents the short and long chromosome arms, rather than the typical A and B patterns observed in most other chromosomes. In this case, the sign of the second eigenvector should be used to determine the compartment designation. Second, the sign of the first eigenvector is an arbitrary identification method. Without additional information, the compartment cannot be determined. In practice, regions with high gene density can be assigned as compartment A, and regions with low gene density as compartment B.
In general, each compartment is continuous and several megabases in size, reflecting relatively large-scale chromatin architecture. In addition, recent Hi-C analysis at high resolution discovered that sub-compartments, which are distinct compartments within the conventional A and B compartments, may exist; these span smaller genomic regions and correlate with the underlying chromatin biochemical activity27. Higher resolution Hi-C or 5C studies revealed that compartments consist of TADs6,10. In mammals, TADs are approximately 1 Mb in size, conserved across cell types and species, and may serve as the basic unit of genome structure and function. A more comprehensive discussion of the structure and function of TADs can be found in a recent review87.
Developing computational approaches for detecting TADs is an active research area (TABLE 4). The first published approach was based on a hidden Markov model (HMM)6. For each given bin, the total number of interactions located 2 Mb upstream and 2 Mb downstream were calculated and quantified in a metric termed the directionality index. It was assumed that the total number of upstream and downstream interactions are comparable at the centre of TADs but are highly imbalanced at bins adjacent to TAD boundary regions. Based on such an assumption, an HMM was used to capture the sharp transition from the upstream interaction bias to the downstream interaction bias at the TAD boundary regions, which is a distinctive signature of two spatially separate, self-interacting domains. Later on, the Arrowhead algorithm was used to annotate contact domains genome-wide27. Dynamic programming was used to ensure efficient implementation of the Arrowhead algorithm to the high-resolution Hi-C data. Meanwhile, the Armatus algorithm was developed for detecting consistent TAD patterns at different resolutions88. In addition, the HiCseg algorithm can narrow down the problem of annotating TADs from 2D image segmentation to linear (1D) segmentation89. Similarly, a sliding insulation score approach was recently introduced that also transforms the Hi-C contact matrix into an intuitive 1D insulation score vector90. This approach has been demonstrated to detect dynamics of TAD boundary strength in different experimental conditions90. Importantly, most of these approaches rely on heuristic tuning parameters, such as the threshold on the maximal linear genomic distance between two interacting loci when computing the directionality index, which is a measure of orientation biases in chromatin interactions originating from a genomic locus, or the window size for computing insulation, which is a measure of interaction permissibility across a genomic locus. Currently, we suggest researchers try different tuning parameters and visually check the TAD coordinates alongside the Hi-C contact matrix to ensure the validity and reproducibility of TAD-calling results. It is also likely that the hierarchical level of genome organization that can be detected is affected by the tuning parameters. For example, smaller insulation windows or small directionality index windows are more capable of detecting smaller scale chromatin folding structures compared with larger windows.
A key challenge in the analysis of global chromatin conformation lies in the fact that the genome is folded into multiple hierarchical structures, from compartments to TADs, nested sub-TAD structures and individual chromatin loops. Understanding the principles underlying this hierarchical chromosome organization requires the development of novel computational approaches. An excellent review41 highlights the recent computational advance in the analysis of global chromosome organization.
Analyses of local features of chromosome conformation
As a result of ever-increasing DNA sequencing throughput and decreasing sequencing cost, high-resolution Hi-C data sets are attainable and have enabled the analysis of chromatin contacts at nearly kilobase resolution. As this resolution is nearly the size of individual cis-regulatory elements, high-resolution Hi-C data sets can be interrogated for fine-mapping of long-range cis-regulatory interactions and provide novel insights on transcription regulation mechanisms. To that end, many computational approaches have been developed for detecting biologically meaningful long-range chromatin contacts, which is a process termed peak-calling (TABLE 5). In pioneering work, chromatin contact frequencies obtained from Hi-C data were modelled as a negative binomial distribution and a global background model was devised that consists of both systematic bias factors and the linear genomic distance factor19. The Fit-HiC algorithm uses a non-parametric spline approach to model the background-chromatin contact frequency91. Both methods take advantage of a global background model in which the expected interaction frequency of a given pair of loci follows the trend derived from genome-wide contact frequencies at a given linear genomic distance. In both methods, peak-calling led to millions of statistically significant chromatin contacts; however, by using the global background model, this approach may over-estimate chromatin interactions, leading to false positives. Meanwhile, the GOTHiC (genome organisation through HiC) algorithm uses a simple binomial distribution model to simultaneously remove biases in Hi-C data and detect significant interactions by assuming that the global background interaction frequency of two loci depends also on the relative genome-wide coverage54,92. Another feature of GOTHiC is that it implemented the Benjamini–Hochberg multiple-testing correction to control for the false discovery rate. By applying this method to a Hi-C data set from mouse cells, ~90,000 statistically significant interactions could be identified92. By contrast, HiCCUPS (Hi-C computational unbiased peak search) uses a local background model and has been applied to detect chromatin loops in several human and mouse cell lines at 1 kb or 5 kb resolution from in situ Hi-C data27. HiCCUPS identified around ~2,500–10,000 chromatin loops, depending on the resolution of the data set. Recently, the computational problem of detecting significant chromatin interactions was tackled from a different angle, by assuming that the background model (either a global background or a local background) is known and by developing a hidden Markov random field (HMRF) algorithm to model the spatial dependency among neighbourhood interacting loci93 (TABLE 5). In other words, the dependency implies that, if two loci are inferred to be spatially proximal based on Hi-C data, then all the neighbouring loci will have a higher probability of interacting. The HMRF algorithm can achieve higher reproducibility and improves statistical power, especially for the analysis of pairwise contacts in high-resolution Hi-C data. In the future, it would be of great interest to compare the interaction frequency at these identified peaks, as well as other loci, among different experimental conditions and biological contexts. A software package named diffHiC94 was recently developed to detect dynamic chromatin interactions across experimental conditions or cell types. Using the same statistical framework of the edgeR (empirical analysis of DGE in R) package95, which has achieved great success in detecting differentially expressed genes in RNA-seq data, diffHiC has the potential to become a powerful tool for differential-interaction analysis.
Table 5.
Approaches for chromatin contact peak-calling
| Approach | Assumption on background model | Pros | Cons | Refs |
|---|---|---|---|---|
| Jin et al. | Global background | Models contact-frequency uncertainty as a negative binomial distribution | Variability of local chromatin organization may introduce biases | 19 |
| Fit-Hi-C | Global background | Accurate background model using non-parametric spline | Variability of local chromatin organization may introduce biases | 91 |
| GOTHiC | Global background | Models contact-frequency uncertainty as binomial distribution | Variability of local chromatin organization may introduce biases | 54 |
| HiCCUPS | Local background | Designed for high-resolution Hi-C data | Deep sequencing is required | 27 |
| HMRF | Global or local background | Models spatial dependency among adjacent, interacting loci | High computation cost | 93 |
GOTHiC, genome organisation through HiC; HiCCUPS, Hi-C computational unbiased peak search; HMRF, hidden Markov random field.
Capture-HiC shows great promise in the detection of chromatin interactions at loci of interest29,49,54–60. The computational methods for the analysis of Capture-HiC data are still under development. One study used a heuristic observed read-count cut-off in identifying significant interactions, but this lacks solid statistical justification55. Later on, a statistical model based on a convolution of negative binomial and Poisson distributions was proposed to account for background distribution in the Capture-HiC data85. As Capture-HiC technology becomes more popular, novel computational methods will be developed to better-characterize its data.
Several key issues need to be considered with the above peak-calling approaches. First, whether to use a global background model or a local background model is still under debate. Unlike peak-calling in ChIP-seq data analysis, in which input DNA is frequently used as control, it is unclear how to characterize the random collision frequency between chromatin loci. Second, to detect biologically meaningful chromatin interactions, such as those between individual cis-regulatory elements, a great number of candidate loci needs to be considered when statistically determining if any two loci of interest are interacting more frequently than expected. In practice, this imposes a challenging multiple-comparisons problem, which requires highly intensive computation and rigorous statistical justification. Third, biologically meaningful, long-range chromatin contacts are spatially and temporally dynamic. Without a ‘gold standard’ of true-positive and true-negative chromatin contacts, it is difficult to fully evaluate the sensitivity and specificity of each approach. Moreover, to address biological hypotheses, it is important to conduct targeted analyses across different cell types to identify cell-type-specific chromatin contacts94. It is just as important to closely examine cell-type-common chromatin contacts where cell-type-specific enhancer activation is observed, as these may be controlled by different transcription-factor-binding events, rather than by differential chromatin looping27. However, the careful evaluation of technical variability and biological variability of chromatin interaction frequency as well as the comprehensive experimental validation of cell-type-specific chromatin interactions are still lacking. We envision that further advancement in both experimental technologies and computational algorithms for the targeted analysis of chromatin conformation will occur in the near future.
Future perspectives
Although C-technologies have been increasingly used, current experimental protocols have some significant limitations that could prevent the uncovering of additional chromatin organization features. First, common methods produce only static molecular interaction maps that overlook the temporal dynamics of chromatin in live cells and disregard cell-to-cell variability in a population, potentially leading to incorrect models of chromatin organization. Second, current maps of chromatin interaction still lack the fine resolution needed to resolve interactions between individual cis-regulatory elements, greatly limiting our ability to interrogate the functional roles of chromatin structure in gene regulation. Third, current methods for mapping chromatin interactions permit the efficient mapping of only pairwise interactions, thus failing to detect potential multi-way interaction hubs that are suspected to exist in the nucleus. Last, with various different techniques for mapping and analysing chromatin topology, a critical comparison of these methods is greatly needed.
The recently launched 4D Nucleome Project will address these challenges through a multi-pronged approach. In particular, new data standards for assessing different experimental protocols and data analysis methods will be developed. Such standards could include pairs of DNA loci for which chromatin interactions have been rigorously assessed genetically, biochemically and by using microscopy imaging. This US National Institutes of Health (NIH) common fund initiative is also expected to develop improved methods for generating high-resolution chromatin-interaction maps, through a combination of substantial optimization and improvement of experimental protocols, innovative algorithms for data analysis and structural modelling. New methods for determining chromosome organization in small numbers of cells or even single cells will be developed, along with methods that generate complementary views of genome organization without fixation, restriction digestion or ligation.
Live-cell imaging tools and analysis approaches are needed that can accurately inform on dynamic chromatin organization both within and between TADs. Multicolour live-cell 3D imaging tools will be particularly useful for studying chromatin motion in live cells. The results of such experiments could uncover the basic principles governing dynamic chromatin organization at various scales in mammalian cells and help to interpret the contact probability data obtained from C-technologies.
Finally, to achieve a thorough understanding of the structural and functional role of chromatin organization in transcription regulation, 3D chromatin organization data sets will need to be integrated with other genomic and epigenomic data sets in a wide range of cell types and tissues, such as those produced by large-scale consortia like the NIH Encyclopedia of DNA Elements (ENCODE) project, Roadmap Epigenome project and the International Human Epigenome Consortium. This will result in improved knowledge of the functional relationships between chromatin organization and genome function.
Acknowledgments
The authors dedicate this manuscript in loving memory of Joseph Schmitt. They would like to give special thanks to members of the Ren laboratory for their suggestions. This work is supported by the Ludwig Institute for Cancer Research, La Jolla, California, USA, and grants from US National Institutes of Health (NIH; grant U54DK107977 to B.R. and M.H., and grants U54 HG006997 and R01 ES024984 to B.R.). A.D.S. is supported by NIH genetics training grant T32 GM008666.
Glossary
- Hi-C
A high-throughput, genome-wide chromosome conformation capture assay using affinity purification of labelled-DNA ligation junctions to measure pairwise interaction frequencies in cell populations
- Chromosome conformation capture carbon copy
(5C). A high-throughput chromosome conformation capture assay that examines the spatial proximity of two defined sets of genomic regions, measured using a pair of DNA oligos corresponding to the sequences upstream and downstream of the ligation junction
- Target size
The cumulative length (in base pairs) targeted by capture probes in a Capture-HiC experiment
- Bin size
A measure of Hi-C data resolution. A bin is a fixed, non-overlapping genomic span to which Hi-C reads are grouped to increase the signal of chromatin interaction frequency
- Restriction enzyme fragment lengths
The total genomic length in each bin that is within 500 bp of restriction enzyme cut sites used in the Hi-C library preparation
- Mappability
The probability of a read-mapping uniquely to the effective fragment length sequence within each bin
- Poisson distribution
A probability distribution for the discrete random variable in which the variance is the same as the mean
- Negative binomial distribution
A probability distribution for the discrete random variable in which the variance is larger than the mean
- Hi-C contact matrices
Symmetric, two-dimensional matrices (M), for which each matrix entry (Mij) represents the raw or normalized contact frequency between bin i and bin j
- Bait-specific bias
An experimental bias in the Capture-HiC procedure, referring to the unequal probability of probe hybridization to the target sequence as a result of variable sequence content and hybridization properties
- Other-end-specific bias
An experimental bias in the Capture-HiC procedure, referring to the unequal probability of ligation between the bait locus and its interacting restriction fragment as a result of variable local genomic features
- Principal component analysis
(PCA). A statistical approach for multivariate data analysis. PCA converts a set of correlated variables into a set of linearly uncorrelated variables named principal components, each of which is a linear combination of the original correlated variables
- First eigenvector
The coefficients of the linear combination in the first principle component, which has the largest variance among all principal components. In Hi-C data analysis, the sign of the first eigenvector was used to determinate the A and B compartments
- Hidden Markov model
(HMM). A statistical model assuming that the observed data are determined by a set of unobserved (hidden) states with the Markov property: the future state depends on only the current state and is independent of all the previous states
- Heuristic tuning parameters
The parameters in the statistical models and computational pipelines that are not estimated from the observed data but are determined based on prior knowledge and expectation
- Global background model
The statistical model for the expected chromatin contact frequency estimated from genome-wide measurements. It is used to systematically identify significant pairwise Hi-C interactions throughout the genome. All interacting loci pairs at a given linear distance share the same global background model
- Non-parametric spline
A statistical approach to fit the observed data using a piecewise-defined polynomial function
- Benjamini–Hochberg multiple-testing correction
A statistical procedure that uses stringent statistical significance thresholds to control the false discovery rate when performing multiple comparisons
- Local background model
The statistical model for the expected chromatin contact frequency estimated from local chromatin interaction properties. Each pair of interacting loci has a unique local background model, which depends on the definition of its local neighbouring regions
Footnotes
Competing interests statement
The authors declare competing interests: see Web version for details.
References
- 1.ENCODE Project Consortium. An integrated encyclopedia of DNA elements in the human genome. Nature. 2012;489:57–74. doi: 10.1038/nature11247. [DOI] [PMC free article] [PubMed] [Google Scholar]
- 2.Roadmap Epigenomics Consortium et al. Integrative analysis of 111 reference human epigenomes. Nature. 2015;518:317–330. doi: 10.1038/nature14248. [DOI] [PMC free article] [PubMed] [Google Scholar]
- 3.Bickmore WA, van Steensel B. Genome architecture: domain organization of interphase chromosomes. Cell. 2013;152:1270–1284. doi: 10.1016/j.cell.2013.02.001. [DOI] [PubMed] [Google Scholar]
- 4.de Laat W, Duboule D. Topology of mammalian developmental enhancers and their regulatory landscapes. Nature. 2013;502:499–506. doi: 10.1038/nature12753. [DOI] [PubMed] [Google Scholar]
- 5.de Wit E, de Laat W. A decade of 3C technologies: insights into nuclear organization. Genes Dev. 2012;26:11–24. doi: 10.1101/gad.179804.111. [DOI] [PMC free article] [PubMed] [Google Scholar]
- 6.Dixon JR, et al. Topological domains in mammalian genomes identified by analysis of chromatin interactions. Nature. 2012;485:376–380. doi: 10.1038/nature11082. The original study to describe TADs from Hi-C analysis, using novel computation approaches. It discovered that TADs are conserved between cell types and species, and demarcated by CCCTC-binding factor (CTCF) binding at TAD boundaries. [DOI] [PMC free article] [PubMed] [Google Scholar]
- 7.Gorkin DU, Leung D, Ren B. The 3D genome in transcriptional regulation and pluripotency. Cell Stem Cell. 2014;14:762–775. doi: 10.1016/j.stem.2014.05.017. [DOI] [PMC free article] [PubMed] [Google Scholar]
- 8.Levine M, Cattoglio C, Tjian R. Looping back to leap forward: transcription enters a new era. Cell. 2014;157:13–25. doi: 10.1016/j.cell.2014.02.009. [DOI] [PMC free article] [PubMed] [Google Scholar]
- 9.Nora EP, Dekker J, Heard E. Segmental folding of chromosomes: a basis for structural and regulatory chromosomal neighborhoods? Bioessays. 2013;35:818–828. doi: 10.1002/bies.201300040. [DOI] [PMC free article] [PubMed] [Google Scholar]
- 10.Nora EP, et al. Spatial partitioning of the regulatory landscape of the X-inactivation centre. Nature. 2012;485:381–385. doi: 10.1038/nature11049. [DOI] [PMC free article] [PubMed] [Google Scholar]
- 11.Phillips-Cremins JE, et al. Architectural protein subclasses shape 3D organization of genomes during lineage commitment. Cell. 2013;153:1281–1295. doi: 10.1016/j.cell.2013.04.053. [DOI] [PMC free article] [PubMed] [Google Scholar]
- 12.Deng W, et al. Reactivation of developmentally silenced globin genes by forced chromatin looping. Cell. 2014;158:849–860. doi: 10.1016/j.cell.2014.05.050. [DOI] [PMC free article] [PubMed] [Google Scholar]
- 13.Deng W, et al. Controlling long-range genomic interactions at a native locus by targeted tethering of a looping factor. Cell. 2012;149:1233–1244. doi: 10.1016/j.cell.2012.03.051. [DOI] [PMC free article] [PubMed] [Google Scholar]
- 14.Kim A, Dean A. Chromatin loop formation in the β-globin locus and its role in globin gene transcription. Mol Cells. 2012;34:1–5. doi: 10.1007/s10059-012-0048-8. [DOI] [PMC free article] [PubMed] [Google Scholar]
- 15.Krivega I, Dean A. Enhancer and promoter interactions-long distance calls. Curr Opin Genet Dev. 2012;22:79–85. doi: 10.1016/j.gde.2011.11.001. [DOI] [PMC free article] [PubMed] [Google Scholar]
- 16.Plank JL, Dean A. Enhancer function: mechanistic and genome-wide insights come together. Mol Cell. 2014;55:5–14. doi: 10.1016/j.molcel.2014.06.015. [DOI] [PMC free article] [PubMed] [Google Scholar]
- 17.Dowen JM, et al. Control of cell identity genes occurs in insulated neighborhoods in mammalian chromosomes. Cell. 2014;159:374–387. doi: 10.1016/j.cell.2014.09.030. [DOI] [PMC free article] [PubMed] [Google Scholar]
- 18.Heidari N, et al. Genome-wide map of regulatory interactions in the human genome. Genome Res. 2014;24:1905–1917. doi: 10.1101/gr.176586.114. [DOI] [PMC free article] [PubMed] [Google Scholar]
- 19.Jin F, et al. A high-resolution map of the three-dimensional chromatin interactome in human cells. Nature. 2013;503:290–294. doi: 10.1038/nature12644. The first paper to report Hi-C interaction maps at the resolution of individual restriction fragments in mammals. This study also introduced the global background model. [DOI] [PMC free article] [PubMed] [Google Scholar]
- 20.Li G, et al. Extensive promoter-centered chromatin interactions provide a topological basis for transcription regulation. Cell. 2012;148:84–98. doi: 10.1016/j.cell.2011.12.014. [DOI] [PMC free article] [PubMed] [Google Scholar]
- 21.Sanyal A, Lajoie BR, Jain G, Dekker J. The long-range interaction landscape of gene promoters. Nature. 2012;489:109–113. doi: 10.1038/nature11279. [DOI] [PMC free article] [PubMed] [Google Scholar]
- 22.Lieberman-Aiden E, et al. Comprehensive mapping of long-range interactions reveals folding principles of the human genome. Science. 2009;326:289–293. doi: 10.1126/science.1181369. The original study describing Hi-C technology. This study was also the first to describe the genome compartments A and B, which respectively mark colocalizing active and repressed regions of the genome. [DOI] [PMC free article] [PubMed] [Google Scholar]
- 23.Fullwood MJ, et al. An oestrogen-receptor-α-bound human chromatin interactome. Nature. 2009;462:58–64. doi: 10.1038/nature08497. [DOI] [PMC free article] [PubMed] [Google Scholar]
- 24.Kalhor R, Tjong H, Jayathilaka N, Alber F, Chen L. Genome architectures revealed by tethered chromosome conformation capture and population-based modeling. Nat Biotechnol. 2012;30:90–98. doi: 10.1038/nbt.2057. [DOI] [PMC free article] [PubMed] [Google Scholar]
- 25.Hughes JR, et al. Analysis of hundreds of cis-regulatory landscapes at high resolution in a single, high-throughput experiment. Nat Genet. 2014;46:205–212. doi: 10.1038/ng.2871. [DOI] [PubMed] [Google Scholar]
- 26.Kolovos P, et al. Targeted chromatin capture (T2C): a novel high resolution high throughput method to detect genomic interactions and regulatory elements. Epigenetics Chromatin. 2014;7:10. doi: 10.1186/1756-8935-7-10. [DOI] [PMC free article] [PubMed] [Google Scholar]
- 27.Rao SS, et al. A 3D map of the human genome at kilobase resolution reveals principles of chromatin looping. Cell. 2014;159:1665–1680. doi: 10.1016/j.cell.2014.11.021. The highest-resolution Hi-C analysis to date, at 1-5kb resolution in 9 human and mouse cell types. This study reports that the genome is organized globally into 6 sub-compartments, within which the genome is organized into ~10,000 chromatin loops, many of which are conserved across species and cell types, and are anchored by CTCF binding in convergent orientation. [DOI] [PMC free article] [PubMed] [Google Scholar]
- 28.Selvaraj S, R Dixon J, Bansal V, Ren B. Whole-genome haplotype reconstruction using proximity-ligation and shotgun sequencing. Nat Biotechnol. 2013;31:1111–1118. doi: 10.1038/nbt.2728. [DOI] [PMC free article] [PubMed] [Google Scholar]
- 29.Selvaraj S, Schmitt AD, Dixon JR, Ren B. Complete haplotype phasing of the MHC and KIR loci with targeted HaploSeq. BMC Genomics. 2015;16:900. doi: 10.1186/s12864-015-1949-7. [DOI] [PMC free article] [PubMed] [Google Scholar]
- 30.de Vree PJ, et al. Targeted sequencing by proximity ligation for comprehensive variant detection and local haplotyping. Nat Biotechnol. 2014;32:1019–1025. doi: 10.1038/nbt.2959. [DOI] [PubMed] [Google Scholar]
- 31.Burton JN, et al. Chromosome-scale scaffolding of de novo genome assemblies based on chromatin interactions. Nat Biotechnol. 2013;31:1119–1125. doi: 10.1038/nbt.2727. [DOI] [PMC free article] [PubMed] [Google Scholar]
- 32.Kaplan N, Dekker J. High-throughput genome scaffolding from in vivo DNA interaction frequency. Nat Biotechnol. 2013;31:1143–1147. doi: 10.1038/nbt.2768. [DOI] [PMC free article] [PubMed] [Google Scholar]
- 33.Marie-Nelly H, et al. High-quality genome (re)assembly using chromosomal contact data. Nat Commun. 2014;5:5695. doi: 10.1038/ncomms6695. [DOI] [PMC free article] [PubMed] [Google Scholar]
- 34.Beitel CW, et al. Strain- and plasmid-level deconvolution of a synthetic metagenome by sequencing proximity ligation products. PeerJ. 2014;2:e415. doi: 10.7717/peerj.415. [DOI] [PMC free article] [PubMed] [Google Scholar]
- 35.Burton JN, Liachko I, Dunham MJ, Shendure J. Species-level deconvolution of metagenome assemblies with Hi-C-based contact probability maps. G3 (Bethesda) 2014;4:1339–1346. doi: 10.1534/g3.114.011825. [DOI] [PMC free article] [PubMed] [Google Scholar]
- 36.Marbouty M, et al. Metagenomic chromosome conformation capture (meta3C) unveils the diversity of chromosome organization in microorganisms. eLife. 2014;3:e03318. doi: 10.7554/eLife.03318. [DOI] [PMC free article] [PubMed] [Google Scholar]
- 37.Duan Z, et al. A three-dimensional model of the yeast genome. Nature. 2010;465:363–367. doi: 10.1038/nature08973. [DOI] [PMC free article] [PubMed] [Google Scholar]
- 38.Nagano T, et al. Single-cell Hi-C reveals cell-to-cell variability in chromosome structure. Nature. 2013;502:59–64. doi: 10.1038/nature12593. [DOI] [PMC free article] [PubMed] [Google Scholar]
- 39.Snyder MW, Adey A, Kitzman JO, Shendure J. Haplotype-resolved genome sequencing: experimental methods and applications. Nat Rev Genet. 2015;16:344–358. doi: 10.1038/nrg3903. [DOI] [PubMed] [Google Scholar]
- 40.Flot JF, Marie-Nelly H, Koszul R. Contact genomics: scaffolding and phasing (meta)genomes using chromosome 3D physical signatures. FEBS Lett. 2015;589:2966–2974. doi: 10.1016/j.febslet.2015.04.034. [DOI] [PubMed] [Google Scholar]
- 41.Imakaev MV, Fudenberg G, Mirny LA. Modeling chromosomes: beyond pretty pictures. FEBS Lett. 2015;589:3031–3036. doi: 10.1016/j.febslet.2015.09.004. [DOI] [PMC free article] [PubMed] [Google Scholar]
- 42.Serra F, et al. Restraint-based three-dimensional modeling of genomes and genomic domains. FEBS Lett. 2015;589:2987–2995. doi: 10.1016/j.febslet.2015.05.012. [DOI] [PubMed] [Google Scholar]
- 43.Dekker J, Rippe K, Dekker M, Kleckner N. Capturing chromosome conformation. Science. 2002;295:1306–1311. doi: 10.1126/science.1067799. The original study describing 3C technology. [DOI] [PubMed] [Google Scholar]
- 44.Cullen KE, Kladde MP, Seyfred MA. Interaction between transcription regulatory regions of prolactin chromatin. Science. 1993;261:203–206. doi: 10.1126/science.8327891. [DOI] [PubMed] [Google Scholar]
- 45.Zhao Z, et al. Circular chromosome conformation capture (4C) uncovers extensive networks of epigenetically regulated intra- and interchromosomal interactions. Nat Genet. 2006;38:1341–1347. doi: 10.1038/ng1891. A study reporting chromosome conformation capture-on-chip (4C), which explores the genome-wide interactions of individual loci at high resolution. [DOI] [PubMed] [Google Scholar]
- 46.van de Werken HJ, et al. Robust 4C-seq data analysis to screen for regulatory DNA interactions. Nat Methods. 2012;9:969–972. doi: 10.1038/nmeth.2173. [DOI] [PubMed] [Google Scholar]
- 47.Sexton T, et al. Three-dimensional folding and functional organization principles of the Drosophila genome. Cell. 2012;148:458–472. doi: 10.1016/j.cell.2012.01.010. [DOI] [PubMed] [Google Scholar]
- 48.Deng X, et al. Bipartite structure of the inactive mouse X chromosome. Genome Biol. 2015;16:152. doi: 10.1186/s13059-015-0728-8. [DOI] [PMC free article] [PubMed] [Google Scholar]
- 49.Ma W, et al. Fine-scale chromatin interaction maps reveal the cis-regulatory landscape of human lincRNA genes. Nat Methods. 2015;12:71–78. doi: 10.1038/nmeth.3205. The first study to report the use of DNase Hi-C and DNase Capture-HiC, and the first application of Capture-HiC to specifically enrich for gene promoters. [DOI] [PMC free article] [PubMed] [Google Scholar]
- 50.Hsieh TH, et al. Mapping nucleosome resolution chromosome folding in yeast by micro-C. Cell. 2015;162:108–119. doi: 10.1016/j.cell.2015.05.048. [DOI] [PMC free article] [PubMed] [Google Scholar]
- 51.Simonis M, et al. Nuclear organization of active and inactive chromatin domains uncovered by chromosome conformation capture-on-chip (4C) Nat Genet. 2006;38:1348–1354. doi: 10.1038/ng1896. Another study reporting chromosome conformation capture-on-chip (4C), which explores the genome-wide interactions of individual loci at high resolution. [DOI] [PubMed] [Google Scholar]
- 52.Dostie J, et al. Chromosome conformation capture carbon copy (5C): a massively parallel solution for mapping interactions between genomic elements. Genome Res. 2006;16:1299–1309. doi: 10.1101/gr.5571506. The original study describing 5C, which explores the interaction profiles of several contiguous loci with each other at high resolution. [DOI] [PMC free article] [PubMed] [Google Scholar]
- 53.Martin P, et al. Capture Hi-C reveals novel candidate genes and complex long-range interactions with related autoimmune risk loci. Nat Commun. 2015;6:10069. doi: 10.1038/ncomms10069. [DOI] [PMC free article] [PubMed] [Google Scholar]
- 54.Mifsud B, et al. Mapping long-range promoter contacts in human cells with high-resolution capture Hi-C. Nat Genet. 2015;47:598–606. doi: 10.1038/ng.3286. [DOI] [PubMed] [Google Scholar]
- 55.Sahlen P, et al. Genome-wide mapping of promoter-anchored interactions with close to single-enhancer resolution. Genome Biol. 2015;16:156. doi: 10.1186/s13059-015-0727-9. [DOI] [PMC free article] [PubMed] [Google Scholar]
- 56.Schoenfelder S, et al. The pluripotent regulatory circuitry connecting promoters to their long-range interacting elements. Genome Res. 2015;25:582–597. doi: 10.1101/gr.185272.114. The first application of Capture-HiC to capture all promoters in the genome, demonstrating the feasibility and quality of obtaining high-resolution promoter interaction profiles for >20,000 loci in a single assay. [DOI] [PMC free article] [PubMed] [Google Scholar]
- 57.Schoenfelder S, et al. Polycomb repressive complex PRC1 spatially constrains the mouse embryonic stem cell genome. Nat Genet. 2015;47:1179–1186. doi: 10.1038/ng.3393. [DOI] [PMC free article] [PubMed] [Google Scholar]
- 58.Dryden NH, et al. Unbiased analysis of potential targets of breast cancer susceptibility loci by Capture Hi-C. Genome Res. 2014;24:1854–1868. doi: 10.1101/gr.175034.114. The original study describing Capture-HiC technology and its use to interrogate the interaction landscapes of several disease-associated risk loci. [DOI] [PMC free article] [PubMed] [Google Scholar]
- 59.Jager R, et al. Capture Hi-C identifies the chromatin interactome of colorectal cancer risk loci. Nat Commun. 2015;6:6178. doi: 10.1038/ncomms7178. [DOI] [PMC free article] [PubMed] [Google Scholar]
- 60.Sanborn AL, et al. Chromatin extrusion explains key features of loop and domain formation in wild-type and engineered genomes. Proc Natl Acad Sci USA. 2015;112:E6456–E6465. doi: 10.1073/pnas.1518552112. [DOI] [PMC free article] [PubMed] [Google Scholar]
- 61.Schmitt MW, et al. Sequencing small genomic targets with high efficiency and extreme accuracy. Nat Methods. 2015;12:423–425. doi: 10.1038/nmeth.3351. [DOI] [PMC free article] [PubMed] [Google Scholar]
- 62.Dixon JR, et al. Chromatin architecture reorganization during stem cell differentiation. Nature. 2015;518:331–336. doi: 10.1038/nature14222. A high-resolution Hi-C analysis in human embryonic stem cells and four derived cell types, revealing a relationship between dynamic chromatin organization and gene expression, as well as haplotype-resolved dynamics in chromatin organization patterns. [DOI] [PMC free article] [PubMed] [Google Scholar]
- 63.Fraser J, et al. Hierarchical folding and reorganization of chromosomes are linked to transcriptional changes in cellular differentiation. Mol Syst Biol. 2015;11:852. doi: 10.15252/msb.20156492. [DOI] [PMC free article] [PubMed] [Google Scholar]
- 64.Leung D, et al. Integrative analysis of haplotype-resolved epigenomes across human tissues. Nature. 2015;518:350–354. doi: 10.1038/nature14217. [DOI] [PMC free article] [PubMed] [Google Scholar]
- 65.Nagano T, et al. Comparison of Hi-C results using in-solution versus in-nucleus ligation. Genome Biol. 2015;16:175. doi: 10.1186/s13059-015-0753-7. [DOI] [PMC free article] [PubMed] [Google Scholar]
- 66.Seitan VC, et al. Cohesin-based chromatin interactions enable regulated gene expression within preexisting architectural compartments. Genome Res. 2013;23:2066–2077. doi: 10.1101/gr.161620.113. [DOI] [PMC free article] [PubMed] [Google Scholar]
- 67.Sofueva S, et al. Cohesin-mediated interactions organize chromosomal domain architecture. EMBO J. 2013;32:3119–3129. doi: 10.1038/emboj.2013.237. [DOI] [PMC free article] [PubMed] [Google Scholar]
- 68.Zuin J, et al. Cohesin and CTCF differentially affect chromatin architecture and gene expression in human cells. Proc Natl Acad Sci USA. 2014;111:996–1001. doi: 10.1073/pnas.1317788111. [DOI] [PMC free article] [PubMed] [Google Scholar]
- 69.Belton JM, et al. Hi-C: a comprehensive technique to capture the conformation of genomes. Methods. 2012;58:268–276. doi: 10.1016/j.ymeth.2012.05.001. [DOI] [PMC free article] [PubMed] [Google Scholar]
- 70.van Berkum NL, et al. Hi-C: a method to study the three-dimensional architecture of genomes. J Vis Exp. 2010;39:1869. doi: 10.3791/1869. [DOI] [PMC free article] [PubMed] [Google Scholar]
- 71.Comet I, Schuettengruber B, Sexton T, Cavalli G. A chromatin insulator driving three-dimensional Polycomb response element (PRE) contacts and Polycomb association with the chromatin fiber. Proc Natl Acad Sci USA. 2011;108:2294–2299. doi: 10.1073/pnas.1002059108. [DOI] [PMC free article] [PubMed] [Google Scholar]
- 72.van de Werken HJ, et al. 4C technology: protocols and data analysis. Methods Enzymol. 2012;513:89–112. doi: 10.1016/B978-0-12-391938-0.00004-5. [DOI] [PubMed] [Google Scholar]
- 73.Adey A, et al. Rapid, low-input, low-bias construction of shotgun fragment libraries by high-density in vitro transposition. Genome Biol. 2010;11:R119. doi: 10.1186/gb-2010-11-12-r119. [DOI] [PMC free article] [PubMed] [Google Scholar]
- 74.Williamson I, et al. Anterior-posterior differences in HoxD chromatin topology in limb development. Development. 2012;139:3157–3167. doi: 10.1242/dev.081174. [DOI] [PMC free article] [PubMed] [Google Scholar]
- 75.Bickmore WA. The spatial organization of the human genome. Annu Rev Genomics Hum Genet. 2013;14:67–84. doi: 10.1146/annurev-genom-091212-153515. [DOI] [PubMed] [Google Scholar]
- 76.Williamson I, et al. Spatial genome organization: contrasting views from chromosome conformation capture and fluorescence in situ hybridization. Genes Dev. 2014;28:2778–2791. doi: 10.1101/gad.251694.114. [DOI] [PMC free article] [PubMed] [Google Scholar]
- 77.Yaffe E, Tanay A. Probabilistic modeling of Hi-C contact maps eliminates systematic biases to characterize global chromosomal architecture. Nat Genet. 2011;43:1059–1065. doi: 10.1038/ng.947. [DOI] [PubMed] [Google Scholar]
- 78.Hu M, et al. HiCNorm: removing biases in Hi-C data via Poisson regression. Bioinformatics. 2012;28:3131–3133. doi: 10.1093/bioinformatics/bts570. [DOI] [PMC free article] [PubMed] [Google Scholar]
- 79.Imakaev M, et al. Iterative correction of Hi-C data reveals hallmarks of chromosome organization. Nat Methods. 2012;9:999–1003. doi: 10.1038/nmeth.2148. [DOI] [PMC free article] [PubMed] [Google Scholar]
- 80.Servant N, et al. HiC-Pro: an optimized and flexible pipeline for Hi-C data processing. Genome Biol. 2015;16:259. doi: 10.1186/s13059-015-0831-x. [DOI] [PMC free article] [PubMed] [Google Scholar]
- 81.Li W, Gong K, Li Q, Alber F, Zhou XJ. Hi-Corrector: a fast, scalable and memory-efficient package for normalizing large-scale Hi-C data. Bioinformatics. 2015;31:960–962. doi: 10.1093/bioinformatics/btu747. [DOI] [PMC free article] [PubMed] [Google Scholar]
- 82.Knopp P, Sinkhorn R. Concerning nonnegative matrices and doubly stochastic matrices. Pacif J Math. 1967;21:343–348. [Google Scholar]
- 83.Knight PA, Ruiz D. A fast algorithm for matrix balancing. IMA J Numer Analysis. 2012;33:1029–1047. [Google Scholar]
- 84.Shavit Y, Lio P. Combining a wavelet change point and the Bayes factor for analysing chromosomal interaction data. Mol Biosyst. 2014;10:1576–1585. doi: 10.1039/c4mb00142g. [DOI] [PubMed] [Google Scholar]
- 85.Cairns J, et al. CHiCAGO: robust detection of DNA looping interactions in capture Hi-C data. Genome Biol. 2015;17:127. doi: 10.1186/s13059-016-0992-2. [DOI] [PMC free article] [PubMed] [Google Scholar]
- 86.Cournac A, Marie-Nelly H, Marbouty M, Koszul R, Mozziconacci J. Normalization of a chromosomal contact map. BMC Genomics. 2012;13:436. doi: 10.1186/1471-2164-13-436. [DOI] [PMC free article] [PubMed] [Google Scholar]
- 87.Dekker J, Heard E. Structural and functional diversity of topologically associating domains. FEBS Lett. 2015;589:2877–2884. doi: 10.1016/j.febslet.2015.08.044. [DOI] [PMC free article] [PubMed] [Google Scholar]
- 88.Filippova D, Patro R, Duggal G, Kingsford C. Identification of alternative topological domains in chromatin. Algorithms Mol Biol. 2014;9:14. doi: 10.1186/1748-7188-9-14. [DOI] [PMC free article] [PubMed] [Google Scholar]
- 89.Levy-Leduc C, Delattre M, Mary-Huard T, Robin S. Two-dimensional segmentation for analyzing Hi-C data. Bioinformatics. 2014;30:i386–i392. doi: 10.1093/bioinformatics/btu443. [DOI] [PMC free article] [PubMed] [Google Scholar]
- 90.Crane E, et al. Condensin-driven remodelling of X chromosome topology during dosage compensation. Nature. 2015;523:240–244. doi: 10.1038/nature14450. [DOI] [PMC free article] [PubMed] [Google Scholar]
- 91.Ay F, Bailey TL, Noble WS. Statistical confidence estimation for Hi-C data reveals regulatory chromatin contacts. Genome Res. 2014;24:999–1011. doi: 10.1101/gr.160374.113. [DOI] [PMC free article] [PubMed] [Google Scholar]
- 92.Mifsud B, et al. GOTHiC, a simple probabilistic model to resolve complex biases and to identify real interactions in Hi-C data. Preprint at bioRxiv. 2015 doi: 10.1371/journal.pone.0174744. http://dx.doi.org/10.1101/023317. [DOI] [PMC free article] [PubMed]
- 93.Xu Z, et al. A hidden Markov random field based Bayesian method for the detection of long-range chromosomal intereactions in Hi-C data. Bioinformatics. 2015;32:650–656. doi: 10.1093/bioinformatics/btv650. [DOI] [PMC free article] [PubMed] [Google Scholar]
- 94.Lun AT, Smyth G. K diffHic: a bioconductor package to detect differential genomic interactions in Hi-C data. BMC Bioinformatics. 2015;16:258. doi: 10.1186/s12859-015-0683-0. [DOI] [PMC free article] [PubMed] [Google Scholar]
- 95.Robinson MD, McCarthy DJ, Smyth G. K edgeR: A Bioconductor package for differential expression analysis of digital gene expression data. Bioinformatics. 2010;26:139–140. doi: 10.1093/bioinformatics/btp616. [DOI] [PMC free article] [PubMed] [Google Scholar]
- 96.Nagano T, et al. Single-cell Hi-C for genome-wide detection of chromatin interactions that occur simultaneously in a single cell. Nat Protoc. 2015;10:1986–2003. doi: 10.1038/nprot.2015.127. [DOI] [PubMed] [Google Scholar]
- 97.Dekker J. The three ‘C’ s of chromosome conformation capture: controls, controls, controls. Nat Methods. 2006;3:17–21. doi: 10.1038/nmeth823. [DOI] [PubMed] [Google Scholar]
- 98.Hagege H, et al. Quantitative analysis of chromosome conformation capture assays (3C-qPCR) Nat Protoc. 2007;2:1722–1733. doi: 10.1038/nprot.2007.243. [DOI] [PubMed] [Google Scholar]
- 99.Louwers M, Splinter E, van Driel R, de Laat W, Stam M. Studying physical chromatin interactions in plants using chromosome conformation capture (3C) Nat Protoc. 2009;4:1216–1229. doi: 10.1038/nprot.2009.113. [DOI] [PubMed] [Google Scholar]
- 100.Naumova N, Smith EM, Zhan Y, Dekker J. Analysis of long-range chromatin interactions using chromosome conformation capture. Methods. 2012;58:192–203. doi: 10.1016/j.ymeth.2012.07.022. [DOI] [PMC free article] [PubMed] [Google Scholar]
- 101.Ribeiro de Almeida C, et al. The DNA-binding protein CTCF limits proximal Vκ recombination and restricts κ enhancer interactions to the immunoglobulin κ light chain locus. Immunity. 2011;35:501–513. doi: 10.1016/j.immuni.2011.07.014. [DOI] [PubMed] [Google Scholar]
- 102.Stadhouders R, et al. Multiplexed chromosome conformation capture sequencing for rapid genome-scale high-resolution detection of long-range chromatin interactions. Nat Protoc. 2013;8:509–524. doi: 10.1038/nprot.2013.018. [DOI] [PubMed] [Google Scholar]
- 103.Wurtele H, Chartrand P. Genome-wide scanning of HoxB1-associated loci in mouse ES cells using an open-ended chromosome conformation capture methodology. Chromosome Res. 2006;14:477–495. doi: 10.1007/s10577-006-1075-0. [DOI] [PubMed] [Google Scholar]
- 104.Harismendy O, et al. 9p21 DNA variants associated with coronary artery disease impair interferon-gamma signalling response. Nature. 2011;470:264–268. doi: 10.1038/nature09753. [DOI] [PMC free article] [PubMed] [Google Scholar]
- 105.Gondor A, Rougier C, Ohlsson R. High-resolution circular chromosome conformation capture assay. Nat Protoc. 2008;3:303–313. doi: 10.1038/nprot.2007.540. [DOI] [PubMed] [Google Scholar]
- 106.Splinter E, et al. The inactive X chromosome adopts a unique three-dimensional conformation that is dependent on Xist RNA. Genes Dev. 2011;25:1371–1383. doi: 10.1101/gad.633311. [DOI] [PMC free article] [PubMed] [Google Scholar]
- 107.Gheldof N, Leleu M, Noordermeer D, Rougemont J, Reymond A. Detecting long-range chromatin interactions using the chromosome conformation capture sequencing (4C-seq) method. Methods Mol Biol. 2012;786:211–225. doi: 10.1007/978-1-61779-292-2_13. [DOI] [PubMed] [Google Scholar]
- 108.Splinter E, de Wit E, van de Werken HJ, Klous P, de Laat W. Determining long-range chromatin interactions for selected genomic sites using 4C-seq technology: from fixation to computation. Methods. 2012;58:221–230. doi: 10.1016/j.ymeth.2012.04.009. [DOI] [PubMed] [Google Scholar]
- 109.Schoenfelder S, et al. Preferential associations between co-regulated genes reveal a transcriptional interactome in erythroid cells. Nat Genet. 2010;42:53–61. doi: 10.1038/ng.496. [DOI] [PMC free article] [PubMed] [Google Scholar]
- 110.Sexton T, et al. Sensitive detection of chromatin coassociations using enhanced chromosome conformation capture on chip. Nat Protoc. 2012;7:1335–1350. doi: 10.1038/nprot.2012.071. [DOI] [PubMed] [Google Scholar]
- 111.Ling JQ, et al. CTCF mediates interchromosomal colocalization between Igf2/H19 and Wsb1/Nf1. Science. 2006;312:269–272. doi: 10.1126/science.1123191. [DOI] [PubMed] [Google Scholar]
- 112.Ling J, Hoffman AR. Associated chromosome trap for identifying long-range DNA interactions. J Vis Exp. 2011;50:2621. doi: 10.3791/2621. [DOI] [PMC free article] [PubMed] [Google Scholar]
- 113.Dostie J, Zhan Y, Dekker J. Chromosome conformation capture carbon copy technology. Curr Protoc Mol Biol. 2007 doi: 10.1002/0471142727.mb2114s80. http://dx.doi.org/10.1002/0471142727.mb2114s80. [DOI] [PubMed]
- 114.Ferraiuolo MA, Sanyal A, Naumova N, Dekker J, Dostie J. From cells to chromatin: capturing snapshots of genome organization with 5C technology. Methods. 2012;58:255–267. doi: 10.1016/j.ymeth.2012.10.011. [DOI] [PMC free article] [PubMed] [Google Scholar]
- 115.Fraser J, Ethier SD, Miura H, Dostie JA. Torrent of data: mapping chromatin organization using 5C and high-throughput sequencing. Methods Enzymol. 2012;513:113–141. doi: 10.1016/B978-0-12-391938-0.00005-7. [DOI] [PubMed] [Google Scholar]
- 116.Umbarger MA. Chromosome conformation capture assays in bacteria. Methods. 2012;58:212–220. doi: 10.1016/j.ymeth.2012.06.017. [DOI] [PubMed] [Google Scholar]
- 117.Rodley CD, Bertels F, Jones B, O’Sullivan JM. Global identification of yeast chromosome interactions using genome conformation capture. Fungal Genet Biol. 2009;46:879–886. doi: 10.1016/j.fgb.2009.07.006. [DOI] [PubMed] [Google Scholar]
- 118.Duan Z, et al. A genome-wide 3C-method for characterizing the three-dimensional architectures of genomes. Methods. 2012;58:277–288. doi: 10.1016/j.ymeth.2012.06.018. [DOI] [PMC free article] [PubMed] [Google Scholar]
- 119.Tanizawa H, et al. Mapping of long-range associations throughout the fission yeast genome reveals global genome organization linked to transcriptional regulation. Nucleic Acids Res. 2010;38:8164–8177. doi: 10.1093/nar/gkq955. [DOI] [PMC free article] [PubMed] [Google Scholar]