

Summary
Targeting of general coactivators is an emerging strategy to interfere with oncogenic transcription factors (TFs). However, coactivator perturbations are often pleiotropic and influence numerous TFs. Here we identify TAF12, a subunit of TFIID-SAGA coactivator complexes, as a selective requirement for acute myeloid leukemia (AML) progression. We trace this dependency to a direct interaction between the TAF12/TAF4 histone-fold heterodimer and the transactivation domain of MYB, a TF with established roles in leukemogenesis. Ectopic expression of the TAF4 histone-fold fragment can efficiently squelch TAF12 in cells, suppress MYB, and regress AML in mice. Our study reveals a strategy for potent MYB inhibition in AML and highlights how an oncogenic TF can be selectively neutralized by targeting a general coactivator complex.
eTOC blurb/In Brief
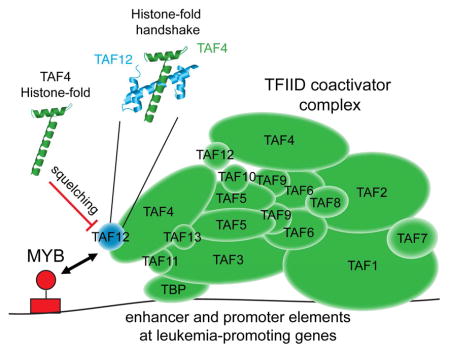
Xu et al. show that TAF12 is a coactivator of MYB and protects MYB from degradation. TAF12, in a heterodimer with TAF4, interacts with the transactivation domain of MYB. Perturbation of this interaction by squelching TAF12 impairs MYB activity and leads to regression of acute myeloid leukemia in mouse models.
Introduction
Several lines of evidence indicate that the hematopoietic malignancy acute myeloid leukemia (AML) can be treated by modulating the transcriptional regulatory machinery (Brien et al., 2016). The clearest example of a transcriptional target in this disease is PML-RARA, a transcription factor (TF) oncoprotein produced via a chromosomal translocation (Heinz et al., 2010). Direct targeting of PML-RARA with all-trans retinoic acid and arsenic trioxide is curative in the subset of AML patients harboring this genetic alteration (Lo-Coco et al., 2013). By extension, other oncoproteins in AML, such as MLL-fusions, are also compelling targets for drug development (Krivtsov and Armstrong, 2007). A second category of transcriptional targets in AML are the so-called “non-oncogene” dependencies, which are non-mutated transcriptional regulators that perform vital functions in sustaining AML. These include the writers (e.g. DOT1L), readers (e.g. BRD4), and erasers (e.g. LSD1) of lysine methylation and acetylation, and inhibitors of these targets are currently under investigation in human clinical trials (Krivtsov and Armstrong, 2007).
BRD4 is unique among the non-oncogene transcriptional targets in AML, in that it functions as a general coactivator (Shi and Vakoc, 2014). In AML cells, BRD4 is recruited broadly to enhancers and promoters by a collection of hematopoietic lineage TFs, including MYB, PU.1, FLI1, ERG, C/EBPα, and C/EBPβ to support transcriptional activation (Roe et al., 2015). BRD4 can be released from TF binding sites in the genome by small-molecule inhibitors (e.g. JQ1 and I-BET), which lead to suppression of TF output to induce a powerful anti-leukemia response (Bhagwat et al., 2016; Dawson et al., 2011; Roe et al., 2015; Zuber et al., 2011b). While the therapeutic activity of BRD4 inhibition in AML has been demonstrated in mouse models and in early-stage clinical trials, this perturbation will provoke toxicities in normal tissues, which is an expected consequence of targeting a general coactivator (Xu and Vakoc, 2017). Nonetheless, the identification of BRD4 as a vulnerability in AML has motivated efforts to develop compounds targeting other general coactivator complexes, including the BRD9 subunit of SWI/SNF (Hohmann et al., 2016), the CDK7 subunit of TFIIH (Kwiatkowski et al., 2014), and the CDK8/19 subunits of Mediator (Pelish et al., 2015). Despite these efforts, pleiotropic effects on normal tissues or a lack of anti-AML potency are lingering concerns with this therapeutic strategy.
One critical transcriptional coactivator which has yet to be evaluated as a cancer dependency is TFIID, which is comprised of the TATA-box binding protein (TBP) and 13 TBP-associated factors (TAFs) (Burley and Roeder, 1996). Among the multi-subunit coactivator complexes, TFIID is unique in its ability to interact directly with core promoter elements and nucleate the formation of a pre-initiation complex (PIC) comprised of TFIIA/B/E/F/H and RNA polymerase II (Burley and Roeder, 1996). While the entirety of the TFIID complex is broadly essential for transcriptional activation (Warfield et al., 2017), individual TAF subunits can perform specialized functions as docking sites for TFs. As examples, TAF4 (also known as TAF4a) interacts with HNF4A in hepatocytes and TAF10 interacts with GATA-1 in erythroid cells (Alpern et al., 2014; Papadopoulos et al., 2015). Consequently, genetic inactivation of TAFs can phenocopy the effects of targeting their interacting TFs. For example, TAF4 knockout mice exhibit defective liver development and TAF10 knockout mice have a block in erythropoiesis (Alpern et al., 2014; Papadopoulos et al., 2015). Despite the well-studied roles of TFIID in basic transcriptional regulation in model organisms, the role of TFIID in cancer remains poorly understood.
Results
A TFIID-focused shRNA screen reveals that acute myeloid leukemia cells are hypersensitive to TAF12 knockdown
While it is known that AML cells are sensitive to the targeting of coactivators, the role of TFIID in this disease has not been examined. We hypothesized that select TFIID subunits might serve as interaction surfaces for AML-promoting TFs, and therefore may represent opportunities for therapeutic intervention. To evaluate this, we constructed an arrayed retroviral library of 86 shRNAs targeting 16 genes encoding the subunits of TFIID expressed in hematopoietic cells (Figure 1A and S1A). The effect of each shRNA on cell proliferation was evaluated in a murine MLL-AF9/NrasG12D AML cell line (RN2) and in short-term cultures of normal myeloid progenitors isolated from mouse bone marrow (Figure 1A and S1B). While many shRNAs in this library suppressed proliferation of normal myeloid progenitors and AML cells with comparable efficiency (e.g. shRNAs targeting TAF2), three independent TAF12 shRNAs selectively blocked AML growth (Figure 1B and S1C–F). Western blotting and cDNA rescue experiments validated that this effect was a consequence of on-target TAF12 knockdown, which we estimate reduces TAF12 by ~5-fold (Figure 1C–E and S1G). Note, a retrovirally-expressed FLAG-TAF12 cDNA suppressed the accumulation of endogenous TAF12 (Figure 1D and S1H). The hypersensitivity of leukemia cells to TAF12 inhibition was also observed in methylcellulose-based media, in which TAF12 knockdown suppressed the blast/immature colony-forming potential of AML cells without influencing the colony-forming potential of normal myeloid progenitors (Figure 1F–G). Furthermore, TAF12 knockdown in AML cells resulted in a morphological transition and an immunophenotype (c-Kit down-regulation and Mac-1 up-regulation) suggestive of myeloid differentiation (Figure 1H–I and S1I). We also performed an analysis of TAF12 dependency in a panel of three murine and six human AML cell lines representing different genetic backgrounds, using shRNAs or CRISPR-based targeting, respectively. This revealed that multiple genetic subtypes of AML require TAF12 to proliferate (Figure 1J–L and Figure S1J–P). Expansion of pre-leukemic Dnmt3a−/− hematopoietic stem cells (HSCs) in liquid culture was sensitive to TAF12 knockdown, whereas these cells still formed myeloid colonies normally in methylcellulose-based media (Figure S1Q–R). In contrast, solid tumor-derived cell lines and immortalized fibroblasts were less sensitive to TAF12 knockdown (Figure 1M–Q and Figure S1P and S1S). These in vitro findings suggest that multiple genetic subtypes of AML are sensitive to targeting of TAF12.
Figure 1. A TFIID-focused shRNA screen reveals that acute myeloid leukemia cells are hypersensitive to TAF12 knockdown.

(A) Negative selection shRNA screening strategy. 86 shRNAs targeting 16 TFIID subunits were cloned into the MLS-E retroviral vector. The effect of individual shRNAs on cell proliferation was evaluated by measuring GFP depletion in a competition-based assay.
(B) Summary of shRNA screening results. The GFP depletion of shRNAs targeting TFIID subunits, a negative control shRNA targeting Renilla luciferase (shREN.713) and a positive control shRNA targeting RPA3 (shRPA3.457) is displayed. GFP depletion is plotted as a day 2 to day 12 ratio of GFP% for RN2 cells and a day 2 to day 8 ratio of GFP% for normal myeloid progenitors.
(C) Western blot analysis in RN2 cells and normal myeloid progenitor cultures on day 3 post infection with control or TAF12 shRNA (#364).
(D) Western blot analysis in RN2 cells transduced with FLAG-TAF12 cDNA or empty retroviral vector.
(E) TAF12 shRNA/cDNA rescue assay in RN2 cells. Retrovirally (MSCV) expressed FLAG-TAF12 cDNA is linked to GFP and retrovirally expressed shTAF12.364 is linked with mCherry. GFP/mCherry double positive cell depletion was measured to evaluate rescue. n=3.
(F) Bright-field images of methylcellulose-based colony formation assays in RN2 cells and normal myeloid progenitors on day 7 post viral transduction with control or TAF12 (#364) shRNAs. Scale bar represents 1 mm.
(G) Quantification of immature/blast colonies shown in (F). n=3.
(H) May-Grünwald Giemsa staining of RN2 cells on day 4 post infection with control or TAF12 shRNA (#364). Scale bar represents 10 μm.
(I) Flow cytometry analysis of RN2 cells stained with antibodies against c-Kit (surface marker of leukemia stem cells) and Mac-1 (surface marker of macrophage cells) on day 4 post infection with control or TAF12 (#364) shRNAs.
(J–Q) GFP depletion assays and western blot analysis in murine MLL-AF9/NrasG12D AML, i.e. RN2 (J), murine DNMT3AR882H/NRASG12D AML (K), murine NUP98-JARID1A AML
(L), murine NIH 3T3 fibroblast (M), murine B16-F10 melanoma cells (N), murine KrasG12D/p53−/− lung cancer cells (O), murine 4T1 breast cancer cells (P) and murine MycCaP prostate cancer cells (M) after retroviral transduction with control or TAF12 (#364) shRNAs. n=3.
All bar graphs represent the mean ±3SEM.
See also Figure S1.
Acute myeloid leukemia cells and normal lymphoid cells are hypersensitive to TAF12 knockdown in vivo
We next carried out in vivo mouse experiments to study the effect of TAF12 knockdown on AML expansion and on normal tissue maintenance. RN2 cells, which are Tet-on competent, were transduced with retroviral vectors that allow for doxycycline (dox)-inducible TAF12 or control shRNA expression (Figure S2A). Transduced cells were injected via tail vein into sublethally irradiated wild-type mice, followed by dox administration. We found that TAF12 knockdown inhibited AML expansion, as quantified with bioluminescent imaging, and led to a significant extension of animal survival (p=0.0067) (Figure 2A–C). CRISPR-based targeting of Taf12 also led to pronounced inhibition of AML progression in both the MLL-AF9/NrasG12D (RN2 cells) and DNMT3AR882H/NRASG12D engineered murine models of AML (Figure 2D–F and S2B–E). These experiments validate that TAF12 is required for AML expansion in vivo.
Figure 2. Evaluation of TAF12 knockdown in AML and normal tissues in vivo.

(A) Bioluminescent imaging of mice transplanted with RN2 cells transduced with doxycycline (dox) regulated shRNAs. Mice were injected with 500,000 RN2 cells and treated with dox on day 0 and imaged on day 7, 9 and 11 post transplantation. 4 or 5 mice were used for each cohort and representative images are shown.
(B) Quantification of bioluminescent imaging from (A). Values represent photons per second (p/s) of bioluminescent signal detection. p value was calculated using unpaired Student’s t-test. n=4–5.
(C) Survival curves of mice transplanted with RN2 cells transduced with the indicated dox-regulated shRNAs. p value was calculated using Log-rank (Mantel-Cox) test. n=4–5.
(D) Bioluminescent imaging of mice transplanted with DNMT3AR882H/NRASG12D AML cells transduced with CRISPR guide RNAs targeting a control region (sgROSA) or TAF12 (sgTAF12 #4.1). Mice were injected with 15,000 cells and imaged on day 8, 10 and 12 post transplantation. 4 or 5 mice were used for each cohort and representative images are shown.
(E) Quantification of bioluminescent imaging from (D). Values represent photons per second (p/s) of bioluminescent signal detection. Data are presented as mean ± SEM, n=4–5. p value was calculated using unpaired Student’s t-test.
(F) Survival curves of mice transplanted with DNMT3AR882H/NRASG12D AML cells transduced with indicated CRISPR guide RNAs (sgRNAs). p value was calculated using Log-rank (Mantel-Cox) test. 9–10 mice were used for each cohort.
(G) Transgenic shRNA expression strategy. TRE: Tetracycline response element; rtTA-M2: reverse tetracycline-controlled transactivator M2 variant. All mice evaluated were heterozygous for the shRNA cassette and homozygous for the rtTA-M2 transgene.
(H) Representative western blot analysis of whole tissue lysates prepared from mice treated with dox in the drinking water and chow for 4 weeks.
(I) Hematoxylin and eosin staining of tissues from mice treated with dox for 4 weeks. Scale bar represents 100 μm.
(J–K) Flow cytometry analysis of bone marrow (J) and spleen (K) stained with antibodies against the indicated cell surface markers from transgenic mice treated with dox in the drinking water and chow for 4 weeks. Gating was first performed on GFP+/shRNA+ cells, prior to measurement of marker staining. p value was calculated by unpaired Student’s t test, *p<0.05. n=3.
All bar graphs represent the mean ±3SEM.
See also Figure S2.
To determine the impact of TAF12 knockdown on normal mouse tissues, we generated dox-inducible TAF12 shRNA transgenic mice. A dox-regulated shRNA cassette linked to GFP was recombined into the Col1a1 locus of KH2 ES cells, which also possess a rtTA (Tet-on) transgene expressed from the Rosa26 promoter (Figure 2G). This system enables shRNA-mediated knockdown in a broad array of normal adult tissues (Bolden et al., 2014; Premsrirut et al., 2011; Wang et al., 2015). Six- to ten- week old animals harboring these alleles were administered dox to induce TAF12 or control shRNA expression for four weeks prior to tissue analysis. The broad expression pattern of GFP in dox-treated animals, together with western blotting of TAF12, confirmed effective knockdown in normal tissues, including bone marrow (Figure 2H and S2F–G). Despite this level of TAF12 knockdown, a comprehensive histological evaluation of these tissues failed to uncover any overt phenotypes, as determined by a pathologist (Figure 2I and S2H). In addition, the weight and overall appearance of TAF12 shRNA mice were indistinguishable from control animals (Figure S2I–J).
We next analyzed the relative abundance of different hematopoietic lineages in TAF12 shRNA mice using flow cytometry. By gating on the GFP+ (and therefore shRNA+) cell population, we identified a selective deficiency of B lymphoid cell populations in the bone marrow of TAF12 shRNA animals (Figure 2J). In peripheral blood and spleen sites, we observed a deficiency in both B- and T-lymphoid cells (Figure 2K and S2K). Importantly, we observed no reduction of myeloid cells in the bone marrow, spleen, or peripheral blood of TAF12-shRNA mice, which is in accord with our in vitro observations (Figure 2J–K and S2K). Early hematopoietic stem and progenitor cell populations (Lin−Sca1+Kit+) became expanded following TAF12 suppression, consistent with an enhanced serial replating of hematopoietic stem cells (HSCs) in vitro following TAF12 knockdown (Figure S2L–M). Upon removal of dox, lymphoid cell populations recovered, suggesting this defect is reversible upon restoring TAF12 function (Figure S2N). This analysis suggests that AML and normal B- and T-lymphoid cells are sensitive to TAF12 knockdown in vivo, whereas normal myeloid cells and other cell types can persist in a TAF12-suppressed state.
Overlapping transcriptional functions of TAF12 and MYB
We noted that the phenotype of TAF12 shRNA mice resembled prior observations in mice deficient for the hematopoietic TF MYB (Emambokus et al., 2003; Sandberg et al., 2005). While MYB is critical for normal hematopoiesis, several studies have shown that AML cells are more sensitive to MYB knockdown than normal myeloid progenitors (Anfossi et al., 1989; Calabretta et al., 1991; Zuber et al., 2011a). While there is some phenotypic heterogeneity among different alleles, mice with hypomorphic mutations of MYB are viable with intact myelopoiesis, enhanced HSC self-renewal, and impaired B and T lymphopoiesis (Carpinelli et al., 2004; Emambokus et al., 2003; Papathanasiou et al., 2010; Sandberg et al., 2005). We found that each of the TAF12-dependent murine AML cultures expressed MYB at high levels, which correlated with sensitivity to MYB knockdown, whereas the solid tumor-derived cell lines and immortalized fibroblasts expressed low levels of MYB and were less sensitive to knockdown (Figure 3A–I and S3A). This constellation of phenotypic similarities prompted us to investigate whether a functional connection exists between MYB and TAF12 in AML.
Figure 3. TAF12 is required to sustain the transcriptional output of MYB.

(A) RT-PCR analysis of Myb mRNA level in murine AML and non-AML cell lines. Measurements were normalized to Gapdh mRNA level. n=3.
(B–I) GFP depletion assays in the murine MLL-AF9/NrasG12D AML, i.e. RN2 (B), murine NUP98-JARID1A AML (C), murine DNMT3AR882H/NRASG12D AML (D), murine KrasG12D/p53−/− lung cancer cells (E), murine MycCap prostate cancer cells (F), murine 4T1 breast cancer cells (G), murine B16-F10 melanoma cells (H) and immortalized fibroblast iMEF (I) transduced with control (shREN) or MYB shRNAs. n=3.
(J–K) RNA-seq comparison of TAF12 knockdown to MYB (J) or MLL-AF9 (K) knockdown in RN2 cells. Scatter plot depicts the fold-change in RPKM values of 8,044 expressed genes (RPKM =5 in shREN samples) comparing two independent shRNAs targeting TAF12, MYB or MLL-AF9 to shREN.
(L) Unbiased Gene Set Enrichment Analysis (GSEA) of shTAF12 versus shREN in RN2 cells. Normalized enrichment score (NES) and family-wise error rate (FWER) p value were ranked and plotted for 13,321 genes sets, which include all of the Molecular Signature Database v5.1 (MSigDB) and a MYB gene signature, defined as the top 200 down-regulated genes upon MYB knockdown in RN2 cells. Each gene set is depicted as a single dot.
(M) GSEA plot of the murine MYB target gene signature upon TAF12 knockdown in RN2 cells.
(N) Unbiased GSEA analysis of sgTAF12 versus sgROSA in the human AML cell line MOLM-13, as described in (L), for evaluating the effects in the MSigDB gene sets and a MYB gene signature, defined as the top 200 down-regulated genes in MOLM-13 cells following sgRNA-mediated targeting of MYB.
(O) Heat map showing the relative MYB mRNA level of 173 AML patients samples in the TCGA database. Patients with relative high and low MYB level were defined by z score >0.5 and <−0.5, respectively.
(P–Q) GSEA analysis of patients with high versus low MYB level for evaluating the effects in the MYB-dependent (P) or TAF12-dependent (Q) gene signatures, defined as the top 200 down-regulated genes upon sgRNA-mediated targeting of MYB and TAF12 in MOLM-13 cells, respectively.
All bar graphs represent the mean ±3SEM.
See also Figure S3.
We first compared the global transcriptional effects of targeting MYB and TAF12 in RN2 cells using RNA-seq. Among the 8,044 expressed genes detected in this experiment, we observed a global positive correlation between gene expression changes following TAF12 and MYB knockdown (R2=0.4366, Figure 3J and S3B–D). To ensure that this was not a non-specific effect of targeting two essential genes, we compared the transcriptional effects of knocking down MLL-AF9 and TAF12 and found no correlation (R2=0.091, Figure 3K and S3E). Moreover, the effect of TAF12 knockdown on MYB target genes was stronger in magnitude than the effect on any of the 13,320 signatures in the Molecular Signatures Database (MSigDB v5.1) when interrogated via Gene Set Enrichment Analysis (GSEA) (Figure 3L) (Subramanian et al., 2005). While targeting BRD4 with JQ1 is also known to suppress MYB and other hematopoietic TFs function (Roe et al., 2015), TAF12 knockdown was more potent and selective in suppressing MYB relative to other hematopoietic TFs (e.g. PU.1) (Figure 3M and S3F). The effect of TAF12 knockdown on the expression of MYB target genes occurred without reducing Myb mRNA levels (Figure S3G), suggesting that MYB and TAF12 are linked at the protein level. A correlation between MYB- and TAF12-dependent transcriptional networks was also observed in the human AML cell line MOLM-13 and in human AML patient samples (Figure 3N–Q and Figure S3H–K). These findings suggest that TAF12 and MYB perform overlapping transcriptional functions in AML.
The MYB transactivation domain binds directly to the TAF12/TAF4 histone-fold domain heterodimer
The RNA-seq evaluation above led us to hypothesize that MYB uses TFIID as a coactivator in a TAF12-dependent manner. To evaluate this, we immunoprecipitated FLAG-MYB (full-length and a 1-327 fragment) in RN2 and HEK 293T nuclear extracts, which recovered endogenous TAF12 and other TFIID subunits (Figure 4A and S4A–B). Using a GST-pulldown assay, we found that the MYB transactivation domain (TAD) was sufficient for the association with TFIID (Figure 4B and S4C). In shRNA/cDNA rescue assays in RN2 cells, we observed that the TAD of MYB, but not the C-terminal half of the protein, is essential to support AML growth (Figure 4C–D and S4D).
Figure 4. Physical interaction between MYB and the TAF12/TAF4 heterodimer.

(A) IP-western blot analysis evaluating the interaction between FLAG-MYB and endogenous TFIID subunits. FLAG IP was performed in nuclear lysates from RN2 cells stably expressing FLAG tagged MYBFL(full-length), MYB1-327 fragment or empty vector followed by western blotting for the indicated TFIID subunits.
(B) Western blot analysis of TFIID subunits pulled down by recombinant GST or GST tagged transactivation domain (TAD) of MYB from RN2 nuclear lysates.
(C) Illustration of MYB domain architecture and fragments used for shRNA/cDNA rescue experiments. DBD: DNA-binding domain, TAD: transactivation domain, NRD: negative regulatory domain.
(D) GFP depletion assay evaluating the FLAG-MYB fragments shown in (C) to rescue the growth-arrest in RN2 cells caused by GFP-linked MYB shRNA (#2652). Bar graph represents the mean ±3SEM, n=3.
(E) Illustration of murine TAF12 and TAF4 domain architectures. Crystal structure represents the human TAF12/TAF4 histone-fold domain (HFD) heterodimer (PDB:1H3O) (Werten et al., 2002).
(F) GFP depletion assay evaluating the ability of full-length (FL) TAF12 versus the TAF12-HFD fragment (amino acids 50–130) to rescue the growth-arrest in RN2 cells caused by GFP-linked TAF12 shRNA (#364). Bar graph represents the mean ±3SEM, n=3.
(G) Illustration of MYB truncation fragments used for co-IP experiments.
(H) Co-IP western blot analysis evaluating the interaction between the indicated MYB fragments and the TAF4/TAF12 HFD heterodimer. HEK 293T cells were co-transfected with HA tagged TAF12, untagged TAF4-HFD, and one of the FLAG-MYB fragments shown in (G) or empty vector. FLAG IP was performed in nuclear lysates 48 hr post transfection.
(I) Silver staining analysis of the recombinant GST, GST tagged TAF12/TAF4 HFD heterodimer (purified from E. coli) and FLAG-MYB1-327 (purified from HEK 293T).
(J) Binding assay using the proteins shown in (I). GST proteins were immobilized on glutathione beads, followed by incubation with FLAG-MYB1-327. The bead-associated complexes were eluted and western blotted with anti-FLAG antibodies.
(K) Co-IP western blot analysis evaluating the interaction between MYB and TADA1/TAF12 or TAF4/TAF12 HFD heterodimer. HEK 293T cells were co-transfected with HA tagged TAF12-HFD, untagged TAF4-HFD or TADA1-HFD, and FLAG-MYB (FL or 1-327 fragment) or empty vector. FLAG IP was performed in nuclear lysates 48 hr post transfection.
(L) Mass spectrometry analysis of TFIID subunits following FLAG-TAF10 IP in RN2 cells expressing a dox-regulated TAF12 shRNA (#364) or control shRNA. Total peptide counts for the indicated subunits is shown, normalized to the control shRNA samples.
(M) Western blot analysis of the indicated TFIID subunits in RN2 cells on day 3 post infection of control or TAF12 (#364) shRNAs.
See also Figure S4.
TAF12 is an 18 kDa protein containing a single histone-fold domain (HFD), which dimerizes with the HFD of TAF4, to form a ‘handshake’ within the TFIID complex (Figure 4E) (Werten et al., 2002). Expression of a minimal 81 amino acid HFD fragment of TAF12 (lacking the N- and C-terminal regions) was sufficient to rescue the anti-AML phenotype caused by TAF12 shRNA (Figure 4F). This led us to consider whether the TAF12 HFD is involved in direct binding to MYB. While the TAF12-HFD alone was unstable when expressed in HEK 293T cells, this protein was stabilized upon co-expression with the TAF4-HFD, which together formed a stoichiometric heterodimer (Figure S4E). Using this expression system, we observed that the MYB TAD can efficiently co-immunoprecipitate the TAF12/TAF4 HFD dimer (Figure 4G–H). To confirm that the TAF12/TAF4 HFD dimer interaction with MYB occurs independently of other TFIID subunits, we reconstituted a TAF12/TAF4 HFD heterodimer in E. coli, an organism that lacks endogenous TFIID, and verified that this complex can bind to MYB1-327 (Figure 4I–J).
In addition to being a subunit of TFIID, TAF12 is also present in the SAGA complex, a finding we confirmed in RN2 cells using immunoprecipitation of FLAG-TAF12 coupled with mass spectrometry (IP-MS) analysis (Figure S4F–G) (Grant et al., 1998). In addition, the overall subunit composition of TFIID in RN2 is similar to that found in fibroblast cells, representing the canonical complex (Figure S4F–G). In SAGA, TAF12 forms a heterodimer with the histone-fold domain of TADA1 (Martinez et al., 2001). However, we found that a reconstituted TAF12/TADA1 complex failed to interact with MYB (Figure 4K and S4E). This suggests that TAF12 plays a role in linking MYB to TFIID, but not to SAGA. Consistent with this, the global gene expression changes observed following TAF12 knockdown more closely correlated with the effects of targeting TFIID-specific subunits than the effects of targeting a SAGA-specific subunit (Figure S4H–K). However, shRNA-based targeting of SAGA subunits suppressed RN2 cell growth, thus we cannot exclude the possibility that the essential function of TAF12 in AML occurs, at least in part, via its association with SAGA (Figure S4L–M).
Prior work in model organisms suggests a role for TAF12 in maintaining the integrity of TFIID complexes (Wright et al., 2006). By western blotting of whole cell lysates and IP-MS analysis of TFIID, we found that shRNA-based targeting of TAF12 disproportionately depletes this subunit relative to the other TAF subunits (Figure 4L–M). However, we found that TAF12 knockdown led to ~2-fold decrease in the level of intact TFIID complexes (Figure 4L). These findings suggest that ~5-fold knockdown of TAF12 causes a modest overall reduction of TFIID, with the residual complexes being deficient in TAF12 and potentially unable to support MYB function.
MYB recruits TAF12 to select cis-elements to support transcriptional activation
To further corroborate the link between TAF12 and MYB and evaluate the genomic regions in which their physical interaction is relevant, we performed chromatin immunoprecipitation experiments coupled with next-generation sequencing (ChIP-seq) in RN2 cells. We observed that 90% of all MYB peaks were overlapping with peaks of FLAG-TAF12, which occurred at both active promoters and distal regions harboring H3K27 acetylation and other TFIID subunits TAF2 and TAF10 (Figure 5A and S5A–C). In contrast, only 31% of FLAG-TAF12-occupied sites were occupied by MYB, in accordance with TAF12 being present in TFIID and SAGA complexes, which are each recruited broadly to active promoters and enhancers (Figure S5A) (Bonnet et al., 2014; Liu et al., 2011). We reasoned that if the TAF12-MYB interaction is functionally important, then knockdown of MYB should release TAF12 from select genomic sites. Indeed, among the 19,780 FLAG-TAF12 peaks in the genome, we found that only a subset was dependent on MYB to sustain full occupancy (Figure 5B). As examples, FLAG-TAF12 occupancy at the Ctsg, Myc and Prtn3/Elane loci was sensitive to MYB knockdown, whereas FLAG-TAF12 at the Slpi and Cebpe loci was unaffected (Figure 5C–D and Figure S5D–F). We validated this pattern of MYB-dependent and -independent TFIID occupancy using ChIP-qPCR measurements of TAF12, TAF2, and TAF10 (Figure 5E–F and S5G). Consistent with the findings described above, MYB knockdown had less of an effect on recruitment of the SAGA subunit KAT2A (Figure S5H). As a control, the total level of TAF12 protein was unaffected by MYB knockdown (Figure S5I).
Figure 5. MYB recruits TAF12 to select cis elements in AML cells to support transcriptional activation.

(A) ChIP-seq density plots of MYB, FLAG-TAF12, TAF2, TAF10, H3K27ac and H3K4me3 enrichment at MYB-occupied promoter and distal regions. MYB peaks located within −1 kb to +100 bp of transcription start site were defined as promoter regions, and others were defined as distal regions. Each row represents a 2 kb interval centered on the summit of each MYB peak and were ranked based on MYB ChIP-seq tag counts. FLAG-TAF12 ChIP-seq was performed in RN2 cells stably expressing FLAG tagged TAF12 following 24 hr dox-induced expression of control or MYB (#2652) shRNAs. TAF2 and TAF10 ChIP-seq were performed in parental RN2 cells. MYB, H3K27ac and H3K4me3 ChIP-seq data were from previous studies generated in parental RN2 cells (Roe et al., 2015; Shi et al., 2013).
(B) Global changes in FLAG-TAF12 enrichment following MYB knockdown. Fold-change in TAF12 tag counts for 19,780 TAF12 peaks in shMYB (#2652) versus shREN transduced RN2 cells are ranked and plotted. Examples of MYB dependent and independent peaks are indicated.
(C–D) ChIP-seq profiles of H3K27ac, MYB, TAF2 and FLAG-TAF12 at Ctsg (C), a genomic locus with MYB-dependent TAF12, and Slpi (D), a site with MYB-independent TAF12, in RN2 cells.
(E–F) ChIP-qPCR analysis of TAF12 (E) and TAF2 (F) at indicated MYB dependent and independent TAF12 loci following MYB knockdown. ChIP-qPCR was performed in RN2 cells following 24 hr dox-induced expression of control or MYB (#2652) shRNAs. Bar graphs represent the mean ±3SEM, n=3.
(G) GSEA analysis evaluating the expression of 326 expressed genes (RPMI =5) located nearest to the top 500 MYB-dependent TAF12 peaks following MYB or TAF12 knockdown.
(H) Transcription factor affinity prediction of the top 500 MYB-dependent TAF12 peaks versus 500 random TAF12 peaks. DNA sequences flanking 200 bp of each peak summit were used for motif analysis.
(I) Ontology analysis of genes located nearest to the top 500 MYB-dependent TAF12 peaks versus genes located nearest to 500 random TAF12 peaks using the Genomic Regions Enrichment of Annotations Tool (GREAT). In parentheses is the ontology identifier of each indicated pathway in the GREAT database.
See also Figure S5.
Genes located near MYB-dependent TAF12 peaks tend to be transcriptionally suppressed upon either MYB or TAF12 knockdown in the aforementioned RNA-seq evaluation (Figure 5G and S5J). When analyzing the sequence features of MYB-dependent TAF12 peaks, we found a deficiency of motifs recognized by PU.1 and C/EBPα at these elements, a pattern we confirmed with ChIP-seq data (Figure 5H and S5K). The lower abundance of these TFs may explain why MYB is the critical factor for TFIID recruitment at these elements to promote transcriptional activation. Ontology analysis revealed that this group of cis elements were associated with genes with functions related to leukemogenesis (Figure 5I). This epigenomic analysis suggests that MYB recruits TFIID to specific cis-elements to promote activation of genes that support AML maintenance.
TAF12 is required for MYB protein stability
As a control for the experiments described above, we evaluated whether TAF12 might act in a reciprocal manner to stabilize MYB occupancy on chromatin. Unexpectedly, we found that MYB was reduced at all genomic sites examined upon TAF12 knockdown, whereas occupancy of PU.1 was unaffected (Figure 6A and Figure S6A–B). This reduction of MYB occupancy was of a similar magnitude as the global reduction of total MYB protein detected via western blotting (Figure 6B–C). Since Myb mRNA levels were not reduced by TAF12 knockdown (Figure S3G), these results suggested that TAF12 has a role in stabilizing MYB protein. MG132 treatment, which inhibits proteasome-mediated protein degradation, partially restored MYB levels in TAF12-suppressed cells (Figure 6D). In addition, retroviral overexpression of MYB in RN2 cells was able to normalize MYB levels in TAF12 knockdown cells (Figure 6E), and led to a modest alleviation of the growth-arrest phenotypes caused by TAF12 shRNA (Figure 6F). However, the lack of complete rescue in this experiment indicates that stabilization of MYB is not the sole function of TAF12 in supporting AML growth. Taken together with the findings above, these experiments suggest that TAF12 supports MYB function through at least two distinct mechanisms: 1) by functioning as a coactivator to facilitate transcriptional activation and 2) by protecting MYB from degradation.
Figure 6. TAF12 protects MYB from proteasome-mediated degradation.

(A) MYB ChIP-qPCR analysis at indicated regions identified via MYB ChIP-seq in RN2 cells infected with control or TAF12 (#364) shRNAs on day 3 post infection. Bar graph represents the mean ±3SEM, n=3.
(B) Quantification of the relative MYB occupancy detected by ChIP-qPCR in (A). Data was normalized to shREN sample. Each dot represents individual locus tested in (A) and the error bar represents SD.
(C) Western blot analysis in RN2 cells infected with control or TAF12 (#364) shRNAs on day 3 post infection. Quantification of MYB bands with normalization to ACTIN bands was performed using ImageJ software.
(D) Western blot analysis of MYB protein level in RN2 cells following dox-regulated shRNA expression for 48 hr, followed by MG132 treatment for 4 hr. 1/2 shREN indicates a 2-fold dilution of shREN sample.
(E) Western blot analysis of MYB protein level in RN2 cells retrovirally co-transduced with the indicated cDNA and shRNA constructs.
(F) GFP depletion assay evaluating the effect of MYB overexpression on the growth-arrest caused by the GFP-linked TAF12 shRNA (#364) in RN2 cells. Data are plotted as the mean ±3SEM. * p<0.05 using unpaired Students’ t-test, n=3.
See also Figure S6.
Squelching of TAF12 leads to MYB suppression and anti-AML activity in vivo
Our genetic experiments implicate TAF12 as an opportunity for therapeutic intervention in AML, which allows for selective suppression of the MYB transcriptional network. To advance this concept, we sought a proof-of-principle experiment to determine whether blockade of TAF12 with a ligand can suppress MYB function and elicit anti-AML activity. We hypothesized that a minimal HFD fragment of TAF4 would be an ideal probe for blocking MYB function, since this peptide binds with high-affinity and specificity to the TAF12 HFD. Hence, a minimal TAF4-HFD would form an ineffective complex with TAF12 and MYB to interfere with the endogenous MYB-TFIID interaction, a mechanism known as squelching (Figure 7A) (Gill and Ptashne, 1988).
Figure 7. Squelching of TAF12 with a TAF4 HFD peptide leads to MYB suppression and anti-AML activity in vivo.

(A) Illustration of the TAF4-HFD based strategy for interfering with TAF12 and MYB function in AML.
(B) Western blot analysis of FLAG-TAF4-HFD expression in RN2 cells.
(C) GFP depletion assay evaluating the effect of retrovirally expressing the TAF4-HFD (linked to GFP) in RN2 cells. Prior to TAF4-HFD expression, RN2 cells were transduced with the TAF12 cDNA or empty vector.
(D) Bright-field images of methylcellulose-based colony formation assays in RN2 cells and normal myeloid progenitors expressing TAF4-HFD or empty vector on day 7 post viral transduction and day 5 post plating. Scale bar represents 1 mm.
(E) Quantification of immature/blast colonies in (D). Data are plotted as mean ±3SEM, n=3.
(F) May-Grünwald Giemsa staining of RN2 cells expressing the TAF4-HFD or empty vector (day 4 post infection). Scale bar represents 10 μm.
(G) Flow cytometry analysis of RN2 cells stained with antibodies against c-Kit and Mac-1 on day 4 post infection with TAF4-HFD or empty vector control.
(H) GSEA analysis of TAF4-HFD overexpression versus empty vector control in RN2 cells, evaluating effects on a MYB dependent gene signature, defined as the top 200 downregulated genes following MYB knockdown in RN2 cells.
(I–J) RNA-seq comparison of TAF4-HFD expression to TAF12 (I) or MYB (J) knockdown in RN2 cells. Scatter plot depicts the fold-change in RPKM values of 8,044 expressed genes (RPKM =5 in shREN) comparing two independent TAF12/MYB shRNAs or TAF4-HFD expression to control (shREN or empty vector, respectively).
(K) Bioluminescent imaging of mice transplanted with RN2 cells transduced with dox-regulated GFP-TAF4-HFD or GFP control. Mice were treated with dox in the drinking water and chow starting on day 9 and imaged on day 9, 11 and 13 following RN2 cells injection. 4 or 5 mice were used for each cohort.
(L) Quantification of bioluminescent imaging in (K). Values represent photons per second (p/s) of bioluminescent signal detection. p value was calculated using unpaired Student’s t-test. Data are plotted as mean ±3SEM, n=4–5.
(M) Survival curves of mice transplanted with RN2 cells transduced with dox-regulated GFP-TAF4-HFD or GFP. Mice were treated with dox in the drinking water and chow starting on day 9 following RN2 cell injection. p value was calculated by Log-rank (Mantel-Cox) test. n=4–5.
See also Figure S7.
Based on this rationale, we evaluated the phenotypic and transcriptional consequences of retroviral TAF4-HFD expression. Notably, expressing this peptide in RN2 cells led to a growth-arrest phenotype which could be rescued by overexpressing TAF12, consistent with a squelching mechanism (Figure 7B–C). Furthermore, TAF4-HFD expression led to an AML-specific inhibition of growth and blast colony formation, an induction of differentiation, and a destabilization of MYB protein, all consistent with inhibition of TAF12 (Figure 7D–G and Figure S7A–D). Ectopic expression of the TADA1 HFD did not cause any of these effects (data not shown). Using RNA-seq, we observed a close correspondence between the transcriptional effects of TAF4-HFD expression and TAF12 knockdown (R2=0.62), which included potent suppression of the MYB transcriptional network (Figure 7H–J and Figure S7E–F). Finally, we transduced RN2 cells with a dox-inducible TAF4-HFD retroviral vector, and carried out transplantation experiments to evaluate the effect of expressing this peptide on AML progression in vivo. These experiments revealed that inducing the TAF4-HFD led to marked AML regressions in vivo and extension of animal survival (p<0.0001; Figure 7K–M). Collectively, these findings suggest an anti-AML activity associated with peptide-based TAF12 blockade.
Discussion
While the entirety of TFIID and SAGA are broadly required for transcriptional activation (Baptista et al., 2017; Warfield et al., 2017), our study highlights how targeting a specific subunit of these complexes can lead to a selective transcriptional response that interferes with AML. We estimate that the level of TAF12 knockdown throughout our study is ~5-fold, which leads to a modest (~2-fold) reduction of intact TFIID in association with a disproportionate deficiency of TAF12 in the residual complexes. We have shown that this perturbation is well-tolerated by many normal cell types, suggesting that this perturbation does not impair global transcriptional functions of TFIID or SAGA. Instead, targeting of TAF12 selectively incurs phenotypes in the most MYB-dependent cell types: AML cells and the normal lymphoid cells. One avenue of future investigation will be to evaluate TAF12 as a transcriptional vulnerability in other cancer contexts in which MYB has a critical function. For example, chromosomal translocations in adenoid cystic carcinomas fuse MYB with NFIB to form a TF oncoprotein (Persson et al., 2009). Interestingly, MYB-NFIB fusions preserve the TAF12/TAF4 interaction surface we identify here, and hence may rely on TFIID for its carcinoma-promoting functions.
In human AML, MYB is rarely altered genetically but instead acts as a powerful dependency that functions downstream of other oncogenes (Pattabiraman and Gonda, 2013). One of the remarkable features of MYB is that a partial reduction of its expression can eradicate AML in mice, without impairing normal myelopoiesis (Zuber et al., 2011a). While MYB is an attractive target for therapy, the DNA-binding domain and TAD regions are challenging prospects for direct chemical inhibition based on structural considerations. We have previously shown that chemical inhibition of BRD4 with JQ1 interferes with the activation function of MYB (Bhagwat et al., 2016; Roe et al., 2015). However, a major obstacle in pursuing BRD4 as a target in AML, is that numerous other TFs are also functionally suppressed by JQ1 (Xu and Vakoc, 2017). In our efforts to directly compare TAF12 versus BRD4 targeting, we found that TAF12 perturbations achieve potent suppression of MYB, while preserving the function of other hematopoietic TFs.
The TAD of MYB has been shown to bind to multiple coactivators, including the KIX domain of the lysine acetyltransferases CBP/p300 (Oelgeschläger et al., 1996; Pattabiraman et al., 2014). Recent studies have described small-molecules that disrupt the MYB-p300 interaction, although these compounds lack potency and selectivity for this interaction (Uttarkar et al., 2016a; Uttarkar et al., 2016b). The TAF1 subunit of TFIID, although not a selective AML dependency like TAF12, contains two bromodomains that bind to acetylated lysine residues (Jacobson et al., 2000). Thus, TFIID and p300 might be coupled with one another at MYB binding sites through an acetylation-dependent interaction, which may cooperate with the direct TAF12-MYB interaction described here. One important avenue of future investigation will be to identify small-molecules or peptide-based strategies that achieve a complete blockade of the MYB TAD function, which may require co-targeting of CBP/p300 and TFIID interactions.
TAF9, TAF10, and TAF12 are unique among the TAF subunits in being shared by both TFIID and SAGA coactivator complexes (Grant et al., 1998; Timmers and Tora, 2005). While many of experiments throughout our study point to the transcriptional effects of TAF12 knockdown occurring via altered TFIID functions, we cannot rule out the involvement of SAGA in this process. Our shRNA targeting experiments indicate that SAGA, like TFIID, is essential in AML, with a subset of SAGA subunits (e.g. TAF5L) causing AML-specific growth arrest phenotypes. This raises the possibility that specific surfaces of SAGA engage in functional interactions with AML-promoting TFs, although our experiments exclude the role of a TAF12-MYB interaction in this context. SAGA contains both lysine acetyltransferase and ubiquitin protease activities, which could be targetable with small-molecules (Tzelepis et al., 2016; Weake and Workman, 2012). A worthwhile endeavor for future research will be to mechanistically characterize the AML-maintenance function of SAGA using similar genetic approaches we have used here to study TFIID.
The HFD is a common motif within TFIID, present on 9 different TAF subunits (Gupta et al., 2016). Unlike histones, the TAF HFDs lack positively charged residues that would be required to wrap DNA, and instead are used for inter-subunit interactions within the complex (Werten et al., 2002). While certain HFD TAFs can be reconstituted as an octamer in vitro, recent structural evidence suggests that individual TAF HFD heterodimers do not form an octamer but instead occupy distinct surface positions within TFIID, and hence are available for TF interactions (Louder et al., 2016; Selleck et al., 2001). Our finding that the TAF12/TAF4 HFD heterodimer provides a binding surface for the MYB TAD is not without precedent, as prior work had shown that TAF12 can also bind to the activation domains of GCN4, VP16, and HNF4A (Alpern et al., 2014; Hall and Struhl, 2002; Klein et al., 2003). Nevertheless, it is remarkable that MYB, relative to other TFs, is uniquely impaired upon depleting TAF12, which is likely to explain why many normal tissues can persist in TAF12-suppressed state. For this reason, TAF12 is an attractive therapeutic target in MYB-addicted malignancies, and our study highlights how a peptide-based squelching strategy could be used to exploit this transcriptional vulnerability.
STAR Methods
CONTACT FOR REAGENT AND RESOURCE SHARING
Further information and requests for resources and reagents should be directed to and will be fulfilled by the Lead Contact, Christopher Vakoc (vakoc@cshl.edu).
EXPERIMENTAL MODEL AND SUBJECT DETAILS
Mice
All animal procedures and studies were approved by the Cold Spring Harbor Laboratory Animal Care and Use Committee in accordance to IACUC. For TAF12 shRNA transgenic mice, TAF12 shRNA (#364) targeted ES cells were generated at Mirimus Inc (Cold Spring Harbor, NY). Specifically, a dox inducible promoter (TRE) driven TAF12 shRNA (#364) expression cassette was incorporated into the Col1a1 locus of KH2 ES cells, which already express the reverse tetracycline controlled transactivator (rtTA-M2) driven by endogenous Rosa26 promoter using site-specific integration (Premsrirut et al., 2011). The shRNA targeted ES cells were then used to derive chimera mice through blastocyst injection, performed at CSHL Gene Targeting Core facility. Chimera mice were backcrossed with C57BL/6 mice to obtain experimental mice homozygous for the rtTA locus and heterozygous for the shRNA locus. 6–10-week old female NSGS mice used for leukemia transplantation experiments were purchased from the Jackson Laboratory. 6–10-week old female C57BL/6 mice used for leukemia transplantation and deriving normal myeloid progenitors were purchased from Taconic Biosciences.
Cell lines
Murine MLL-AF9 / NrasG12D AML cells (RN2) were cultured in RPMI with 10% FBS; Murine DNMT3AR882H/NRASG12D and NUP98-JARID1A AML cells were cultured in Opti-MEM media with 15% FBS, 10 ng/ml SCF and 50 μM β-mercaptoethanol (Lu et al., 2016). All human AML cell lines were cultured in RPMI with 10% FBS, except for OCI-AML3 cells, which were cultured in alpha-MEM with 20% FBS. Murine KrasG12D/p53−/− lung cancer cells were cultured in RPMI with 10% FBS. NIH 3T3 immortalized fibroblast were cultured in DMEM with 10% bovine calf serum. B16-F10, 4T1, MycCaP, Neuro-2a, iMEF (SV40 larger T antigen immortalized MEFs, (Fellmann et al., 2011), Plat-E and HEK 293T were cultured in DMEM with 10% FBS. Penicillin/streptomycin were added to all cell culture. Plat-E and HEK 293T cells were used for packing retrovirus and lentivirus, respectively, using polyethylenimine (PEI)-mediated transfection. For culturing normal myeloid progenitor cells, bone marrow cells were flushed from the femurs of 6–10-week old C57BL/6 mice, lysed with ACK buffer (150 mM NH4Cl, 10 mM KHCO3, 0.1 mM EDTA), and cultured in RPMI with 10% FBS, 2 ng/ml rmIL-3, 2 ng/ml rmIL-6, 10 ng/ml rmSCF and 50 μM β-mercaptoethanol. Murine Dnmt3a−/− hematopoietic stem cells (HSCs) were cultured in Opti-MEM with 10% FBS, 50 ng/ml rmFlt3L, 10 ng/ml rhIL-6, 10 ng/ml rmIL-3 and 50 ng/ml rmSCF.
METHODS DETAILS
shRNA screen in leukemia and myeloid progenitors
shRNAs targeting 16 genes encoding TFIID subunits were cloned into the mirE-based retroviral shRNA expression vector MLS-E (Fellmann et al., 2013). RN2 cells were infected with retrovirus by centrifugation at 2280 rpm for 45 min in the presence of 4 μg/ml polybrene. Viral infection day was counted as day 0 and GFP% was measured on day 2, day 8 or day 12 post infection using a Guava Easycyte instrument (Millipore, Billerica, MA). GFP% fold-depletion was calculated as the ratio of day 2 to day 12 GFP%. A similar procedure was used for retroviral infection of normal myeloid progenitor cells, except that supplements (2 ng/ml rmIL-3, 2 ng/ml rmIL-6, 10 ng/ml rmSCF, 50 μM β-mercaptoethanol) were added to virus prior to infection. GFP fold-depletion was calculated as the ratio of day 2 to day 8 GFP&s#x00025;. shRNA sequences as well as the GFP fold-depletion can be found in Table S1.
CRISPR-based targeting in murine and human cells
For GFP depletion assays in human cancer cell lines, cells stably expressing Cas9 in LentiVpuro vector (Lenti-EFS-FLAG-Cas9-P2A-Puro) were infected with sgRNA in LRG (Lenti-U6-sgRNA-EFS-GFP) vector. GFP% was measured every other day from day 3 to day 13 post viral transduction.
For RNA-seq experiments following CRISPR based targeting of TAF12 and MYB in MOLM-13 cells, MOLM-13 cells stably expressing Cas9 in LentiVpuro vector were infected with control, TAF12 or MYB sgRNAs. GFP positive cells were FACS sorted on day 3 or day 4 post infection with MYB ot TAF12 sgRNAs, respectively and used for RNA-seq analysis.
For CRISPR based targeting of TAF12 in murine AML cells in vivo, please refer to in vivo leukemia transplantation section.
sgRNA sequences can be found in Table S1.
Colony formation assay in RN2 and normal myeloid progenitors
For shRNA-mediated knockdown experiments in RN2 and normal myeloid progenitors, cells were retrovirally infected with shRNA in LEP vector (LTR-miRE-shRNA-PGK-puro-IRES-GFP). On day 2 post viral infection, 2,500 GFP+ leukemia cells were plated into methylcellulose-based media without cytokines (MethoCult M3234) and 10,000 GFP+ normal myeloid progenitor cells were plated into methylcellulose-based media with cytokines (MethoCult GF M3434). For both experiments, 2 μg/ml puromycin was added to the media for selecting shRNA+ cells. On day5 post plating (day 7 post viral infection), blast-like colonies (poorly differentiated) were counted and representative pictures were taken. For TAF4-HFD overexpression experiments, PIG vector (MSCV-cDNA-PGK-puro-IRES-GFP) was used for expressing cDNA fragment and all other procedures were prepared as described above.
Colony formation assay and GFP depletion assay in murine HSCs
For colony formation assay in murine HSCs with serial replating, Sca-1+ bone marrow progenitors were magnetically enriched (Miltenyi microbeads and AutoMACS) from the bone marrow of mice treated with 150 mg/kg of 5-flurouracil 6 days prior to harvest. Sca-1+ cells were transduced with shRNA in MLS-E vector and 2 days later, 100 GFP+/Lineage−/Sca-1+/c-Kit+/CD48−/CD150+ HSCs were sorted per well for colony analysis. At the end of each round of plating, 5,000 GFP+ cells were re-sorted for the next passage.
For GFP depletion assay in murine Dnmt3a−/− HSCs, clonal Dnmt3a−/− HSCs were derived from single HSCs (Lineage− /Sca-1+/c-Kit+/CD48−/CD150+) from Vav-Cre:Dnmt3a(fl/fl) mice by passaging four times in Methocult M3434 media, followed by growth as suspension cells in liquid media, as described above. Cell lines derived from individual clones were transduced with the shRNA in MLS-E vector, and the proportion of GFP+ cells in the culture over time was determined by flow cytometry.
In vivo leukemia transplant
All animal procedures and studies were approved by the Cold Spring Harbor Laboratory Animal Care and Use committee in accordance to IACUC.
For conditional TAF12 shRNA experiments in vivo, RN2 cells which already carry reverse tetracycline-controlled transactivator (rtTA) were infected with shREN or shTAF12.364 in dox-regulated vector TRIN-E (TRE-mirE-shRNA-dsRED-PGK-Venus-IRES-NeoR), followed by G-418 selection (1 mg/ml). RN2 clones carrying dox-regulated shRNA were separated by serial dilution and validated through dox treatment followed by western blot analysis in vitro. 1 million clonal RN2 cells were transplanted into sub-lethally (5.5 Gy) irradiated C57BL/6 mice through tail vein injection. Freshly established leukemia cells harboring dox-inducible TAF12 shRNA were collected from the spleen of moribund mice. 500,000 leukemia cells were then transplanted into secondary recipients (sub-lethally irradiated C57BL/6 mice) by tail vein injection. Upon transplantation, dox was administrated to mice through drinking water (2 mg/ml with 2% sucrose) and chow (625 mg/kg).
For CRISPR-mediated targeting of TAF12 in RN2 cells in vivo, Cas9 expressing clonal RN2 line generated in a previous study (Shi et al., 2015) was infected with sgRNA in LRG vector (Lenti-U6-sgRNA-EFS-GFP). On day 2 post viral infection, 100,000 sorted GFP+ cells were injected to sub-lethally irradiated (2.5 Gy) NSGS mice through tail vein.
For CRISPR-mediated targeting of TAF12 in DNMT3AR882H/NRASG12D AML cells (Lu et al., 2016) in vivo, cells were first transduced with a Cas9 and Luciferase expressing cassette in Lenti-EFS-Cas9-P2A-Blast and Lenti-EFS-Luciferase-P2A-NeoR vectors respectively, followed by blasticidin (10 μg/ml) and G-418 (1mg/ml) selection and viral transduction with LRG-sgRNA vector. On day 3 post infection with sgRNA, 15,000 sorted GFP+ cells were injected to sublethally irradiated (2.5 Gy) NSGS mice. For biofluorescence imagining, mice were intraperitoneally (IP) injected with D-Luciferin (50 mg/kg) and analyzed using an IVIS Spectrum system (Caliper Life Sciences) 5 min post IP injection. For conditional TAF4-HFD expression in RN2 cells in vivo, RN2 cells were first transduced with TAF4-HFD in TtGNN vector (TREtight-NLS-GFP-cDNA-PGK-NeoR), followed by G-418 (1mg/ml) selection. RN2 clones were selected and injected into mice to derive fresh leukemia cells as described above. 500,000 freshly established leukemia cells carrying dox-regulated GFP or GFP-TAF4-HFD expression cassette were injected into sublethally irradiated C57BL/6 mice. On day 9 post transplantation, mice were treated with dox through drinking water (2 mg/ml dox with 2% sucrose) and chow (625 mg/kg).
Transgenic shRNA mice
All animal procedures and studies were approved by the Cold Spring Harbor Laboratory Animal Care and Use committee in accordance to IACUC. Transgenic dox-regulated shTAF12 and shREN mice were generated as described above. 6–10-week old mice (except for the experiment for characterizing LSK population, where the mice were ~24-week-old) homozygous for rtTA locus and heterozygous for shRNA locus were treated with dox through drinking water (2 mg/ml dox with 2% sucrose) and chow (625 mg/kg). After 4 weeks of dox administration, various tissues were collected and the following analysis was performed.
For immunochemistry analysis, tissues were fixed in 10% neutral buffered formalin at room temperature overnight and washed with PBS. Samples were then processed and subjected to H&E staining following standard protocol at the CSHL histology core facility.
For FACS analysis, femur, spleen and peripheral blood were collected from mice treated with dox for 4 weeks. A single cell suspension was prepared from the collected tissues and treated with ACK buffer. 1million cells were then stained with fluorescence conjugated antibodies against different hematopoietic lineage markers in FACS buffer (1× PBS with 5% FBS) for 1 hr at 4°C, followed by flow cytometry analysis using a BD LSRII analyzer. Gating was performed on live (FSC/SSC) and GFP positive cells prior to quantifying the marker positivity. Data analysis was performed using FlowJo software.
Cell lysate preparation for western blot analysis
For cell cultures, 2 million cells were resuspended in 50 μl of PBS and lysed with 50 μl of 2x Laemmli Sample Buffer supplemented with β-mercaptoethanol by boiling for 30 min. For preparing mice tissue lysates, tissues were harvested and lysed in RIPA buffer (25 mM Tris-HCl pH 7.6, 150 mM NaCl, 1% NP-40, 1% sodium deoxycholate and 0.1% SDS) supplemented with proteinase inhibitor using a dounce homogenizer, then sonicated for 1 min and incubated on ice for 15 min. The supernatant was collected and quantified using a Bradford assay.
RT-PCR
Total RNA was extracted using TRIzol following manufacture’s protocol. 2 μg total RNA was treated with DNaseI and reverse transcribed into cDNA using qScript cDNA SuperMix, followed by qPCR with SYBR green PCR master mix on an ABI 7900HT fast real-time PCR system.
RNA-seq library construction
RNA was extracted using TRIzol following manufacture’s protocol. 2 μg total RNA was used for constructing RNA-seq library using the Illumina TruSeq sample prep kit v2 following manufacture’s protocol. Briefly, RNA was polyA selected and enzymatically fragmented. cDNA was synthesized using Super Script II master mix, followed by end repair, A-tailing and PCR amplification. Library was single-end sequenced for 50 bp in HiSeq 2000 using V3 or V4 flow cell.
ChIP-qPCR
Cells were crosslinked in 1% formaldehyde at room temperature for 20 min and the reaction was quenched using 0.125M glycine. 10 million cells were incubated with cell lysis buffer (10 mM Tris pH8.0, 10 mM NaCl, 0.2% NP-40) and then resuspended and sonicated in 500 μl of nuclei lysis buffer (50 mM Tris pH8.0, 10 mM EDTA, 1% SDS) for 10 min using BioRuptor water bath sonicator (low, 30 s ON/OFF). For one IP, 250 μl of sonicated chromatin from 5 million cells were diluted with 3.75 ml IP-Dilution buffer (20 mM Tris pH 8.0, 2 mM EDTA, 150 mM NaCl, 1% Triton X-100, 0.01% SDS,) and incubated with 2 ug of appropriate antibody and 25 μl of magnetic beads (protein A beads for rabbit antibody, protein G beads for mouse antibody) at 4°C overnight. After washing once with IP-wash 1 buffer (20 mM Tris pH8.0, 2 mM EDTA, 50 mM NaCl, 1% Triton X-100, 0.1% SDS), twice with High-salt buffer (20 mM Tris pH 8.0, 2 mM EDTA, 500 mM NaCl, 1% Triton X-100, 0.01% SDS), once with IP-wash 2 buffer (10 mM Tris pH 8.0, 1 mM EDTA 0.25 M LiCl, 1% NP-40, 1% sodium deoxycholate), twice with TE buffer (10 Mm Tris-Cl, 1 Mm EDTA, pH 8.0), beads bound chromatin were eluted in 200 μl nuclei lysis buffer by heating at 65 °C for 15 min. 12 μl of 5 M NaCl was added to the 200 μl eluted chromatin, followed by incubation at 65°C overnight for reverse cross-linking. After reverse cross-linking, DNA was treated with RNaseA and proteinase K, followed by purification using QIAGEN PCR purification kit. qPCR was performed on ABI 7900HT Fast Real-Time PCR machine. ChIP-qPCR primers can be found in Table S1.
ChIP-seq library construction
ChIP was prepared as described above for ChIP-qPCR, except that the chromatin was sonicated for 15 min. ChIP DNA from 10 IPs were pooled together for one ChIP-seq library construction. ChIP-seq library was constructed using Illumina TruSeq ChIP Sample Prep kit following manufacture’s protocol. Briefly, ChIP DNA was end repaired, followed by A tailing and size selection (250–500 bp) by gel electrophoresis. 15 PCR cycles were used for final library amplification and the library was analyzed on a Bioanalyzer using a high sensitivity DNA chip (Agilent) on Bioanalyzer. Library was single-end sequenced for 50 bp on HiSeq 2000 using V3 or V4 flow cell.
Flow cytometry analysis for RN2 cells
On day 4 post viral infection with shRNA or cDNA expression vector, 1 million RN2 cells were collected and stained with APC conjugated c-Kit or Gr-1, PE conjugated Mac-1 antibodies in FACS buffer at 4°C for 1 hr. After two washes washing with FACS buffer, samples were analyzed on a BD LSRII analyzer and data analysis was performed using FlowJo software.
May-Grünwald Giemsa staining
5,000 RN2 cells resuspended in 100 μl FACS buffer were span onto slides using a Cytospin 2 Centrifuge at 500 rpm for 5 min and left to dry overnight. Slides were then stained in May-Grünwald solution for 7 min, followed by staining in Giemsa solutions for 15 min.
FLAG-TAF12 IP-MS analysis
Nuclear lysates were prepared from ~400 million RN2 or iMEF cells stably expressing 3*FLAG-TAF12 in PIG vector (MSCV-cDNA-PGK-puro-IRES-GFP) or RN2 cells stably expressing FLAG-TAF10 in PIG vector and transduced with dox-regulated shTAF12 or shREN 72 hr post dox (1 μg/ml) treatment. Briefly, cells were lysed in Buffer A (20 mM Tris-HCl pH 8.0, 1.5 mM MgCl2, 10 mM KCl, 1 mM Dithiothreitol (DTT), 15% Glycerol) for 15 min, followed by nuclear lysis in Buffer C (20 mM Tris-HCl pH 8.0, 1.5 mM MgCl2, 420 mM NaCl, 0.2 mM EDTA, 0.5 mM DTT, 15% Glycerol) for 1 hr. Nuclear lysates were diluted with no-salt Buffer C (20 mM Tris-HCl pH 8.0, 1.5 mM MgCl2, 0.2 mM EDTA, 1 mM DTT, 15% Glycerol) to 150 mM salt concentration and incubated with anti-FLAG M2 agarose at 4°C overnight. After washing with BC150 (20 mM Tris-HCl pH 8.0, 150 mM KCl, 0.5 mM EDTA, 1 mM DTT, 0.01% NP-40, 15% Glycerol) 8 times, beads bound protein were eluted with FLAG peptide (0.5 mg/ml). Elute from FLAG IP was then precipitated using trichloroacetic acid (TCA), washed with 10% TCA (once) and acetone (twice), followed by mass spectrometry analysis. All the mass spectrometry and data analysis were performed at Taplin Mass Spectrometry Facility at Harvard University.
FLAG IP in RN2 and HEK 293T cells
Nuclear lysates were prepared from RN2 cells stably expressing FLAG-MYB or HEK 293T cells transiently transfected with FLAG-MYB in PCDNA3 vector (48 hr post transfection), as described as above. 5 mg nuclear lysates were diluted with no-salt buffer to 60 mM salt concentration and incubated with FLAG M2 agarose overnight. After washing with BC60 (20 mM Tris-HCl pH 8.0, 60 mM KCl, 0.5 mM EDTA, 0.5 mM Dithiothreitol, 15% Glycerol) for 5 times, beads bound protein were eluted with FLAG peptide (0.5 mg/ml), followed by western blot analysis.
co-IP in HEK 293T cells
One 80% confluent 15-cm plate of 293T cells was transfected with 8 μg PCDNA3-HA-TAF12-HFD, 8 μg PCDNA3-TAF4-HFD or TADA1-HFD and 16 μg PCDNA3-FLAG-MYB fragments. 48 hr post transfection, nuclear lysates were prepared as described above and incubated with FLAG M2 agarose overnight (with final salt concentration at 150 mM). After washing with BC150 5 times, beads bound protein were eluted with FLAG peptide (0.5 mg/ml), followed by western blot analysis.
GST pulldown experiment
For GST and GST-TAD pulldown assays from RN2 nuclear lysates, GST and GST-TAD were first purified from BL21 E. coli cells with the following procedures. Protein expression in bacteria cells transformed with GST or GST-TAD in PGEX-4T1 vector was induced with 0.1 mM isopropyl β-D-1 thiogalactopyranoside (IPTG) at 17°C overnight. Cells were lysed n cell lysis buffer (20 mM Tris pH 8.0, 300 mM NaCl, 1 mM DTT, 1 mM EDTA, 10% Glycerol, 1 mM PMSF) through sonication (47% Amp, 3 s ON/12 s OFF, 3 min in total). The supernatant after sonication was incubated with glutathione agarose for 2 hr. After incubation, the protein bound agarose was washed with lysis buffer 5 times and twice with BC100. Equal amounts of GST and GST-TAD immortalized in glutathione agarose was then incubated with ~4 mg diluted RN2 nuclear lysates (~60 mM final salt concentration) overnight. After washing with BC60 5 times, beads bound protein was eluted by boiling, followed by western blot analysis. For GST pulldown experiments using GST and GST tagged TAF12-TAF4 HFD dimer, GST and GST tagged protein was purified as described above. FLAG-MYB1-327 was purified from HEK 293T cells 48 hr post transfection of FLAG-MYB1-327 in PCDNA3 vector through FLAG IP, following similar procedures as described above, except that extensive washing (Buffer C for 5 times) was applied. Equal amounts of GST or GST tagged HFD dimer immortalized agarose were incubated with FLAG-MYB1-327 for 4 hr. After washing with BC100 3 times, protein bound beads were eluted by boiling for 10 min, followed by Coomassie staining and western blot analysis.
MG132 treatment experiment
Clonal RN2 cells carrying dox-regulated TAF12 shRNA (#364) were generated as described above. Cells were treated with dox (1 μg/ml) for 48 hr, followed by treatment with 10 nM MG132. 4 hr post MG132 treatment, cells were harvested and whole cell lysates were prepared for western blot analysis of MYB.
RNA-seq data analysis
For RNA-seq in RN2 cells, single end 50 bp sequencing reads were mapped to the mm9 genome using TopHat (Kim et al., 2013). Structural RNA was masked and differentially expressed genes were identified using Cuffdiff (Kim et al., 2013; Trapnell et al., 2010). All the following analysis was performed on genes with RPKM value no less than 5 in control samples. For RNA-seq following shRNA-mediated knockdown in RN2 cells, fold-change in RPKM was calculated as the ratio of average RPKM of two independent hairpins (shTAF12.364/376; shMYB.2652/2572; shMLL-AF9.643/1039; shTADA1.1226/1580; shTAF2.1635/4392; shTAF4.2818/3818) to the average RPKM of two biological replicates of shREN. For RNA-seq following TAF4-HFD overexpression in RN2 cells, fold-change in RPKM was calculated as ratio of average RPKM of samples expressing TAF4-HFD and FLAG-TAF4-HFD to the average RPKM of two biological replicates of control samples (i.e. empty vector). The target signatures of hematopoietic TFs were defined as the top 200 downregulated genes following shRNA-mediated knockdown. RNA-seq data for defining CEBPB, FLI1, ERG and PU.1 signatures as well as JQ1 treatment were from a previous study (Roe et al., 2015). Pre-ranked gene set enrichment analysis (GSEA) was performed following standard procedure (Subramanian et al., 2005). For the GSEA analysis against Molecular Signature Database (MSigDB), additional gene sets including murine and human MYB signatures, murine PU.1, ERG, FLI1 and CEBPB signatures were incorporated into the online database v5.1 (Subramanian et al., 2005). Unsupervised hierarchical clustering and heat map of similarity matrix were generated in Morpheus from the Broad Institute.
For RNA-seq in human cells, the data analysis procedure is similar as described above, with the following differences. 1) hg19 genome was used for mapping sequencing reads. 2). sgMYB_e4.9 and sgMYB_e5.2 targeting the MYB DNA binding domain, sgTAF12_e4.1 and sgTAF12_4.4 targeting the TAF12 histone-fold domain were used for RNA-seq analysis in MOLM-13 cells.
ChIP-seq analysis
50 bp single end sequencing reads were mapped to mm9 genome using Bowtie with 2 mismatches allowed (Langmead et al., 2009). After removing PCR duplicates, MACS 1.4.2 was used to call peaks with input genomic DNA as control (Feng et al., 2012). ChIP-seq datasets generated in this study, together with H3K27ac, H3K4me3, MYB, CEBPB, PU.1 and FLI1 ChIP-seq datasets from previous studies (Roe et al., 2015; Shi et al., 2013) were used for the following analysis. Annotation of ChIP-seq peaks was performed using Homer v4.9 with default settings (Heinz et al., 2010).
For making heat map of density plot, density matrix was generated by mapping sequencing reads from each ChIP-seq experiment to the 200 20-bp bins around the summit of 6,879 MYB peaks ranked based on MYB ChIP-seq tag counts. TreeView software was used to generate the heat map from the density matrix (Saldanha, 2004).
For calculating fold-change of TAF12 tag counts following MYB knockdown, the following analysis was performed.
Define high confident TAF12 peaks as the overlapped intervals (more than 500 bp) between two biological repeats: FLAG-TAF12 ChIP-seq in RN2 cells and FLAG-TAF12 ChIP-seq in RN2 infected with control shRNA (i.e. shREN).
Normalization to total number of uniquely mapped reads was applied. Fold-change in TAF12 tag counts in shMYB versus shREN samples for each of the 19,780 intervals were then calculated, ranked and plotted.
For GSEA analysis, 326 nearest expressed genes (RPKM =5) were assigned to the top 500 most MYB dependent TAF12 intervals using Genomic Regions Enrichment of Annotations Tool (GREAT) (McLean et al., 2010). Gene ontology analysis was also performed using GREAT. For TRAP analysis (Thomas-Chollier et al., 2011), DNA sequences flanking 200 bp of each summit of the top 500 MYB dependent TAF12 peaks and 500 random TAF12 peaks were extracted from the mm9 genome and served as the input for motif analysis.
For meta profiling analysis of different hematopoietic TFs and histone modifications at top 500 MYB dependent TAF12 peaks and the 19,780 TAF12 peaks, density matrix around the peak summit was first generated as described above, and average tag counts of indicated group of peaks were then calculated and plotted.
BEDTools (Quinlan and Hall, 2010) and SAMtools (Li et al., 2009) were used during the course of the analysis.
QUANTIFICATION AND STATISTICAL ANALYSIS
All the statistics tests were performed using GraphPad PRISM6 software. For comparing survival curves, p value was calculated by Log-rank (Mantel-Cox) test. For other experiments, p value was calculated by unpaired Student’s t-test.
DATA AND SOFTWARE AVAILABILITY
The ChIP-seq and RNA-seq data from this study have been uploaded to GEO database with accession number GSE 104309.
Supplementary Material
Table S1. Related to STAR Methods
Significance.
Targeting of the epigenetic/chromatin/transcriptional regulatory machinery is an emerging therapeutic paradigm in leukemia and other malignancies, but such perturbations will usually influence a large number of transcriptional circuits in both normal and malignant cells. The limits of transcriptional selectivity for this therapeutic strategy are unknown. In this study, we identify a discrete perturbation of a general coactivator complex that selectively impairs the oncogenic transcription factor MYB. By disabling the capacity of this complex to support MYB function but preserving its global transcriptional function, this perturbation exerts potent anti-leukemia effects without harming normal tissues. These findings highlight a general strategy by which actionable surfaces of general coactivator complex can be identified for therapeutic development.
Highlights.
AML is hypersensitive the knockdown of TAF12, a subunit of TFIID/SAGA complexes
Normal tissues can persist in a TAF12-deficient state
A TAF12-TAF4 histone-fold heterodimer binds to the activation domain of MYB
Peptide-based squelching of TAF12/MYB leads to potent anti-leukemia effects
Acknowledgments
We would like to thank all members of the Vakoc laboratory for helpful discussions and suggestions throughout the course of this study. We thank Johannes Zuber for mir-E shRNA expression vectors and for shRNA designs, Robert Roeder for providing TAF antibodies, Gang Greg Wang for providing murine AML cell lines, CSHL Bioinformatics Shared Resource for providing Galaxy data analysis platform. This work was supported by Cold Spring Harbor Laboratory NCI Cancer Center Support grant CA455087 shared resource support. Additional funding was provided by the Alex’s Lemonade Stand Foundation, the Forbeck Foundation, the Pershing Square Sohn Cancer Research Alliance, and the V Foundation. C.R.V. is supported by a Burroughs-Wellcome Fund Career Award, National Institutes of Health grant NCI RO1 CA174793, NCI 5P01CA013106-Project 4, and a Leukemia & Lymphoma Society Scholar Award.
Footnotes
Author contributions
Y.X., C.R.V. designed experiments, analyzed data, and wrote the manuscript. J.E.W. analyzed the histological sections from transgenic shRNA mice. Y.X. performed most of the experiments. J.P.M performed tail vein injections, T.D.D.S. assisted with the analysis of human AML patient’s data, Y.T. performed the GFP depletion assay in human AML cells, Y.H. assisted with FLAG-TAF12 ChIP-seq library preparation. G.A.C and E.L.O. performed experiments in murine HSCs. C.R.V. supervised the research.
Publisher's Disclaimer: This is a PDF file of an unedited manuscript that has been accepted for publication. As a service to our customers we are providing this early version of the manuscript. The manuscript will undergo copyediting, typesetting, and review of the resulting proof before it is published in its final citable form. Please note that during the production process errors may be discovered which could affect the content, and all legal disclaimers that apply to the journal pertain.
References
- Alpern D, Langer D, Ballester B, Le Gras S, Romier C, Mengus G, Davidson I. TAF4, a subunit of transcription factor II D, directs promoter occupancy of nuclear receptor HNF4A during post-natal hepatocyte differentiation. eLife. 2014;3:e03613. doi: 10.7554/eLife.03613. [DOI] [PMC free article] [PubMed] [Google Scholar]
- Anfossi G, Gewirtz AM, Calabretta B. An oligomer complementary to c-myb-encoded mRNA inhibits proliferation of human myeloid leukemia cell lines. Proceedings of the National Academy of Sciences of the United States of America. 1989;86:3379–3383. doi: 10.1073/pnas.86.9.3379. [DOI] [PMC free article] [PubMed] [Google Scholar]
- Baptista T, Grünberg S, Minoungou N, Koster MJE, Timmers HTM, Hahn S, Devys D, Tora L. SAGA Is a General Cofactor for RNA Polymerase II Transcription. Molecular Cell. 2017;68:130–143. doi: 10.1016/j.molcel.2017.08.016. [DOI] [PMC free article] [PubMed] [Google Scholar]
- Bhagwat AS, Roe JS, Mok BA, Hohmann AF, Shi J, Vakoc CR. BET bromodomain inhibition releases the Mediator complex from select cis-regulatory elements. Cell reports. 2016;15:519–530. doi: 10.1016/j.celrep.2016.03.054. [DOI] [PMC free article] [PubMed] [Google Scholar]
- Bolden JE, Tasdemir N, Dow LE, van Es JH, Wilkinson JE, Zhao Z, Clevers H, Lowe SW. Inducible In Vivo Silencing of Brd4 Identifies Potential Toxicities of Sustained BET Protein Inhibition. Cell reports. 2014;8:1919–1929. doi: 10.1016/j.celrep.2014.08.025. [DOI] [PMC free article] [PubMed] [Google Scholar]
- Bonnet J, Wang CY, Baptista T, Vincent SD, Hsiao WC, Stierle M, Kao CF, Tora L, Devys D. The SAGA coactivator complex acts on the whole transcribed genome and is required for RNA polymerase II transcription. Genes & Development. 2014;28:1999–2012. doi: 10.1101/gad.250225.114. [DOI] [PMC free article] [PubMed] [Google Scholar]
- Brien Gerard L, Valerio Daria G, Armstrong Scott A. Exploiting the Epigenome to Control Cancer-Promoting Gene-Expression Programs. Cancer Cell. 2016;29:464–476. doi: 10.1016/j.ccell.2016.03.007. [DOI] [PMC free article] [PubMed] [Google Scholar]
- Burley SK, Roeder RG. Biochemistry and Structural Biology of Transcription Factor IID (TFIID) Annual Review of Biochemistry. 1996;65:769–799. doi: 10.1146/annurev.bi.65.070196.004005. [DOI] [PubMed] [Google Scholar]
- Calabretta B, Sims RB, Valtieri M, Caracciolo D, Szczylik C, Venturelli D, Ratajczak M, Beran M, Gewirtz AM. Normal and leukemic hematopoietic cells manifest differential sensitivity to inhibitory effects of c-myb antisense oligodeoxynucleotides: an in vitro study relevant to bone marrow purging. Proceedings of the National Academy of Sciences of the United States of America. 1991;88:2351–2355. doi: 10.1073/pnas.88.6.2351. [DOI] [PMC free article] [PubMed] [Google Scholar]
- Carpinelli MR, Hilton DJ, Metcalf D, Antonchuk JL, Hyland CD, Mifsud SL, Di Rago L, Hilton AA, Willson TA, Roberts AW, et al. Suppressor screen in Mpl−/− mice: c-Myb mutation causes supraphysiological production of platelets in the absence of thrombopoietin signaling. Proceedings of the National Academy of Sciences of the United States of America. 2004;101:6553–6558. doi: 10.1073/pnas.0401496101. [DOI] [PMC free article] [PubMed] [Google Scholar]
- Dawson MA, Prinjha RK, Dittmann A, Giotopoulos G, Bantscheff M, Chan WI, Robson SC, Chung C-w, Hopf C, Savitski MM, et al. Inhibition of BET recruitment to chromatin as an effective treatment for MLL-fusion leukaemia. Nature. 2011;478:529–533. doi: 10.1038/nature10509. [DOI] [PMC free article] [PubMed] [Google Scholar]
- Emambokus N, Vegiopoulos A, Harman B, Jenkinson E, Anderson G, Frampton J. Progression through key stages of haemopoiesis is dependent on distinct threshold levels of c-Myb. The EMBO Journal. 2003;22:4478–4488. doi: 10.1093/emboj/cdg434. [DOI] [PMC free article] [PubMed] [Google Scholar]
- Fellmann C, Hoffmann T, Sridhar V, Hopfgartner B, Muhar M, Roth M, Lai Dan Y, Barbosa Inês AM, Kwon Jung S, Guan Y, et al. An Optimized microRNA Backbone for Effective Single-Copy RNAi. Cell Reports. 2013;5:1704–1713. doi: 10.1016/j.celrep.2013.11.020. [DOI] [PubMed] [Google Scholar]
- Fellmann C, Zuber J, McJunkin K, Chang K, Malone CD, Dickins RA, Xu Q, Hengartner MO, Elledge SJ, Hannon GJ, Lowe SW. Functional identification of optimized RNAi triggers using a massively parallel Sensor assay. Molecular cell. 2011;41:733–746. doi: 10.1016/j.molcel.2011.02.008. [DOI] [PMC free article] [PubMed] [Google Scholar]
- Feng J, Liu T, Qin B, Zhang Y, Liu XS. Identifying ChIP-seq enrichment using MACS. Nat Protocols. 2012;7:1728–1740. doi: 10.1038/nprot.2012.101. [DOI] [PMC free article] [PubMed] [Google Scholar]
- Gill G, Ptashne M. Negative effect of the transcriptional activator GAL4. Nature. 1988;334:721–724. doi: 10.1038/334721a0. [DOI] [PubMed] [Google Scholar]
- Grant PA, Schieltz D, Pray-Grant MG, Steger DJ, Reese JC, Yates JR, III, Workman JL. A Subset of TAFIIs Are Integral Components of the SAGA Complex Required for Nucleosome Acetylation and Transcriptional Stimulation. Cell. 1998;94:45–53. doi: 10.1016/s0092-8674(00)81220-9. [DOI] [PubMed] [Google Scholar]
- Gupta K, Sari-Ak D, Haffke M, Trowitzsch S, Berger I. Zooming in on Transcription Preinitiation. Journal of Molecular Biology. 2016;428:2581–2591. doi: 10.1016/j.jmb.2016.04.003. [DOI] [PMC free article] [PubMed] [Google Scholar]
- Hall DB, Struhl K. The VP16 Activation Domain Interacts with Multiple Transcriptional Components as Determined by Protein-Protein Cross-linking in Vivo. Journal of Biological Chemistry. 2002;277:46043–46050. doi: 10.1074/jbc.M208911200. [DOI] [PubMed] [Google Scholar]
- Heinz S, Benner C, Spann N, Bertolino E, Lin YC, Laslo P, Cheng JX, Murre C, Singh H, Glass CK. Simple Combinations of Lineage-Determining Transcription Factors Prime cis-Regulatory Elements Required for Macrophage and B Cell Identities. Molecular Cell. 2010;38:576–589. doi: 10.1016/j.molcel.2010.05.004. [DOI] [PMC free article] [PubMed] [Google Scholar]
- Hohmann AF, Martin LJ, Minder JL, Roe JS, Shi J, Steurer S, Bader G, McConnell D, Pearson M, Gerstberger T, et al. Sensitivity and engineered resistance of myeloid leukemia cells to BRD9 inhibition. Nat Chem Biol. 2016;12:672–679. doi: 10.1038/nchembio.2115. [DOI] [PMC free article] [PubMed] [Google Scholar]
- Jacobson RH, Ladurner AG, King DS, Tjian R. Structure and Function of a Human TAFII250 Double Bromodomain Module. Science. 2000;288:1422–1425. doi: 10.1126/science.288.5470.1422. [DOI] [PubMed] [Google Scholar]
- Kim D, Pertea G, Trapnell C, Pimentel H, Kelley R, Salzberg SL. TopHat2: accurate alignment of transcriptomes in the presence of insertions, deletions and gene fusions. Genome Biology. 2013;14:R36. doi: 10.1186/gb-2013-14-4-r36. [DOI] [PMC free article] [PubMed] [Google Scholar]
- Klein J, Nolden M, Sanders SL, Kirchner J, Weil PA, Melcher K. Use of a Genetically Introduced Cross-linker to Identify Interaction Sites of Acidic Activators within Native Transcription Factor IID and SAGA. Journal of Biological Chemistry. 2003;278:6779–6786. doi: 10.1074/jbc.M212514200. [DOI] [PubMed] [Google Scholar]
- Krivtsov AV, Armstrong SA. MLL translocations, histone modifications and leukaemia stem-cell development. Nat Rev Cancer. 2007;7:823–833. doi: 10.1038/nrc2253. [DOI] [PubMed] [Google Scholar]
- Kwiatkowski N, Zhang T, Rahl PB, Abraham BJ, Reddy J, Ficarro SB, Dastur A, Amzallag A, Ramaswamy S, Tesar B, et al. Targeting transcription regulation in cancer with a covalent CDK7 inhibitor. Nature. 2014;511:616–620. doi: 10.1038/nature13393. [DOI] [PMC free article] [PubMed] [Google Scholar]
- Langmead B, Trapnell C, Pop M, Salzberg SL. Ultrafast and memory-efficient alignment of short DNA sequences to the human genome. Genome Biology. 2009;10:R25. doi: 10.1186/gb-2009-10-3-r25. [DOI] [PMC free article] [PubMed] [Google Scholar]
- Li H, Handsaker B, Wysoker A, Fennell T, Ruan J, Homer N, Marth G, Abecasis G, Durbin R Genome Project Data Processing S. The Sequence Alignment/Map format and SAMtools. Bioinformatics. 2009;25:2078–2079. doi: 10.1093/bioinformatics/btp352. [DOI] [PMC free article] [PubMed] [Google Scholar]
- Liu Z, Scannell Devin R, Eisen Michael B, Tjian R. Control of Embryonic Stem Cell Lineage Commitment by Core Promoter Factor, TAF3. Cell. 2011;146:720–731. doi: 10.1016/j.cell.2011.08.005. [DOI] [PMC free article] [PubMed] [Google Scholar]
- Lo-Coco F, Avvisati G, Vignetti M, Thiede C, Orlando SM, Iacobelli S, Ferrara F, Fazi P, Cicconi L, Di Bona E, et al. Retinoic Acid and Arsenic Trioxide for Acute Promyelocytic Leukemia. New England Journal of Medicine. 2013;369:111–121. doi: 10.1056/NEJMoa1300874. [DOI] [PubMed] [Google Scholar]
- Louder RK, He Y, López-Blanco JR, Fang J, Chacón P, Nogales E. Structure of promoter-bound TFIID and model of human pre-initiation complex assembly. Nature. 2016;531:604–609. doi: 10.1038/nature17394. [DOI] [PMC free article] [PubMed] [Google Scholar]
- Lu R, Wang P, Parton T, Zhou Y, Chrysovergis K, Rockowitz S, Chen WY, Abdel-Wahab O, Wade Paul A, Zheng D, Wang Gang G. Epigenetic Perturbations by Arg882-Mutated DNMT3A Potentiate Aberrant Stem Cell Gene-Expression Program and Acute Leukemia Development. Cancer Cell. 2016;30:92–107. doi: 10.1016/j.ccell.2016.05.008. [DOI] [PMC free article] [PubMed] [Google Scholar]
- Martinez E, Palhan VB, Tjernberg A, Lymar ES, Gamper AM, Kundu TK, Chait BT, Roeder RG. Human STAGA Complex Is a Chromatin-Acetylating Transcription Coactivator That Interacts with Pre-mRNA Splicing and DNA Damage-Binding Factors In Vivo. Molecular and Cellular Biology. 2001;21:6782–6795. doi: 10.1128/MCB.21.20.6782-6795.2001. [DOI] [PMC free article] [PubMed] [Google Scholar]
- McLean CY, Bristor D, Hiller M, Clarke SL, Schaar BT, Lowe CB, Wenger AM, Bejerano G. GREAT improves functional interpretation of cis-regulatory regions. Nat Biotech. 2010;28:495–501. doi: 10.1038/nbt.1630. [DOI] [PMC free article] [PubMed] [Google Scholar]
- Oelgeschläger M, Janknecht R, Krieg J, Schreek S, Lüscher B. Interaction of the co-activator CBP with Myb proteins: effects on Myb-specific transactivation and on the cooperativity with NF-M. The EMBO Journal. 1996;15:2771–2780. [PMC free article] [PubMed] [Google Scholar]
- Papadopoulos P, Gutiérrez L, Demmers J, Scheer E, Pourfarzad F, Papageorgiou DN, Karkoulia E, Strouboulis J, van de Werken HJG, van der Linden R, et al. TAF10 Interacts with the GATA1 Transcription Factor and Controls Mouse Erythropoiesis. Molecular and Cellular Biology. 2015;35:2103–2118. doi: 10.1128/MCB.01370-14. [DOI] [PMC free article] [PubMed] [Google Scholar]
- Papathanasiou P, Tunningley R, Pattabiraman DR, Ye P, Gonda TJ, Whittle B, Hamilton AE, Cridland SO, Lourie R, Perkins AC. A recessive screen for genes regulating hematopoietic stem cells. Blood. 2010;116:5849–5858. doi: 10.1182/blood-2010-04-269951. [DOI] [PubMed] [Google Scholar]
- Pattabiraman DR, Gonda TJ. Role and potential for therapeutic targeting of MYB in leukemia. Leukemia. 2013;27:269–277. doi: 10.1038/leu.2012.225. [DOI] [PubMed] [Google Scholar]
- Pattabiraman DR, McGirr C, Shakhbazov K, Barbier V, Krishnan K, Mukhopadhyay P, Hawthorne P, Trezise A, Ding J, Grimmond SM, et al. Interaction of c-Myb with p300 is required for the induction of acute myeloid leukemia (AML) by human AML oncogenes. Blood. 2014;123:2682–2690. doi: 10.1182/blood-2012-02-413187. [DOI] [PubMed] [Google Scholar]
- Pelish HE, Liau BB, Nitulescu II, Tangpeerachaikul A, Poss ZC, Da Silva DH, Caruso BT, Arefolov A, Fadeyi O, Christie AL, et al. Mediator kinase inhibition further activates super-enhancer-associated genes in AML. Nature. 2015;526:273–276. doi: 10.1038/nature14904. [DOI] [PMC free article] [PubMed] [Google Scholar]
- Persson M, Andrén Y, Mark J, Horlings HM, Persson F, Stenman G. Recurrent fusion of MYB and NFIB transcription factor genes in carcinomas of the breast and head and neck. Proceedings of the National Academy of Sciences of the United States of America. 2009;106:18740–18744. doi: 10.1073/pnas.0909114106. [DOI] [PMC free article] [PubMed] [Google Scholar]
- Premsrirut PK, Dow LE, Kim SY, Camiolo M, Malone CD, Miething C, Scuoppo C, Zuber J, Dickins RA, Kogan SC, et al. A rapid and scalable system for studying gene function in mice using conditional RNA interference. Cell. 2011;145:145–158. doi: 10.1016/j.cell.2011.03.012. [DOI] [PMC free article] [PubMed] [Google Scholar]
- Quinlan AR, Hall IM. BEDTools: a flexible suite of utilities for comparing genomic features. Bioinformatics. 2010;26:841–842. doi: 10.1093/bioinformatics/btq033. [DOI] [PMC free article] [PubMed] [Google Scholar]
- Roe JS, Mercan F, Rivera K, Pappin Darryl J, Vakoc Christopher R. BET Bromodomain Inhibition Suppresses the Function of Hematopoietic Transcription Factors in Acute Myeloid Leukemia. Molecular Cell. 2015;58:1028–1039. doi: 10.1016/j.molcel.2015.04.011. [DOI] [PMC free article] [PubMed] [Google Scholar]
- Saldanha AJ. Java Treeview—extensible visualization of microarray data. Bioinformatics. 2004;20:3246–3248. doi: 10.1093/bioinformatics/bth349. [DOI] [PubMed] [Google Scholar]
- Sandberg ML, Sutton SE, Pletcher MT, Wiltshire T, Tarantino LM, Hogenesch JB, Cooke MP. c-Myb and p300 Regulate Hematopoietic Stem Cell Proliferation and Differentiation. Developmental Cell. 2005;8:153–166. doi: 10.1016/j.devcel.2004.12.015. [DOI] [PubMed] [Google Scholar]
- Selleck W, Howley R, Fang Q, Podolny V, Fried MG, Buratowski S, Tan S. A histone fold TAF octamer within the yeast TFIID transcriptional coactivator. Nat Struct Mol Biol. 2001;8:695–700. doi: 10.1038/90408. [DOI] [PubMed] [Google Scholar]
- Shi J, Vakoc Christopher R. The Mechanisms behind the Therapeutic Activity of BET Bromodomain Inhibition. Molecular Cell. 2014;54:728–736. doi: 10.1016/j.molcel.2014.05.016. [DOI] [PMC free article] [PubMed] [Google Scholar]
- Shi J, Wang E, Milazzo JP, Wang Z, Kinney JB, Vakoc CR. Discovery of cancer drug targets by CRISPR-Cas9 screening of protein domains. Nat Biotech. 2015;33:661–667. doi: 10.1038/nbt.3235. [DOI] [PMC free article] [PubMed] [Google Scholar]
- Shi J, Whyte WA, Zepeda-Mendoza CJ, Milazzo JP, Shen C, Roe JS, Minder JL, Mercan F, Wang E, Eckersley-Maslin MA, et al. Role of SWI/SNF in acute leukemia maintenance and enhancer-mediated Myc regulation. Genes & Development. 2013;27:2648–2662. doi: 10.1101/gad.232710.113. [DOI] [PMC free article] [PubMed] [Google Scholar]
- Subramanian A, Tamayo P, Mootha VK, Mukherjee S, Ebert BL, Gillette MA, Paulovich A, Pomeroy SL, Golub TR, Lander ES, Mesirov JP. Gene set enrichment analysis: A knowledge-based approach for interpreting genome-wide expression profiles. Proceedings of the National Academy of Sciences. 2005;102:15545–15550. doi: 10.1073/pnas.0506580102. [DOI] [PMC free article] [PubMed] [Google Scholar]
- Thomas-Chollier M, Hufton A, Heinig M, O'Keeffe S, Masri NE, Roider HG, Manke T, Vingron M. Transcription factor binding predictions using TRAP for the analysis of ChIP-seq data and regulatory SNPs. Nat Protocols. 2011;6:1860–1869. doi: 10.1038/nprot.2011.409. [DOI] [PubMed] [Google Scholar]
- Timmers HTM, Tora L. SAGA unveiled. Trends in Biochemical Sciences. 2005;30:7–10. doi: 10.1016/j.tibs.2004.11.007. [DOI] [PubMed] [Google Scholar]
- Trapnell C, Williams BA, Pertea G, Mortazavi A, Kwan G, van Baren MJ, Salzberg SL, Wold BJ, Pachter L. Transcript assembly and quantification by RNA-Seq reveals unannotated transcripts and isoform switching during cell differentiation. Nat Biotech. 2010;28:511–515. doi: 10.1038/nbt.1621. [DOI] [PMC free article] [PubMed] [Google Scholar]
- Tzelepis K, Koike-Yusa H, De Braekeleer E, Li Y, Metzakopian E, Dovey Oliver M, Mupo A, Grinkevich V, Li M, Mazan M, et al. A CRISPR Dropout Screen Identifies Genetic Vulnerabilities and Therapeutic Targets in Acute Myeloid Leukemia. Cell Reports. 2016;17:1193–1205. doi: 10.1016/j.celrep.2016.09.079. [DOI] [PMC free article] [PubMed] [Google Scholar]
- Uttarkar S, Dassé E, Coulibaly A, Steinmann S, Jakobs A, Schomburg C, Trentmann A, Jose J, Schlenke P, Berdel WE, et al. Targeting acute myeloid leukemia with a small molecule inhibitor of the Myb/p300 interaction. Blood. 2016a;127:1173–1182. doi: 10.1182/blood-2015-09-668632. [DOI] [PubMed] [Google Scholar]
- Uttarkar S, Piontek T, Dukare S, Schomburg C, Schlenke P, Berdel WE, Müller-Tidow C, Schmidt TJ, Klempnauer KH. Small-Molecule Disruption of the Myb/p300 Cooperation Targets Acute Myeloid Leukemia Cells. Molecular Cancer Therapeutics. 2016b;15:2905–2915. doi: 10.1158/1535-7163.MCT-16-0185. [DOI] [PubMed] [Google Scholar]
- Wang E, Kawaoka S, Roe JS, Shi J, Hohmann AF, Xu Y, Bhagwat AS, Suzuki Y, Kinney JB, Vakoc CR. The transcriptional cofactor TRIM33 prevents apoptosis in B lymphoblastic leukemia by deactivating a single enhancer. eLife. 2015;4:e06377. doi: 10.7554/eLife.06377. [DOI] [PMC free article] [PubMed] [Google Scholar]
- Warfield L, Ramachandran S, Baptista T, Devys D, Tora L, Hahn S. Transcription of Nearly All Yeast RNA Polymerase II-Transcribed Genes Is Dependent on Transcription Factor TFIID. Molecular Cell. 2017;68:118–129. doi: 10.1016/j.molcel.2017.08.014. [DOI] [PMC free article] [PubMed] [Google Scholar]
- Weake VM, Workman JL. SAGA function in tissue-specific gene expression. Trends in Cell Biology. 2012;22:177–184. doi: 10.1016/j.tcb.2011.11.005. [DOI] [PMC free article] [PubMed] [Google Scholar]
- Werten S, Mitschler A, Romier C, Gangloff YG, Thuault S, Davidson I, Moras D. Crystal Structure of a Subcomplex of Human Transcription Factor TFIID Formed by TATA Binding Protein-associated Factors hTAF4 (hTAFII135) and hTAF12 (hTAFII20) Journal of Biological Chemistry. 2002;277:45502–45509. doi: 10.1074/jbc.M206587200. [DOI] [PubMed] [Google Scholar]
- Wright KJ, Marr MT, Tjian R. TAF4 nucleates a core subcomplex of TFIID and mediates activated transcription from a TATA-less promoter. Proceedings of the National Academy of Sciences. 2006;103:12347–12352. doi: 10.1073/pnas.0605499103. [DOI] [PMC free article] [PubMed] [Google Scholar]
- Xu Y, Vakoc CR. Targeting Cancer Cells with BET Bromodomain Inhibitors. Cold Spring Harbor Perspectives in Medicine. 2017:7. doi: 10.1101/cshperspect.a026674. [DOI] [PMC free article] [PubMed] [Google Scholar]
- Zuber J, Rappaport AR, Luo W, Wang E, Chen C, Vaseva AV, Shi J, Weissmueller S, Fellman C, Taylor MJ, et al. An integrated approach to dissecting oncogene addiction implicates a Myb-coordinated self-renewal program as essential for leukemia maintenance. Genes & Development. 2011a;25:1628–1640. doi: 10.1101/gad.17269211. [DOI] [PMC free article] [PubMed] [Google Scholar]
- Zuber J, Shi J, Wang E, Rappaport AR, Herrmann H, Sison EA, Magoon D, Qi J, Blatt K, Wunderlich M, et al. RNAi screen identifies Brd4 as a therapeutic target in acute myeloid leukaemia. Nature. 2011b;478:524–528. doi: 10.1038/nature10334. [DOI] [PMC free article] [PubMed] [Google Scholar]
Associated Data
This section collects any data citations, data availability statements, or supplementary materials included in this article.
Supplementary Materials
Table S1. Related to STAR Methods