

Abstract
Strategies to replace retinal photoreceptors lost to damage or disease rely upon the migration of replacement cells transplanted into sub-retinal spaces. A significant obstacle to the advancement of cell transplantation for retinal repair is the limited migration of transplanted cells into host retina. In this work, we examine the adhesion and displacement responses of retinal progenitor cells on extracellular matrix substrates found in retina as well as widely used in the design and preparation of transplantable scaffolds. The data illustrate that retinal progenitor cells exhibit unique adhesive and displacement dynamics in response to poly-l-lysine, fibronectin, laminin, hyaluronic acid, and Matrigel. These findings suggest that transplantable biomaterials can be designed to improve cell integration by incorporating extracellular matrix substrates that affect the migratory behaviors of replacement cells.
Keywords: Neuroclusters, migration, microfluidics, photoreceptors, transplantation
Introduction
Specialized biomaterials1–3 have been used in conjunction with extracellular matrix (ECM) proteins to introduce a variety of replacement cell types4–7 into damaged and/or injured retina8,9 via transplantation therapy. The microenvironments within such transplantable biomaterials provide structural and chemical cues that influence nearly all aspects of the cells that populate them, including de/differentiation,10 migration,11 intercellular connectivity,12 and long-term survival.13 Reported advancements14 in the survival and integration of transplanted photoreceptor progenitors have inspired dramatic innovation in contemporary transplantation strategies, including elastomeric grafts15 and protein-coated, electrospun fibers,16 whose properties mimic in vivo cues affecting cell fate, behavior, and response in host retina.17,18
A significant, but largely understudied, group of physical cues guiding biomaterial design for retinal transplantation are those which support and/or influence the migratory behavior of transplantable cells. This is surprising because the migration of transplanted cells is fundamental to cellular and synaptic integration within host retina. As illustrated in Figure 1, cells transplanted into the sub-retinal space must exit the biomaterial and navigate the complex retinal architecture via the outer nuclear layer in order to connect with neuronal targets of the host.8,19 Few studies have explored how properties of biomaterials affect outward cell migration into host retinal laminae. Such migration processes are complex because they include movement of individual cells as well as the collective migration of neuroclusters. Collective behaviors of transplanted cells are particularly important because donor cells are explicitly derived to mimic earlier developmental states, where cells largely interact as neuroclusters.20,21 The mechanisms of collective cell adhesion and migration are also acutely affected by factors such as population density and interstitial interactions,20 both of which are routinely altered in order to increase the integration of transplanted cells.22,23
Figure 1.

Cell-seeded biomaterials in photoreceptor transplantation. Retinal progenitor cells (RPCs) are embedded within biomaterials and transplanted into the sub-retinal space in the eye posterior. Viable cells exit the biomaterial and navigate into and within the host outer nuclear layer to achieve synaptic integration with neuronal targets.
Our group has previously evaluated the collective11,24 and individual25–27 migration of retinal progenitor cells (RPCs) and photoreceptor precursor cells (PPCs) toward ligand gradients derived from light-damaged retina. In this article, we quantify the clustering, adhesion, and displacement of RPCs in response to four ECM substrates present in developing and mature retina, and/or used extensively in the development and testing of transplantable biomaterials as described in Table 1: fibronectin (FN),28–30 laminin (LM),15,31–34 hyaluronic acid (HA),35–40 and Matrigel (MG).41–45,51 RPC behavior upon these substrates was also compared against poly-l-lysine (PLL).46–50 This study also incorporated controlled microfluidic systems to evaluate behaviors of individual and clustered RPCs at the microscale, comparable to the sub-retinal spaces that replacement cells encounter during transplantation. Results illustrate that ECM substrates affected the size of individually adhered cells, the ratio of collectively to individually adhered cells and the displacements of both. These data suggest that ECM substrates used in cell replacement strategies affect cell migration in specific ways that should be considered in the development of enriched biomaterials for retinal transplantation.
Table 1.
Extracellular matrix (ECM) compounds selected: a summary of significant ECM properties and their recent applications in vitro and in vivo.
| Substrate | Biochemistry | In vivo significance | In vitro systems | Biomaterials and transplantation |
|---|---|---|---|---|
| Fibronectin (FN) | 230–270 kDa glycoprotein | Component of vascular basement membrane and retinal pigment epithelium (RPE)28 | Enhanced cell adhesion of cultured retinal cells29 | Injectable cell delivery for retinal transplantation30 |
| Laminin (LM) | 400–900 kDa glycoprotein | Major component of retinal laminae31 | Testing of scaffold polymer-blended materials for photoreceptors32 | Transplanted retinal sheets of stem cells33
Coatings on transplantable elastomeric membranes15 Transplanted electrospun nanofiber meshes34 |
| Hyaluronic acid (HA) | 106 Da Linear polysaccharide | Principal component of interphotoreceptor matrix (IPM)35,36 | Component of biomimetic hydrogels37 | Transplantable material from de-cellularized retina38
Injectable hydrogels39,40 |
| Matrigel (MG) | Trade name for pmixture secreted by Engelbreth-Holm-Swarm (EHS) mouse sarcoma | Evaluated angiogenic compounds41
Injected in rabbit retinas for vascularization42 |
Tested photoreceptor morphology prior to transplantation43
Comparison for 3D transplant scaffolds44 Examined stem cell differentiation prior to transplantation45 |
Stem cell culture to achieve desired morphology prior to retinal transplantation45 |
| Poly-l-lysine (PLL) | Synthetic polymer that enhances electrostatic interactions | Used for nanoparticle delivery in retina46 | Constituent of tunable retinal hydrogels47,48 | Coating for implants used in rat optic tract49
Sub-macular injection in rat50 |
Methods and materials
Cell isolation and culture
Mouse RPCs were isolated from dissociated retinas of post-natal (P4) C57BL/6J mice, homozygous for expression of enhanced green fluorescent protein under control of the beta actin promoter (EGFP+/+) (gift from Dr Young, Harvard University52). RPCs were expanded and maintained at 37°C in a 5% CO2 incubator in neurobasal complete medium (Invitrogen-Gibco, Rockville, MD) containing 2 mM l-glutamine, 100 mg/mL penicillin-streptomycin, B27 and N2 neural supplements, and 20 ng/mL epidermal growth factor (Promega, Madison, WI) as described previously by our group.11,27 For testing, cells were detached with trypsin-EDTA, re-suspected in culture medium, counted, and seeded as described below.
ECM substrates
Mouse laminin (LM, Sigma-Aldrich, St. Louis, MO) and human fibronectin (FN, Thermo fischer, Waltham, MA) were dissolved and diluted to 10 μg/mL and 100 μg/mL, respectively, in phosphate-buffered saline (PBS). Growth factor-reduced MG (BD Biosciences, Franklin Lakes, NJ) was diluted to 100 μg/mL in PBS. HA (Alfa Aesar, Ward Hill, MA) was added to PBS at 30 mg/mL with thorough sonication and allowed to dissolve for 24 h at room temperature. PLL53 was used as a control substrate. Wells were coated with a 15 ng/mL solution in PBS at 5°C overnight and left to air dry in a laminar flow hood for 1 h prior to study. Surfaces of 12-well culture plates (VWR International, Bridgeport, NJ) were functionalized with a 1 mL volume of LM, FN, or MG per well and 0.5 mL of HA for 1 h. All wells were washed afterward with 1 mL of PBS. Substrates were functionalized at room temperature (25°C) for all solutions except LM, which was performed on ice as per vendor protocols. All wells were used on the day of surface functionalization.
Morphology and adhesion density of individual RPCs
RPCs were plated at (1) low cell density of 104 cells/well; (2) moderate, but sub-confluent, density of 105 cells/well; and (3) high cell density of 106 cells/well that approached confluence in 12 well plates (~1 mL/well). The size and morphology of individually adhered cells were evaluated using the cell shape index, CSI, defined in equation (1) as a dimensionless parameter that quantitatively represents cell asymmetry54–56
| (1) |
where AS represents the surface area of individually adhered cells and P represents the cell perimeter. Values of CSI range from 1.0 for an idealized circular shape to 0.0 for cells that exhibit a perfectly linear elongation, as shown in the schematic of Figure 2. In this study, individual cells (i.e., not part of a neurocluster) were defined as those whose contact with neighboring cells was limited to either (1) extended, continuous interfacial contact with a single cell along the plasma membrane (e.g., daughter cells following mitosis) or (2) discrete point contacts via processes or extensions with one or more other cells. In addition, the average cell density of individually adhered cells was quantitatively represented by the cell adhesion density, πADH, defined in equation (2)
Figure 2.

Morphology of adhered cells. Schematic representation of different cell morphologies with corresponding values of cell shape index (CSI): (a) idealized circular cell (CSI = 1.0), (b) typical rounded cell (CSI = 0.9), (c) typical elongated cell with process extensions (CSI = 0.3), and (d) idealized linearly elongated cell (CSI = 0). Cell clusters were defined as (e, f) groups of three or more cells in direct and continuous interfacial contact along common plasma membranes. (g, h) Cells in direct contact with neighbors along only one interface or extension were not evaluated as clusters.
| (2) |
where ASC denotes the area of individually adhered cells within a substrate region of interest, i, and ASA,i denotes the surface area of that region of interest.
Mean size and adhesion ratio of retinal neuroclusters
Retinal neuroclusters were defined as groups of three or more cells with continuous and extended interfacial contact along their plasma membranes,24 as described per Figure 2. The mean size of each neurocluster, , was measured using its projected substrate surface area. The ratio of neuroclusters to individually adhered cells was assessed via a parameter called the adhesion ratio, RADH, defined in equation (3)
| (3) |
where ANC is the projected surface area of adhered neuroclusters within a substrate region and ASC represents the total surface area of singly adhered cells. In this way, RADH denotes the percentage of total cell-adhered surfaces that contain neuroclusters.
Expression of adhesion receptors
Expression levels of four genes encoding adhesion receptors were measured using quantitative polymerase chain reaction (qPCR) for integrin α3, integrin α7, integrin β3, and the adhesion molecule CD44 with primers shown in Table 2. Primer specificity was verified using Basic Local Alignment Search Tool (BLAST), which confirmed the selected forward and reverse primers listed. RNA was isolated from cells using Trizol (Sigma-Aldrich, St. Louis, MO) and measured photometrically. First-strand complementary DNA (cDNA) synthesis was performed using random hexamers followed by amplification with specific primers on a Rotor Gene 6000 thermal cycler (Qiagen, Inc., Germantown, MD) as per manufacturer instructions. The following amplification conditions were used: 95°C denaturation for 10 min, followed by 40 cycles of 95°C for 15 s and 60°C for 1 min, followed by a hold at 4°C. Raw data were analyzed with Software version 2.2.3 (Qiagen Inc.) to determine the cycle threshold (CT) setting for assigning baseline and threshold CT determination. Relative expression (RE) of the sample gene was calculated using the conventional ΔΔCT method.57–59
Table 2.
Gene regulation examined via quantitative polymerase chain reaction (qPCR): a listing of the genes encoding cell and surface adhesion molecules studied, alongside primer sequence, size in base pairs (bp), and accession number.
| Gene | Primer sequence (5′-3′) | bp | Accession |
|---|---|---|---|
| Integrin α3 (ITGA3) | F: ACTACAGGCGGAACATCACC R: AAGAAGCCGTGGAAGACAGA |
20 | NM_001306071.1 |
| Integrin α7 (ITGA7) | F: TTGCTGTTAGCCACGATCAG R: TGATGTTGAGGAACGCAGAG |
20 | NM_008398.2 |
| Integrin β3 (ITGB3) | F: TGACATCGAGCAGGTGAAAG R: GAGTAGCAAGGCCAATGAGC |
20 | NM_016780.2 |
| CD44 (CD44) | F: TGGATCCGAATTAGCTGGAC R: AGCTTTTTCTTCTGCCCACA |
20 | NM_001177787.1 |
| GAPDH | F: AACTTTGGCATTGTGGAAGG R: ACACATTGGGGGTAGGAACA |
20 | NM_001289726.1 |
Adhesion and displacement within microfluidic environments
A previously described microfluidic system from our group, the µLane,56 was used in this study to evaluate RPC adhesion and displacement upon different ECM protein substrates. As shown in Figure 3, µLane systems comprised channels of 150-µm diameter and 12-mm length, as fabricated via conventional lithography, PDMS (poly(di)methyl-siloxane) micromolding, and glass bonding. The µLane inner surfaces were functionalized with LM, FN, HA, or MG at the concentrations described earlier. Solutions of RPCs at three different seeding densities of 104, 105, or 106 cells/mL were then inserted into the µLane interstitial spaces. Cells within the µLane were imaged every 24 h for 3 days using phase-contrast microscopy.
Figure 3.
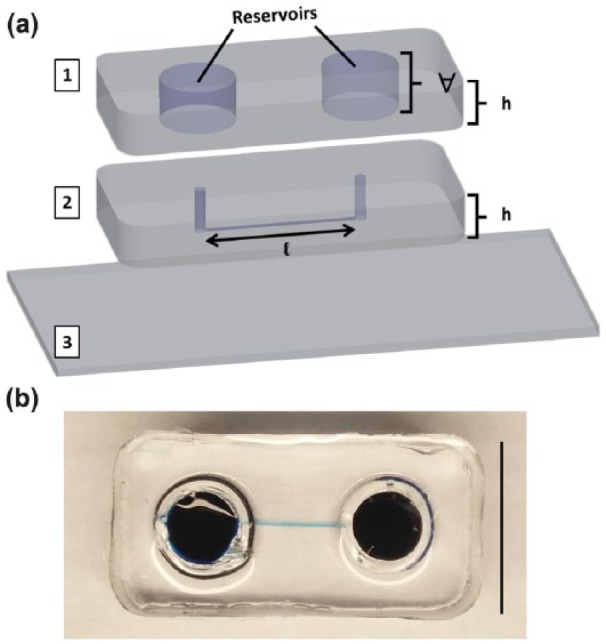
The µLane system. (a) Projection images of µLane construction, comprising two layers of PDMS polymer ((1), (2): poly-dimethyl siloxane) ozone-bonded upon a (3) glass coverslip. The µLane systems has a channel length of l = 1.2 cm, reservoir volume of V = 0.5 mL, and PDMS thickness of th = 0.75 cm. (b) Image of closed µLane system with highlighted microchannel. Scale = 1 mm.
Cell imaging and analysis
Phase-contrast images of adhered RPCs and neuroclusters were evaluated using a 20× objective lens (Nikon TE2500 microscope, Morrell Instruments, NY). Images from well plates were gathered from five non-overlapping fields via a conventional checkerboard pattern,55 while images from µLane systems were captured from five channel and reservoir areas. Size and morphology of individual RPC and cell aggregates were quantitated using ImageJ shareware (NIH, Bethesda, MD) as described previously by our group.24
Statistical analysis
Differences among adherent cell groups were evaluated using one-way analysis of variance (ANOVA) and post hoc test (Tukey). A one-way ANOVA test at the 95% confidence interval assessed statistical significance across biomaterial substrates and cell seeding densities, while the post hoc test (Tukey) determined the disparity among different groups. Calculated p-values < 0.05 were considered statistically significant and denoted by an asterisk. The numbers of experiments performed for each test were at least 10 per condition.
Results
Adhesion of RPCs
Adhered RPCs were evaluated 2 days post-seeding upon substrate surfaces of PLL, FN, LM, HA, and MG, as shown in Figure 4. RPCs adhered to all substrates in different combinations of single cells and neuroclusters (defined in Figure 2), each with varying morphology and mean size. No significant differences in viable cell numbers were observed among RPCs adhered to substrates, individually or within neuroclusters, as measured via MTT assays and conventional DAPI staining (data not shown).
Figure 4.

Aggregation and adhesion of retinal progenitor cells (RPCs). Images of RPCs at a cell density of 105 cells/mL adhered as individual cells and neuroclusters upon surfaces of: (a) poly-l-lysine (PLL), (b) fibronectin (FN), (c) laminin (LM), (d) hyaluronic acid (HA), and (e) Matrigel (MG). Representative cell clusters are outlined per image and arrows point to individually adhered cells. Scale bar = 200 µm. Representative images of RPCs evaluated as (f, g) individually adhered cells, (h) RPCs adhered with close adhesion spacing but not as neuroclusters, and (i) RPCs adhered as part of neuroclusters. Scale bar = 20 µm.
Retinal progenitor morphology (CSI) and adhesion density (ΠADH)
Cells that did not adhere as part of neuroclusters exhibited varying cell morphology and density with biomaterial substrate. Changes in cell morphology were measured via the CSI shown in Figure 5(a). As seen, only morphology changes measured upon LM were statistically significant (p < 0.05), as RPCs became increasingly elongated with higher seeding density. RPCs upon LM demonstrated the only statistically significant elongation, as average values of CSI upon LM decreased dramatically from CSI = 0.67 at low seeding density (104 cells/mL) to CSI = 0.33 for high seeding density (106 cells/mL). There was no statistical significance in CSI values among and across the other biomaterial groups (p > 0.5).
Figure 5.

Metrics of individual cell adhesion. The (a) average cell shape index (CSI) of retinal progenitor cells (RPCs) adhered as individual cells upon poly-l-lysine (PLL), fibronectin (FN), laminin (LM), hyaluronic acid (HA), and Matrigel (MG) at cell densities of 104, 105, and106 cells/mL. (b) Average values of single cell adhesion density, ΠADH, upon the same biomaterial substrates. Statistical significance within bracketed values is denoted by an asterisk. The “#” symbol indicates a cell monolayer on FN.
In contrast, the density of cells adhered as individuals rather than in clusters, ΠADH, varied depending on both the biomaterial substrate and the initial number of cells plated. Changes in ΠADH were statistically significant across cell seeding density for LM, HA, and MG, as per Figure 5(b). Average ΠADH values were greatest upon LM and HA at moderate seeding density (105/mL), but steadily increased upon MG. By contrast, increases in ΠADH were most pronounced upon PLL and FN, where at high seeding density (106/mL) the largest ΠADH value was measured upon PLL, and a complete RPC monolayer was observed upon FN. Mean values of calculated parameters are summarized in Table 3.
Table 3.
Summary of parameters measured for adhered retinal progenitor cells (RPCs).
| Matrix used | CSI (mean) | (ΠADH (mm−2) (mean) | (mm) (mean) | RADH (mean) |
|---|---|---|---|---|
| Poly-l-lysine (PLL) | 0.46 ± 0.09 | 20.8 ± 1.8 | 5.1 ± 0.55 | 56.3 ± 3.5 |
| Fibronectin (FN) | 0.36 ± 0.02 | 22.5 ± 2.4 | 1.8 ± 0.38 | 22.8 ± 3.9 |
| Laminin (LM) | 0.50 ± 0.14 | 10.2 ± 0.34 | 4.6 ± 0.75 | 59.1 ± 4.8 |
| Hyaluronic acid (HA) | 0.48 ± 0.04 | 10.7 ± 0.84 | 7.6 ± 0.94 | 72.8 ± 4.0 |
| Matrigel (MG) | 0.38 ± 0.04 | 14.37 ± 0.64 | 10.1 ± 0.60 | 72.6 ± 4.74 |
Average values of individual cell shape index (CSI) and single cell adhesion density (ΠADH) summarized alongside values of mean cluster size, , and adhesion ratio, RADH, for RPCs adhered upon PLL, FN, LM, HA, and MG.
Size and extent (RADH) of RPC neuroclusters
Neuroclusters in Figure 4 exhibited a range of mean sizes, , as measured by projected surface area. Qualitatively, RPC neuroclusters appeared compact and circular upon PLL and LM, but more diffuse and irregularly shaped neuroclusters upon FN, HA, and MG. The data in Figure 6(a) illustrate that the highest mean cluster sizes were measured upon MG and HA at high (106/mL) and moderate (105/mL) seeding densities, respectively (excluding the FN monolayer). Mean sizes of retinal neuroclusters, , rose with increasing cell density (p < 0.05) on PLL, FN, LM, and MG, but were highest at moderate seeding density upon HA. Furthermore, values of were statistically different between each biomaterial substrate across all seeding densities studied.
Figure 6.

Metrics of adhered neuroclusters. The projected surface area of adhered retinal neuroclusters was measured to determine (a) mean cluster size, XCL, upon poly-l-lysine (PLL), fibronectin (FN), laminin (LM), hyaluronic acid (HA), and Matrigel (MG) at cell densities of 104, 105, and106 cells/mL. (b) The percentage of adhered cell areas occupied by neuroclusters as measured by the adhesion ratio, RADH. Statistical significance across and between bracketed values is denoted by an asterisk. The “#” symbol indicates a cell monolayer on FN.
The percentage of cell-occupied area containing neuroclusters (vs individually adhered cells) also varied with both biomaterial substrate and cell seeding density, as measured by the adhesion ratio, RADH, in Figure 6(b). Values of average RADH increased with cell seeding density upon FN, HA, and MG and decreased with seeding density upon PLL and LM. The highest values of RADH were measured upon both HA and MG at the highest seeding densities (106/mL), where 85% of adhered surface areas contained neuroclusters. As previously noted, RPCs formed a complete monolayer on FN at high seeding density rather than discrete neuroclusters. Conversely, the lowest adhesion ratio of RADH = 31% was measured upon FN at low cell seeding density (104/mL), where less than a third of cells adhered as part of neuroclusters. Furthermore, RPCs within adherent neuroclusters exhibited similar morphologies upon all biomaterials, with an average CSI = 0.82 ± 0.4 that was significantly higher (indicative of more rounded cells) than that measured for any individually adhered cell group (Figure 5(a)). Mean values of calculated parameters are summarized in Table 3.
Expression of adhesion receptors
The observed changes in the adhesive behavior of RPCs were evaluated in relation to expression of a panel of cell surface adhesion molecules known to serve as receptors for one or more of the ECM materials used as substrates in this study: integrin α3, integrin α7, integrin β3, and CD44. As noted in Table 4, integrin α360–65 and integrin α766–69 bind to FN and LM, CD4439,75–78 is the receptor for HA, and integrin β370–74 is expressed by cells of the retinal pigment epithelium (RPE) and highly implicated in retinal angiogenesis. We observed that RPCs seeded onto substrates identified as ligands expressed somewhat higher levels of most receptors than when seeded onto PLL. Figure 7 shows that integrin β3 was up-regulated by FN and LM, but down-regulated by HA and MG, and CD44 was down-regulated by FN and LM, but up-regulated by HA and MG as per the ΔΔCT method.
Table 4.
Summary of adhesion molecules examined alongside their applications to neural cells in the retina.
| Molecule | In vivo significance | Biomaterials and testing |
|---|---|---|
| Integrin α3 | Integrins in neuro human retina60,61
Critical for retinal synapses62 Adhesion receptor for LM needed in synaptic transmission63 |
Adhesion receptor for LM, FN, and collagen64
In vivo injection in therapy for diabetic retinopathy65 |
| Integrin α7 | Adhesion receptor for FN, LM66
Mediates neurite outgrowth67 Implicated in development68 |
RPC attachment for encapsulating scaffolds69 |
| Integrin β3 | Inhibition disrupts development70
Expressed by RPE71 Implicated in retinal angiogenesis72,73 |
Substrate adhesion–derived RPE from stem cells74 |
| CD 44 | Adhesion molecule within interphotoreceptor matrix75
Critical for retinal development76,77 |
Improved stem cell survival post transplantation in HA hydrogel39
Enriched differentiation of stem cells into photoreceptors66 |
LM: laminin; FN: fibronectin; RPC: retinal progenitor cell; RPE: retinal pigment epithelium; HA: hyaluronic acid.
Figure 7.

Differences in gene expression of adhered RPCs. Fold change in regulation of the genes ITGA3, ITGA7, ITGB3, and CD44 that encode (a) integrin α3, integrin α7, integrin β3, and CD44 upon adhesion with fibronectin (FN), laminin (LM), hyaluronic acid (HA), and Matrigel (MG). (b) Schematic representation of up- and down-regulation of encoding genes as measured via the ΔΔCT method.
Attachment and displacement of RPCs
To evaluate RPC adhesion and displacement within the microscale of sub-retinal spaces, cell suspensions were seeded into µLane devices previously functionalized with FN, LM, HA, or MG. RPCs were seen to adhere as neuroclusters, individual cells, or combinations of the two, depending on the substrate used. As shown in Figure 8, RPCs did not aggregate into neuroclusters within µLane devices functionalized with FN or MG, but rather adhered solely as individual cells. By contrast, RPCs were observed to adhere within µLane systems functionalized with LM and HA as both single cells and neuroclusters. As summarized in Table 5, neuroclusters within µLane systems functionalized with LM and HA exhibited net displacements of 18–26 µm (i.e., two diameters of individually adhered cells), while that of individually adhered RPC within LM- and HA-treated µLane substrates was 3–6 µm, or less than one cell diameter. Individual RPCs adhered upon FN- and MG-treated devices underwent net displacements of 4–9 µm.
Figure 8.

Displacement of adhered retinal progenitor cells (RPCs) within the µLane microfluidic system. Images describing attachment of RPC cells and/or neuroclusters within (a) µLane systems whose inner surfaces were functionalized with (b) fibronectin (FN), (c) laminin (LM), (d) hyaluronic acid (HA), and (e) Matrigel (MG). Scale bar = 75 µm.
Table 5.
Retinal progenitor adhesion and displacement within µLane system.
| Matrix used | Neurocluster formation | Single cell displacement (µm) | Neurocluster displacement (µm) |
|---|---|---|---|
| Fibronectin (FN) | No | 4 | – |
| Laminin (LM) | Yes | 6 | 18 |
| Hyaluronic acid (HA) | Yes | 3 | 23 |
| Matrigel (MG) | No | 9 | – |
Discussion
This study examined the ability of biomaterial substrates used in transplantable biomaterials to alter RPC adhesion, clustering, and displacement. The balance between cell adhesion and motility is a critical consideration in the design of retinal scaffolds, as insufficient adhesion can result in cell death79–81 while overly strong adhesion may adversely affect RPC morphology and differentiation or prevent cell migration needed to re-establish functional connectivity.82–84 Moreover, since RPCs migrate as both clusters and individual cells during retinogenesis,85 it is also important to know the extent to which retinal scaffolds can mimic this behavior.
This study defined two parameters, adhesion ratio, RADH, and adhesion density, ΠADH, which quantitatively represented the ratio of individually adhered cells to adhered neuroclusters and the portion of total substrate area covered by cells, respectively. Results illustrate that both parameters differed depending on both ECM substrate and seeding density used. Of note, increasing the number of RPCs seeded on a substrate generally resulted in increased numbers of single cells (Figure 5) but did not necessarily yield proportionately larger neuroclusters. Rather, larger seeding densities produced (1) larger numbers of moderately sized neuroclusters upon HA and LM, (2) elicited no change in neurocluster size or adhesion upon PLL, and (3) produced larger numbers of larger-sized neuroclusters upon MG (Figure 6). Interestingly, on most substrates, formation of neuroclusters, even at the highest density examined, resulted in substantial areas of open space not covered by either clusters or single cells. This suggests that the interactions between cells and substrate were notably weaker than those between cells. In contrast, cells plated on FN at high density formed a complete monolayer, indicating that cell–substrate interaction was predominant. The implications of these differences for RPC adhesion and migration, either as single cells or clusters, have yet to be established, although the ability to characterize clustering behavior, quantitatively, will facilitate this process.
Expression of adhesion receptors as assessed by polymerase chain reaction (PCR) was altered when RPCs were cultured on their respective ligands (Figure 7). However, the substrate-dependent differences in adhesion receptor expression were modest. Consequently, while the receptors examined are likely to contribute to changes in cell shape, formation of neuroclusters, or the displacement of either individual cells or clusters, we could not establish a clear relationship between those processes and receptor expression levels. That expression of adhesion receptors, such as integrins, can be modulated in response to the amount of available ligand (substrate) in ECM has been well established.86 However, differences in gene expression may underestimate changes in the number and organization of adhesion receptors on cell surfaces. In addition, averaging techniques like PCR may not be sensitive enough to detect subtle expression changes in mixed populations such as RPCs present both as clustered and individually adhered cells. Furthermore, it has been reported that cell adhesion even to single-component extracellular matrices, such as LM or FN, may involve multiple integrin family members87 while CD44 is capable of binding both HA and collagen.75,88 Hence, adhesion to the various ECM substrates in this study may have activated more than one receptor, including some outside the limited group whose expression was examined. Future study will examine expression of molecules able to mediate cell–cell interactions that aid formation and stabilization of cell clusters, for example, cadherins.89–91
The use of the µLane system to evaluate the microscale displacement of mixed (individual and clustered) RPCs (Figure 2) within microfluidic environments represents a novel application of technology little used in retinal cell replacement studies despite widely reported usefulness in a variety of cell-based systems87,92 (Figure 3). Our system readily enables quantitative study of cell migration over sub-retinal distances <50 µm as well as distances >1000 µm for chemotaxis driven by extrinsic fields, as shown previously by our group.11,26,27 Our studies demonstrated that RPCs formed neuroclusters and underwent displacement both as individual cells and as clusters within the interstitial spaces of the µLane functionalized with LM or HA, although FN- and MG-treated substrates exhibited single-cell adhesion, only (Figure 8). Why RPCs did not form neuroclusters on FN and MG in the µLane system, as they did in bulk culture, is so far unclear, but suggests differences in substrate composition or organization between the microfluidic and bulk microenvironments that warrant further investigation. In any case, the absence of clustering suggests a predominance of cell–matrix over cell–cell interactions (Table 3), as previously noted.
Finally, the displacements observed by RPCs as both single cells and clusters on LM and HA were clearly measurable and distinct. We also note that those displacements were observed in the absence of applied stimuli, indicating that chemotactic or chemokinetic responses of RPCs to chemical and physical signals are readily amenable to study. Why the observed displacement of neuroclusters was greater than that of single cells is not known (Table 3). While quantitative study of collective migration is beyond the scope of this article, the size and composition of neuroclusters is known to affect migration modalities20,93,94 which may directly influence cell distances traveled. Furthermore, different ECM substrates may preferentially regulate cell adhesion molecules that maintain the cohesion of motile clusters93 and whose interactions may outweigh the cell–matrix adhesion studied here. In any event, our results suggest that, among the substrates examined, LM may be preferred for retinal cell transplantation. LM is present in mature and developing retina, RPCs express cell surface LM receptors, and LM mediates adhesion both as single cells and as neuroclusters. These features suggest that LM matrices may enable tuning to achieve both collective and single cell migration with desirable displacement distances. Future study will benefit from using known physical and chemical cues of retinal injury and/or neurodegeneration to directly evaluate RPC migratory behavior into injured and/or damaged laminae.
Conclusion
Composites of ECM substrates and biomaterials have evolved to support increasing numbers of cells, extend cell survival, and promote cell adhesion as strategies to improve outcomes of transplantation therapy. This study evaluated the abilities of selected substrates to regulate RPC adhesion, shape, and cell displacement as individual cells and as aggregates to design and/or enhance transplantable biomaterials. Results illustrate that combinations of clustered and individual cells on different substrates led to different behaviors that may influence the ability of transplanted, or replacement, cells to migrate effectively and achieve connectivity with host cells in retinal laminae. These findings suggest that by characterizing and/or manipulating the migratory behaviors of replacement cells, transplantation strategies can be enriched to improve cell integration.
Acknowledgments
The authors thank Jason Mighty, Onyekwere Onwumere, and Stephanie Zhang for their contributions.
Footnotes
Declaration of conflicting interests: The author(s) declared no potential conflicts of interest with respect to the research, authorship, and/or publication of this article.
Funding: The author(s) disclosed receipt of the following financial support for the research, authorship, and/or publication of this article: This research was supported by the National Institutes of Health (R21 EY026752, SC3 GM113782) and the National Science Foundation (CBET 0939511).
ORCID iD: Maribel Vazquez  http://orcid.org/0000-0002-6184-3103
References
- 1. Treharne AJ, Grossel MC, Lotery AJ, et al. The chemistry of retinal transplantation: the influence of polymer scaffold properties on retinal cell adhesion and control. Br J Ophthalmol 2011; 95(6): 768–773. [DOI] [PubMed] [Google Scholar]
- 2. Pakulska MM, Ballios BG, Shoichet MS. Injectable hydrogels for central nervous system therapy. Biomed Mater 2012; 7(2): 024101. [DOI] [PubMed] [Google Scholar]
- 3. McHugh KJ, Saint-Geniez M, Tao SL. Topographical control of ocular cell types for tissue engineering. J Biomed Mater Res B Appl Biomater 2013; 101(8): 1571–1584. [DOI] [PMC free article] [PubMed] [Google Scholar]
- 4. Aramant RB, Seiler MJ. Progress in retinal sheet transplantation. Prog Retin Eye Res 2004; 23(5): 475–494. [DOI] [PubMed] [Google Scholar]
- 5. Gust J, Reh TA. Adult donor rod photoreceptors integrate into the mature mouse retina. Invest Ophthalmol Vis Sci 2011; 52(8): 5266–5272. [DOI] [PMC free article] [PubMed] [Google Scholar]
- 6. Kruczek K, Gonzalez-Cordero A, Goh D, et al. Differentiation and transplantation of embryonic stem cell-derived cone photoreceptors into a mouse model of end-stage retinal degeneration. Stem Cell Reports 2017; 8(6): 1659–1674. [DOI] [PMC free article] [PubMed] [Google Scholar]
- 7. Qu L, Gao L, Xu H, et al. Combined transplantation of human mesenchymal stem cells and human retinal progenitor cells into the subretinal space of RCS rats. Sci Rep 2017; 7(1): 199. [DOI] [PMC free article] [PubMed] [Google Scholar]
- 8. Barber AC, Hippert C, Duran Y, et al. Repair of the degenerate retina by photoreceptor transplantation. Proc Natl Acad Sci U S A 2013; 110(1): 354–359. [DOI] [PMC free article] [PubMed] [Google Scholar]
- 9. Santos-Ferreira TF, Borsch O, Ader M. Rebuilding the missing part—a review on photoreceptor transplantation. Front Syst Neurosci 2016; 10: 105. [DOI] [PMC free article] [PubMed] [Google Scholar]
- 10. Nicoara SD, Susman S, Tudoran O, et al. Novel strategies for the improvement of stem cells’ transplantation in degenerative retinal diseases. Stem Cells Int 2016; 2016: 1236721. [DOI] [PMC free article] [PubMed] [Google Scholar]
- 11. Mishra S, Thakur A, Redenti S, et al. A model microfluidics-based system for the human and mouse retina. Biomed Microdevices 2015; 17(6): 107. [DOI] [PubMed] [Google Scholar]
- 12. Reh TA. Photoreceptor transplantation in late stage retinal degeneration. Invest Ophthalmol Vis Sci 2016; 57(5): ORSFg1–ORSFg7. [DOI] [PMC free article] [PubMed] [Google Scholar]
- 13. Xian B, Huang B. The immune response of stem cells in subretinal transplantation. Stem Cell Res Ther 2015; 6: 161. [DOI] [PMC free article] [PubMed] [Google Scholar]
- 14. Pearson RA, Gonzalez-Cordero A, West EL, et al. Donor and host photoreceptors engage in material transfer following transplantation of post-mitotic photoreceptor precursors. Nat Commun 2016; 7: 13029. [DOI] [PMC free article] [PubMed] [Google Scholar]
- 15. Pritchard CD, Arner KM, Neal RA, et al. The use of surface modified poly(glycerol-co-sebacic acid) in retinal transplantation. Biomaterials 2010; 31(8): 2153–2162. [DOI] [PMC free article] [PubMed] [Google Scholar]
- 16. Kundu J, Michaelson A, Baranov P, et al. Approaches to cell delivery: substrates and scaffolds for cell therapy. Dev Ophthalmol 2014; 53: 143–154. [DOI] [PubMed] [Google Scholar]
- 17. Carr MJ. Legal commentary: developing printed materials for patient education. Dimens Crit Care Nurs 1989; 8(4): 258–259. [PubMed] [Google Scholar]
- 18. Calejo MT, Ilmarinen T, Vuorimaa-Laukkanen E, et al. Langmuir-Schaefer film deposition onto honeycomb porous films for retinal tissue engineering. Acta Biomater 2017; 54: 138–149. [DOI] [PubMed] [Google Scholar]
- 19. MacLaren RE, Pearson RA, MacNeil A, et al. Retinal repair by transplantation of photoreceptor precursors. Nature 2006; 444(7116): 203–207. [DOI] [PubMed] [Google Scholar]
- 20. De Pascalis C, Etienne-Manneville S. Single and collective cell migration: the mechanics of adhesions. Mol Biol Cell 2017; 28(14): 1833–1846. [DOI] [PMC free article] [PubMed] [Google Scholar]
- 21. Aman A, Piotrowski T. Cell migration during morphogenesis. Dev Biol 2010; 341(1): 20–33. [DOI] [PubMed] [Google Scholar]
- 22. Jayakody SA, Gonzalez-Cordero A, Ali RR, et al. Cellular strategies for retinal repair by photoreceptor replacement. Prog Retin Eye Res 2015; 46: 31–66. [DOI] [PubMed] [Google Scholar]
- 23. Lawley E, Baranov P, Young M. Hybrid vitronectin-mimicking polycaprolactone scaffolds for human retinal progenitor cell differentiation and transplantation. J Biomater Appl 2015; 29(6): 894–902. [DOI] [PubMed] [Google Scholar]
- 24. McCutcheon S, Unachukwu U, Thakur A, et al. In vitro formation of neuroclusters in microfluidic devices and cell migration as a function of stromal-derived growth factor 1 gradients. Cell Adh Migr 2017; 11(1): 1–12. [DOI] [PMC free article] [PubMed] [Google Scholar]
- 25. Able RA, Jr, Ngnabeuye C, Beck C, et al. Low concentration microenvironments enhance the migration of neonatal cells of glial lineage. Cell Mol Bioeng 2012; 5(2): 128–142. [DOI] [PMC free article] [PubMed] [Google Scholar]
- 26. Unachukwu UJ, Warren A, Li Z, et al. Predicted molecular signaling guiding photoreceptor cell migration following transplantation into damaged retina. Sci Rep 2016; 6: 22392. [DOI] [PMC free article] [PubMed] [Google Scholar]
- 27. Unachukwu UJ, Sauane M, Vazquez M, et al. Microfluidic generated EGF-gradients induce chemokinesis of transplantable retinal progenitor cells via the JAK/STAT and PI3kinase signaling pathways. PLoS ONE 2013; 8(12): e83906. [DOI] [PMC free article] [PubMed] [Google Scholar]
- 28. Miller CG, Budoff G, Prenner JL, et al. Minireview: Fibronectin in retinal disease. Exp Biol Med 2017; 242(1): 1–7. [DOI] [PMC free article] [PubMed] [Google Scholar]
- 29. Wu WC, Chang YC, Wu KY, et al. Pharmacological implications from the adhesion-induced signaling profiles in cultured human retinal pigment epithelial cells. Kaohsiung J Med Sci 2014; 30(1): 1–11. [DOI] [PMC free article] [PubMed] [Google Scholar]
- 30. Torres AL, Bidarra SJ, Pinto MT, et al. Guiding morphogenesis in cell-instructive microgels for therapeutic angiogenesis. Biomaterials 2017; 154: 34–47. [DOI] [PubMed] [Google Scholar]
- 31. Libby RT, Champliaud MF, Claudepierre T, et al. Laminin expression in adult and developing retinae: evidence of two novel CNS laminins. J Neurosci 2000; 20(17): 6517–6528. [DOI] [PMC free article] [PubMed] [Google Scholar]
- 32. Tezcaner A, Hicks D. In vitro characterization of micropatterned PLGA-PHBV8 blend films as temporary scaffolds for photoreceptor cells. J Biomed Mater Res A 2008; 86(1): 170–181. [DOI] [PubMed] [Google Scholar]
- 33. Assawachananont J, Mandai M, Okamoto S, et al. Transplantation of embryonic and induced pluripotent stem cell-derived 3D retinal sheets into retinal degenerative mice. Stem Cell Reports 2014; 2(5): 662–674. [DOI] [PMC free article] [PubMed] [Google Scholar]
- 34. Pritchard CD, Arner KM, Langer RS, et al. Retinal transplantation using surface modified poly(glycerol-co-sebacic acid) membranes. Biomaterials 2010; 31(31): 7978–7984. [DOI] [PMC free article] [PubMed] [Google Scholar]
- 35. Fraser JR, Laurent TC, Laurent UB. Hyaluronan: its nature, distribution, functions and turnover. J Intern Med 1997; 242(1): 27–33. [DOI] [PubMed] [Google Scholar]
- 36. Hollyfield JG. Hyaluronan and the functional organization of the interphotoreceptor matrix. Invest Ophthalmol Vis Sci 1999; 40(12): 2767–2769. [PubMed] [Google Scholar]
- 37. Santhanam S, Liang J, Struckhoff J, et al. Biomimetic hydrogel with tunable mechanical properties for vitreous substitutes. Acta Biomater 2016; 43: 327–337. [DOI] [PMC free article] [PubMed] [Google Scholar]
- 38. Kundu J, Michaelson A, Talbot K, et al. Decellularized retinal matrix: natural platforms for human retinal progenitor cell culture. Acta Biomater 2016; 31: 61–70. [DOI] [PubMed] [Google Scholar]
- 39. Ballios BG, Cooke MJ, Donaldson L, et al. A hyaluronan-based injectable hydrogel improves the survival and integration of stem cell progeny following transplantation. Stem Cell Reports 2015; 4(6): 1031–1045. [DOI] [PMC free article] [PubMed] [Google Scholar]
- 40. Liu Y, Wang R, Zarembinski TI, et al. The application of hyaluronic acid hydrogels to retinal progenitor cell transplantation. Tissue Eng Part A 2013; 19(1–2): 135–142. [DOI] [PubMed] [Google Scholar]
- 41. Malinda KM. In vivo matrigel migration and angiogenesis assay. Methods Mol Biol 2009; 467: 287–294. [DOI] [PubMed] [Google Scholar]
- 42. Thomson HA, Treharne AJ, Walker P, et al. Optimisation of polymer scaffolds for retinal pigment epithelium (RPE) cell transplantation. Br J Ophthalmol 2011; 95(4): 563–568. [DOI] [PubMed] [Google Scholar]
- 43. Zhou L, Wang W, Liu Y, et al. Differentiation of induced pluripotent stem cells of swine into rod photoreceptors and their integration into the retina. Stem Cells 2011; 29(6): 972–980. [DOI] [PMC free article] [PubMed] [Google Scholar]
- 44. Lu HF, Narayanan K, Lim SX, et al. A 3D microfibrous scaffold for long-term human pluripotent stem cell self-renewal under chemically defined conditions. Biomaterials 2012; 33(8): 2419–2430. [DOI] [PubMed] [Google Scholar]
- 45. Benton G, George J, Kleinman HK, et al. Advancing science and technology via 3D culture on basement membrane matrix. J Cell Physiol 2009; 221(1): 18–25. [DOI] [PubMed] [Google Scholar]
- 46. Du J, Sun Y, Li FH, et al. Enhanced delivery of biodegradable mPEG-PLGA-PLL nanoparticles loading Cy3-labelled PDGF-BB siRNA by UTMD to rat retina. J Biosci 2017; 42(2): 299–309. [DOI] [PubMed] [Google Scholar]
- 47. Hertz J, Robinson R, Valenzuela DA, et al. A tunable synthetic hydrogel system for culture of retinal ganglion cells and amacrine cells. Acta Biomater 2013; 9(8): 7622–7629. [DOI] [PMC free article] [PubMed] [Google Scholar]
- 48. Myung JH, Hsu HJ, Bugno J, et al. Chemical structure and surface modification of dendritic nanomaterials tailored for therapeutic and diagnostic applications. Curr Top Med Chem 2017; 17(13): 1542–1554. [DOI] [PubMed] [Google Scholar]
- 49. Chen M, Harvey AR, Dyson SE. Regrowth of lesioned retinal axons associated with the transplantation of Schwann cells to the brachial region of the rat optic tract. Restor Neurol Neurosci 1991; 2(4): 233–248. [DOI] [PubMed] [Google Scholar]
- 50. Van Meurs JC, ter Averst E, Hofland LJ, et al. Autologous peripheral retinal pigment epithelium translocation in patients with subfoveal neovascular membranes. Br J Ophthalmol 2004; 88(1): 110–113. [DOI] [PMC free article] [PubMed] [Google Scholar]
- 51. Mariappan I, Maddileti S, Joseph P, et al. Enriched cultures of retinal cells from BJNhem20 human embryonic stem cell line of Indian origin. Invest Ophthalmol Vis Sci 2015; 56(11): 6714–6723. [DOI] [PubMed] [Google Scholar]
- 52. Klassen HJ, Ng TF, Kurimoto Y, et al. Multipotent retinal progenitors express developmental markers, differentiate into retinal neurons, and preserve light-mediated behavior. Invest Ophthalmol Vis Sci 2004; 45(11): 4167–4173. [DOI] [PubMed] [Google Scholar]
- 53. Vecino E, Heller JP, Veiga-Crespo P, et al. Influence of extracellular matrix components on the expression of integrins and regeneration of adult retinal ganglion cells. PLoS ONE 2015; 10(5): e0125250. [DOI] [PMC free article] [PubMed] [Google Scholar]
- 54. Versaevel M, Grevesse T, Gabriele S. Spatial coordination between cell and nuclear shape within micropatterned endothelial cells. Nat Commun 2012; 3: 671. [DOI] [PubMed] [Google Scholar]
- 55. Dudu V, Able RA, Jr, Rotari V, et al. Role of epidermal growth factor-triggered PI3K/Akt signaling in the migration of medulloblastoma-derived cells. Cell Mol Bioeng 2012; 5(4): 402–413. [DOI] [PMC free article] [PubMed] [Google Scholar]
- 56. Kong Q, Able RA, Jr, Dudu V, et al. A microfluidic device to establish concentration gradients using reagent density differences. J Biomech Eng 2010; 132(12): 121012. [DOI] [PubMed] [Google Scholar]
- 57. Schefe JH, Lehmann KE, Buschmann IR, et al. Quantitative real-time RT-PCR data analysis: current concepts and the novel “gene expression’s CT difference” formula. J Mol Med 2006; 84(11): 901–910. [DOI] [PubMed] [Google Scholar]
- 58. Schmittgen TD, Livak KJ. Analyzing real-time PCR data by the comparative C(T) method. Nat Protoc 2008; 3(6): 1101–1108. [DOI] [PubMed] [Google Scholar]
- 59. Livak KJ, Schmittgen TD. Analysis of relative gene expression data using real-time quantitative PCR and the 2(-Delta Delta C(T)) Method. Methods 2001; 25(4): 402–408. [DOI] [PubMed] [Google Scholar]
- 60. Aisenbrey S, Zhang M, Bacher D, et al. Retinal pigment epithelial cells synthesize laminins, including laminin 5, and adhere to them through alpha3- and alpha6-containing integrins. Invest Ophthalmol Vis Sci 2006; 47(12): 5537–5544. [DOI] [PMC free article] [PubMed] [Google Scholar]
- 61. Brem RB, Robbins SG, Wilson DJ, et al. Immunolocalization of integrins in the human retina. Invest Ophthalmol Vis Sci 1994; 35(9): 3466–3474. [PubMed] [Google Scholar]
- 62. Clegg DO, Mullick LH, Wingerd KL, et al. Adhesive events in retinal development and function: the role of integrin receptors. Results Probl Cell Differ 2000; 31: 141–156. [DOI] [PubMed] [Google Scholar]
- 63. Hunter DD, Manglapus MK, Bachay G, et al. CNS synapses are stabilized trans-synaptically by laminins and laminin-interacting proteins. J Comp Neurol. Epub ahead of print 12 October 2017. DOI: 10.1002/cne.24338. [DOI] [PubMed] [Google Scholar]
- 64. Fukushi J, Makagiansar IT, Stallcup WB. NG2 proteoglycan promotes endothelial cell motility and angiogenesis via engagement of galectin-3 and alpha3beta1 integrin. Mol Biol Cell 2004; 15(8): 3580–3590. [DOI] [PMC free article] [PubMed] [Google Scholar]
- 65. Park SW, Yun JH, Kim JH, et al. Angiopoietin 2 induces pericyte apoptosis via alpha3beta1 integrin signaling in diabetic retinopathy. Diabetes 2014; 63(9): 3057–3068. [DOI] [PubMed] [Google Scholar]
- 66. Morrison JC. Integrins in the optic nerve head: potential roles in glaucomatous optic neuropathy (an American Ophthalmological Society thesis). Trans Am Ophthalmol Soc 2006; 104: 453–477. [PMC free article] [PubMed] [Google Scholar]
- 67. Gardiner NJ, Fernyhough P, Tomlinson DR, et al. Alpha7 integrin mediates neurite outgrowth of distinct populations of adult sensory neurons. Mol Cell Neurosci 2005; 28(2): 229–240. [DOI] [PubMed] [Google Scholar]
- 68. Ziober BL, Vu MP, Waleh N, et al. Alternative extracellular and cytoplasmic domains of the integrin alpha 7 subunit are differentially expressed during development. J Biol Chem 1993; 268(35): 26773–26783. [PubMed] [Google Scholar]
- 69. Ahmed TA, Ringuette R, Wallace VA, et al. Autologous fibrin glue as an encapsulating scaffold for delivery of retinal progenitor cells. Front Bioeng Biotechnol 2014; 2: 85. [DOI] [PMC free article] [PubMed] [Google Scholar]
- 70. Li M, Sakaguchi DS. Inhibition of integrin-mediated adhesion and signaling disrupts retinal development. Dev Biol 2004; 275(1): 202–214. [DOI] [PubMed] [Google Scholar]
- 71. Anderson DH, Johnson LV, Hageman GS. Vitronectin receptor expression and distribution at the photoreceptor-retinal pigment epithelial interface. J Comp Neurol 1995; 360(1): 1–16. [DOI] [PubMed] [Google Scholar]
- 72. Cabral T, Mello LGM, Lima LH, et al. Retinal and choroidal angiogenesis: a review of new targets. Int J Retina Vitreous 2017; 3: 31. [DOI] [PMC free article] [PubMed] [Google Scholar]
- 73. Yoshida T, Gong J, Xu Z, et al. Inhibition of pathological retinal angiogenesis by the integrin alphavbeta3 antagonist tetraiodothyroacetic acid (tetrac). Exp Eye Res 2012; 94(1): 41–48. [DOI] [PMC free article] [PubMed] [Google Scholar]
- 74. Buchholz DE, Hikita ST, Rowland TJ, et al. Derivation of functional retinal pigmented epithelium from induced pluripotent stem cells. Stem Cells 2009; 27(10): 2427–2434. [DOI] [PubMed] [Google Scholar]
- 75. Hollyfield JG, Rayborn ME, Tammi M, et al. Hyaluronan in the interphotoreceptor matrix of the eye: species differences in content, distribution, ligand binding and degradation. Exp Eye Res 1998; 66(2): 241–248. [DOI] [PubMed] [Google Scholar]
- 76. Chaitin MH, Ankrum MT, Wortham HS. Distribution of CD44 in the retina during development and the rds degeneration. Brain Res Dev Brain Res 1996; 94(1): 92–98. [DOI] [PubMed] [Google Scholar]
- 77. Goodison S, Urquidi V, Tarin D. CD44 cell adhesion molecules. Mol Pathol 1999; 52(4): 189–196. [DOI] [PMC free article] [PubMed] [Google Scholar]
- 78. Nadri S, Yazdani S, Arefian E, et al. Mesenchymal stem cells from trabecular meshwork become photoreceptor-like cells on amniotic membrane. Neurosci Lett 2013; 541: 43–48. [DOI] [PubMed] [Google Scholar]
- 79. Baranov P, Michaelson A, Kundu J, et al. Interphotoreceptor matrix-poly(∈-caprolactone) composite scaffolds for human photoreceptor differentiation. J Tissue Eng 2014; 5: 2041731414554139. [DOI] [PMC free article] [PubMed] [Google Scholar]
- 80. Kundu J, Michaelson A, Baranov P, et al. Interphotoreceptor matrix based biomaterial: impact on human retinal progenitor cell attachment and differentiation. J Biomed Mater Res B Appl Biomater. Epub ahead of print 18 April 2017. DOI: 10.1002/jbm.b.33901. [DOI] [PubMed] [Google Scholar]
- 81. Nazemroaya F, Soheili ZS, Samiei S, et al. Induced retro-differentiation of human retinal pigment epithelial cells on PolyHEMA. J Cell Biochem 2017; 118(10): 3080–3089. [DOI] [PubMed] [Google Scholar]
- 82. Blong CC, Jeon CJ, Yeo JY, et al. Differentiation and behavior of human neural progenitors on micropatterned substrates and in the developing retina. J Neurosci Res 2010; 88(7): 1445–1456. [DOI] [PubMed] [Google Scholar]
- 83. Dutt K, Cao Y. Attachment to cytodex beads enhances differentiation of human retinal progenitors in 3-D bioreactor culture. Curr Stem Cell Res Ther 2011; 6(4): 350–361. [DOI] [PubMed] [Google Scholar]
- 84. Opas M, Dziak E. bFGF-induced transdifferentiation of RPE to neuronal progenitors is regulated by the mechanical properties of the substratum. Dev Biol 1994; 161(2): 440–454. [DOI] [PubMed] [Google Scholar]
- 85. Eiraku M, Takata N, Ishibashi H, et al. Self-organizing optic-cup morphogenesis in three-dimensional culture. Nature 2011; 472(7341): 51–56. [DOI] [PubMed] [Google Scholar]
- 86. Hynes RO, Zhao Q. The evolution of cell adhesion. J Cell Biol 2000; 150(2): F89–F96. [DOI] [PubMed] [Google Scholar]
- 87. Reinhardt M, Bader A, Giri S. Devices for stem cell isolation and delivery: current need for drug discovery and cell therapy. Expert Rev Med Devices 2015; 12(3): 353–364. [DOI] [PubMed] [Google Scholar]
- 88. Culty M, Nguyen HA, Underhill CB. The hyaluronan receptor (CD44) participates in the uptake and degradation of hyaluronan. J Cell Biol 1992; 116(4): 1055–1062. [DOI] [PMC free article] [PubMed] [Google Scholar]
- 89. Bolz H, Reiners J, Wolfrum U, et al. Role of cadherins in Ca2+-mediated cell adhesion and inherited photoreceptor degeneration. Adv Exp Med Biol 2002; 514: 399–410. [DOI] [PubMed] [Google Scholar]
- 90. Hakeda-Suzuki S, Suzuki T. Cell surface control of the layer specific targeting in the Drosophila visual system. Genes Genet Syst 2014; 89(1): 9–15. [DOI] [PubMed] [Google Scholar]
- 91. Matthews BJ, Corty MM, Grueber WB. Of cartridges and columns: new roles for cadherins in visual system development. Neuron 2008; 58(1): 1–3. [DOI] [PubMed] [Google Scholar]
- 92. Karimi M, Bahrami S, Mirshekari H, et al. Microfluidic systems for stem cell-based neural tissue engineering. Lab Chip 2016; 16(14): 2551–2571. [DOI] [PMC free article] [PubMed] [Google Scholar]
- 93. Friedl P, Mayor R. Tuning collective cell migration by cell-cell junction regulation. Cold Spring Harb Perspect Biol 2017; 9(4): a029199. [DOI] [PMC free article] [PubMed] [Google Scholar]
- 94. Hakim V, Silberzan P. Collective cell migration: a physics perspective. Rep Prog Phys 2017; 80(7): 076601. [DOI] [PubMed] [Google Scholar]