

Abstract
Background
Tyrosine kinase inhibitors (TKIs) improve survival of chronic myeloid leukemia (CML) patients dramatically; however, non-adherence to TKI therapy may lead to resistance to the therapy. They are very expensive and covered under Part D insurance for Medicare patients. The impact of low-income subsidy status and cost-sharing on adherence was not well studied in the literature among this group.
Methods
Surveillance, Epidemiology, and End Results (SEER) registry data linked with Medicare Part D data from years 2007–2012 was used in this study. We identified 836 CML patients with Medicare Part D insurance coverage who were new TKI users. Treatment non-adherence was defined as a binary variable indicating proportion of days covered (PDC) lower than 80% during the 180-day period after TKI therapy initiation. Logistic regression was used to examine the relationship between out of pocket (OOP) cost per 30-day drug supply, Part D plan characteristics and treatment adherence while controlling for other patient characteristics.
Results
Overall 244 (29%) of the 836 CML patients were non-adherent to targeted oral therapy during the 180 days after they began taking the TKIs. The multivariable logistic regression showed that patients with heavily subsidized (OR=6.7, 95% CI: 2.8~15.9) and moderately subsidized (OR=3.0, 95% CI: 1.4~6.5) Part D plans were much more likely to have non-adherence than patients without subsidy.
Conclusions
This population-based study found a significantly higher rate of non-adherence among heavily subsidized patients with substantially lower OOP costs, which suggests that future research is needed to help lower the non-adherence rate among these patients.
Keywords: Adherence, TKIs, Medicare Part D, CML, SEER
Introduction
There have been rapid developments in targeted oral therapies for cancer in the past decade.1 For some cancer types, targeted oral anti-cancer drugs have become the standard of care. One example is how a group of tyrosine kinase inhibitors (TKIs) including imatinib, dasatinib, and nilotinib have transformed the treatment of chronic myeloid leukemia (CML) patients. The survival of CML patients has improved dramatically due to the use of these TKIs.2,3 However, loss of response (resistance) to TKI therapy remains a significant challenge in CML treatment and results in less treatment options and worse clinical outcomes.4 Researchers have found that poor adherence to TKI therapy is strongly associated with loss of response and treatment failure.5,6 Oral TKIs are very expensive and constitute a major contributing factor to the rapid rise in chemotherapy costs in the US.7 The financial burden of TKI treatment and the negative impact of non-adherence has raised many concerns that patients’ non-adherence, which is strongly influenced by high drug costs, may lead to undesired clinical and economic outcomes.
Studies have found that non-adherence to TKI treatment results in lower pharmacy costs but much higher medical costs and higher total costs overall.8–10 There are many papers in the literature showing that higher cost burdens on patients can lead to worse adherence to medications.11–14 One important study on the relationship between cost sharing and adherence to TKIs found that higher copayments were significantly associated with non-adherence.15 However, most of these studies are based on employer-sponsored insurance and the main study populations are younger patients. CML is most frequently diagnosed among people aged 65-74; approximately half of newly diagnosed patients are 65 years or older.16 Given the higher incidence of disease among the elderly population, it is important to investigate the relationship between adherence and drug cost sharing for elderly CML patients who most likely have Medicare Part D prescription plans.
Medicare Part D prescription drug benefit began in 2006 as an important component of Medicare insurance. Under Medicare Part D, some beneficiaries receive the low-income subsidy (LIS) and get assistance in paying for Medicare Part D prescription drug costs; they also do not have a gap in prescription drug coverage. Eligibility and the amount of subsidy depend on the individual’s income compared to the Federal Poverty Level and resource limitations. In 2014, more than 11 million Medicare Part D enrollees received the LIS.17
There have been many studies examining the relationship between LIS and medication adherence. One paper found that adherence to diabetes medication was moderately better among LIS beneficiaries compared to beneficiaries without subsidies.18 Another study focused on patients’ adherence to clopidogrel after stent placement and found that beneficiaries with LIS had better adherence.19 However, there is scarce literature on CML patients under Medicare Part D prescription plans taking expensive oral TKI therapies. Studies have shown that although higher cost-sharing is generally associated with reductions in specialty drug utilization, the effects varied significantly by type of disease and specialty drug.20 There are two important recent studies21,22 that examined TKI usage among Medicare beneficiaries with CML. Both studies mainly focused on the initiation of TKI therapy among newly diagnosed CML patients and both found that patients with low-income subsidies were more likely to initiate TKI treatment. Interestingly, the second study22 found that despite the differences in initiation between patients with and without subsidies, once the treatment was initiated there was no significant difference in adherence between patients with and without subsidies. It is possible that this conclusion is partly due to the small sample size of the study, since the analysis on adherence was based on 202 patients with stand-alone Part D plans. Different from these two studies on newly diagnosed patients, our study focuses on the adherence to TKI therapy among a larger group of prevalent CML patients (836 patients) who started TKI therapy with a 6 month washout period. Our sample included both patients with stand-alone Medicare Part D plans and patients with other Part D plans such as Managed Care Organizations, regional Preferred Provider Organization (PPO) and employer-sponsored plans. Further, we calculated the actual patient out-of-pocket payment per month supply of TKI and also considered their out-of-pocket payments for other drugs. The aim of our study is to examine the relationship between cost sharing, Part D plan type, low-income subsidy status and adherence to oral TKI treatment among elderly CML patients who initiated TKI therapy and have Medicare Part D prescription plans.
Methods
Data Source
We used the Surveillance, Epidemiology, and End Results (SEER) registry data linked with Medicare Part D data from 2007 to 2012 in this study (the newest data available at the time of the study). The SEER registries of the National Cancer Institute (NCI) are a large data source providing information on cancer incidence and characteristics covering approximately 28% of the US population. The linkage to Medicare Part D data enhances the information that is available by providing details on patients’ demographics, prescription drug plans and drug usage.
Study Cohort
We first selected patients diagnosed with CML on or before 2012 based on the SEER registry cancer site information according to WHO Classification of Tumours of Haematopoietic and Lymphoid Tissues (i.e., ICD-O-3 codes 9863, 9875-9876, 9945-9946).23 We then identified new users of any of the three TKIs that we studied (imatinib, dasatinib, and nilotinib) by imposing a wash-out period of at least 6 months without any use of the above TKIs. To ensure complete Medicare claims to capture their prescription drug usage, we restricted the sample to include patients with continuous enrollment in one type of prescription plan (either a traditional stand-alone Part D plan, regional PPO plan, Managed Care Organizations other than Regional PPO, or employer-sponsored plan throughout) during the 6 months before and 6 months after the start of the TKI therapy. We further required that the patients’ prescription plans and subsidy and copayment status did not change throughout this time period. Finally, we excluded patients with missing demographic information. The final study cohort included 836 patients for analysis. The detailed inclusion and exclusion steps of our study cohort are provided in Table 1.
Table 1.
Derivation of the Study Cohort
| Step | Criteria | No. of observations | No. Excluded |
|---|---|---|---|
| 1 | Patients diagnosed with CML on or before 2012 | 15082 | |
| 2 | Patients who took TKI drug (Gleevec/Sprycel/Tasigna) in 2007-2012 | 2496 | 12586 |
| 3 | Patients continuously enrolled in a Part D plan for 6 months before the start of the targeted drug, and without any target drug usage within this period (6 months washout period) | 970 | 1526 |
| 4 | Patients continuously enrolled in a Part D plan during the 6 months after the start of targeted drug | 836 | 134 |
Key Variables
We examined non-adherence to TKI therapy during the 6 months after the start of the therapy. We defined non-adherence as a binary variable indicating that the proportion of days covered (PDC) was lower than 80%.24 In other words, patients were considered non-adherent if the number of days of TKI supply covered less than 80% of days for the patient during the 180-day period after the initiation of TKI therapy. We did not exclude hospitalization days as TKIs are very expensive and hospitals are unlikely to include them on the hospital formularies.25 The four key independent variables were the out-of-pocket (OOP) cost per 30 days of supply of TKIs, OOP spent on other drugs during the 180 days, Part D plan subsidy status, and Part D plan type. We divided the total OOP payments for TKIs by the total days of drug supply during the 180-day period after initiation and then multiplied it by 30 to obtain the OOP cost per 30 days of supply. All costs were inflation adjusted to 2014 dollars based on the medical care component of the Consumer Price Index.
We created three groups for subsidy status: a) heavily subsidized (100% premium-subsidy with no or low copayment), b) moderately subsidized (some premium-subsidy and copayment) and c) no subsidy. The Part D plan types were categorized into two groups: a) traditional stand-alone Part D Plans and b) all other plans including Managed Care Organizations (MCOs), Regional Preferred Provider Organizations (RPPOs) and employer-sponsored plans. MCOs and RPPOs are networks of health care providers who offer managed care health plans. MCOs usually only pay for health services within this network. RPPOs pay for services within and outside of the network with the patients paying a higher proportion of cost-sharing when out-of-network services were used. Employer-sponsored plans are group insurance plans offered by employers. The employers negotiate with insurers and often provide a range of plan options to employees.
Other Independent Variables
We included patients’ demographic information, neighborhood socioeconomic status and the year when they started TKI therapies. The demographic characteristics included age (≤70, or >70), sex (male, female), race (white, non-white), region (Northeast, West, Midwest, South) and urban/rural status (metropolitan vs. non-metropolitan). The neighborhood socioeconomic status variables included three variables in terms of quartiles: median household income, percent living in poverty and percent with at least four years of college education. Notice that the quartile cutoffs change every year, and we provide the cutoff levels in the Supplementary Material.
Statistical Analyses
We provided descriptive statistics of our study cohort. Group differences in non-adherence to TKI therapy were tested with chi-squared statistics. For the continuous variables OOP cost per 30 days of TKI supply and OOP payment for all other drugs, Wilcoxon-Mann-Whitney test was used to test the difference as the cost variable is skewed. We also provide the box plots of OOP cost per 30 days of TKI supply by subsidy status. We employed a multivariate logistic regression to explore factors associated with non-adherence to TKIs and presented the findings in adjusted odds ratios (ORs) and their corresponding 95% confidence intervals (CIs). As patients with subsidies and patients without subsidies are likely to be two very different groups and respond to factors differently, we also conducted subgroup analyses for these two groups. All statistical analyses were conducted in SAS 9.3 (SAS Institute, Cary NC). This study received exemption status from the Institutional Review Board at The University of Texas MD Anderson Cancer Center.
Results
Table 2 provides detailed descriptive statistics of the study cohort. Overall 244 (29%) out of the 836 CML patients were non-adherent to TKIs during the 180 days after drug initiation. Patients with heavily subsidized plans were significantly (p-value=0.036) much more likely to be non-adherent. It is interesting that a much higher percentage of patients with heavily subsidized plans were non-adherent compared to patients with no subsidy (36% vs. 27%, respectively), while patients with moderately subsidized plans had less non-adherence (25%). In terms of OOP cost per 30 days of TKI supply, the non-adherent individuals had higher cost (mean $829 vs $567; p-value=0.005).
Table 2.
Description of the Study Sample by Adherence
| Covariates | Non-adherence | Adherence | P value |
|---|---|---|---|
| Overall | 244 (29.19%) | 592 (70.81%) | |
| Cohort year | 0.121 | ||
| 2007 | 31 (39.74%) | 47 (60.26%) | |
| 2008 | 58 (33.33%) | 116 (66.67%) | |
| 2009 | 45 (26.63%) | 124 (73.37%) | |
| 2010 | 47 (24.48%) | 145 (75.52%) | |
| 2011 | Masked* | 129 (70.88%) | |
| 2012 | Masked* | 31 (75.61%) | |
| Sex | 0.489 | ||
| Male | 123 (28.15%) | 314 (71.85%) | |
| Female | 121 (30.33%) | 278 (69.67%) | |
| Age | 0.117 | ||
| 70 or younger | 105 (26.58%) | 290 (73.42%) | |
| older than 70 | 139 (31.52%) | 302 (68.48%) | |
| Race | 0.648 | ||
| White | 200 (28.86%) | 493 (71.14%) | |
| Non-white | 44 (30.77%) | 99 (69.23%) | |
| Urban/rural status | 0.495 | ||
| Metropolitan | 211 (29.63%) | 501 (70.37%) | |
| Non-metropolitan | 33 (26.61%) | 91 (73.39%) | |
| Region | 0.191 | ||
| Northeast | 32 (26.89%) | 87 (73.11%) | |
| Midwest | 25 (24.04%) | 79 (75.96%) | |
| South | 59 (26.58%) | 163 (73.42%) | |
| West | 128 (32.74%) | 263 (67.26%) | |
| Plan type | 0.491 | ||
| Medicare Prescription Drug Plan (PDP) | 158 (28.42%) | 398 (71.58%) | |
| Managed Care Organizations or Regional PPO or Employer Sponsored | 86 (30.71%) | 194 (69.29%) | |
| Subsidy status | 0.036 | ||
| Heavily subsidized | 71 (36.41%) | 124 (63.59%) | |
| Moderately subsidized | 33 (25.38%) | 97 (74.62%) | |
| No subsidy | 140 (27.40%) | 371 (72.60%) | |
| TKI drug payment per month supply ($) | 0.005 | ||
| Mean (standard deviation) | 829 (1076) | 567 (579) | |
| Other drug payments ($) | 0.511 | ||
| Mean (standard deviation) | 258 (558) | 159 (273) | |
| Census tract median income in quartile | 0.223 | ||
| First quartile | 54 (25.35%) | 159 (74.65%) | |
| Second quartile | 82 (32.80%) | 168 (67.20%) | |
| Third quartile | 46 (26.14%) | 130 (73.86%) | |
| Fourth quartile | 62 (31.47%) | 135 (68.53%) | |
| Census tract % below poverty level in quartile | 0.52 | ||
| First quartile | 65 (29.28%) | 157 (70.72%) | |
| Second quartile | 57 (28.08%) | 146 (71.92%) | |
| Third quartile | 69 (32.86%) | 141 (67.14%) | |
| Fourth quartile | 53 (26.37%) | 148 (73.63%) | |
| Census tract % with at least four years of college education in quartile | 0.565 | ||
| First quartile | 62 (28.44%) | 156 (71.56%) | |
| Second quartile | 68 (26.77%) | 186 (73.23%) | |
| Third quartile | 59 (32.96%) | 120 (67.04%) | |
| Fourth quartile | 55 (29.73%) | 130 (70.27%) |
Masked per Surveillance, Epidemiology, and End Results-Medicare user agreement for confidentiality.
We also analyzed the OOP costs per 30 days of TKI supply by subsidy status. The box plot (Figure 1) shows the substantial difference in OOP costs for patients based on subsidy status. Patients who are heavily subsidized have very low OOP costs with a median of $1.3 per 30 days of TKI supply and an interquartile range of $1.3; the moderately subsidized group also had low OOP costs with a median of $3.0 and an interquartile range of $3.6; the group without subsidy had much higher OOP costs with a median of $980.7 and an interquartile range of $668.6. When taken together, our findings suggest that while patients who were heavily subsidized had low OOP costs, their drug adherence was worse than that of individuals in the moderately subsidized or no subsidy groups.
Figure 1.
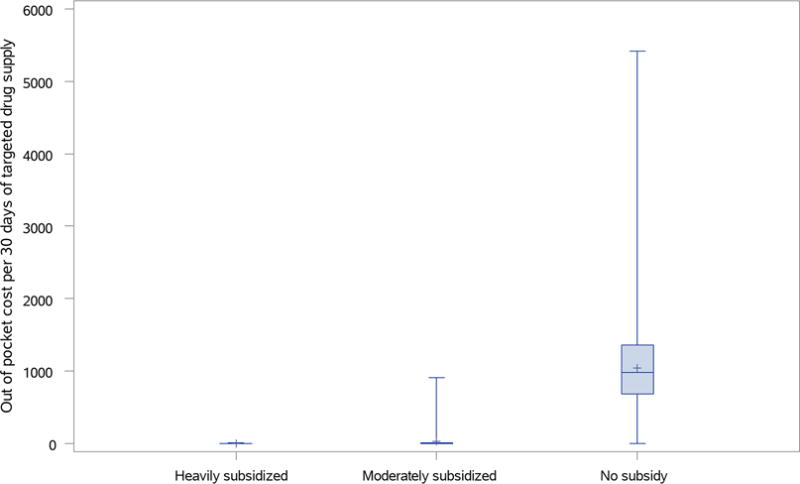
Out of pocket cost per 30 days of targeted drug supply by subsidy status.
Table 3 presents the results from the logistic regression for the whole cohort. Adjusted for all factors included in the model, the regression still showed that the heavily subsidized group was much more likely to be non-adherent compared with the non-subsidized group with adjusted odds ratio of 6.69 (95% CI: 2.81~15.9). Moderately subsidized patients were also more likely to have non-adherence (OR=2.99, 95% CI: 1.38~6.46) than patients without subsidy. Unsurprisingly, controlling for all other factors, patients with higher OOP payments per 30 days of supply were more likely to have TKI medication non-adherence issues compared to individuals with lower OOP payments. The odds ratio associated with a doubling of OOP costs per 30 days of supply was 1.12 (95% CI: 1.02~1.22); the corresponding odds ratio for OOP costs for other drugs was 1.1 (95% CI: 1.01~1.19). None of the residence related variables (i.e., urban/rural status, region, and neighborhood socioeconomic status variables) were significantly associated with non-adherence to TKI therapy. Table 3 also includes results when the model excludes the OOP cost variables. After excluding the two cost variables, the magnitude of association between heavy subsidy and non-adherence reduced significantly (OR=1.7, 95% CI: 1.13~2.55); and the association between moderate subsidy and non-adherence became insignificant.
Table 3.
Multivariable Logistic Model for Non-adherence
| Full Model | Model Excluding OOP cost variables | |||||
|---|---|---|---|---|---|---|
|
| ||||||
| Covariates | Odds Ratio | CI | P value | Odds Ratio | CI | P value |
| Cohort year | ||||||
| 2007 | 1.85 | (0.77,4.42) | 0.169 | 1.99 | (0.84,4.70) | 0.118 |
| 2008 | 1.45 | (0.65,3.22) | 0.366 | 1.56 | (0.71,3.45) | 0.271 |
| 2009 | 1 | (0.45,2.25) | 0.992 | 1.12 | (0.50,2.49) | 0.784 |
| 2010 | 0.94 | (0.42,2.11) | 0.886 | 1.03 | (0.46,2.28) | 0.95 |
| 2011 | 1.29 | (0.58,2.88) | 0.534 | 1.27 | (0.57,2.82) | 0.552 |
| 2012 | Reference | Reference | ||||
| Sex | ||||||
| Male | 0.92 | (0.68,1.26) | 0.624 | 0.93 | (0.68,1.26) | 0.623 |
| Female | Reference | Reference | ||||
| Age | ||||||
| 70 or younger | Reference | Reference | ||||
| older than 70 | 1.26 | (0.92,1.74) | 0.151 | 1.31 | (0.96,1.80) | 0.094 |
| Race | ||||||
| White | Reference | Reference | ||||
| Non-white | 0.97 | (0.63,1.49) | 0.873 | 0.95 | (0.62,1.46) | 0.82 |
| Plan type | ||||||
| Medicare prescription drug plan(PDP) | 0.73 | (0.51,1.06) | 0.095 | 0.82 | (0.58,1.18) | 0.29 |
| Managed Care Organizations or Regional PPO or Employer Sponsored | Reference | Reference | ||||
| Cost share group | ||||||
| Heavily subsidized | 6.69 | (2.81,15.9) | <.001 | 1.7 | (1.13,2.55) | 0.01 |
| Moderately subsidized | 2.99 | (1.38,6.46) | 0.005 | 1.05 | (0.64,1.72) | 0.837 |
| No subsidy | Reference | Reference | ||||
| Logged TKI drug payment per month supply | ||||||
| 1.12 | (1.02,1.22) | 0.013 | N/A | |||
| Logged other drug payments | ||||||
| 1.1 | (1.01,1.19) | 0.023 | N/A | |||
| Urban/rural status | ||||||
| Metropolitan | 0.96 | (0.56,1.67) | 0.892 | 0.94 | (0.55,1.62) | 0.825 |
| Non-Metropolitan | Reference | Reference | ||||
| Region | ||||||
| Northeast | 0.85 | (0.51,1.42) | 0.531 | 0.86 | (0.52,1.43) | 0.561 |
| Midwest | 0.71 | (0.38,1.31) | 0.268 | 0.76 | (0.41,1.40) | 0.377 |
| South | 0.84 | (0.52,1.37) | 0.491 | 0.89 | (0.55,1.44) | 0.639 |
| West | Reference | Reference | ||||
| Census tract median income in quartile | ||||||
| First quartile | 0.89 | (0.29,2.75) | 0.843 | 0.87 | (0.28,2.66) | 0.806 |
| Second quartile | 1.18 | (0.51,2.76) | 0.698 | 1.16 | (0.50,2.69) | 0.735 |
| Third quartile | 0.84 | (0.44,1.60) | 0.587 | 0.83 | (0.44,1.57) | 0.564 |
| Fourth quartile | Reference | Reference | ||||
| Census tract % below poverty level in quartile | ||||||
| First quartile | 1 | (0.42,2.37) | 0.999 | 1.03 | (0.44,2.42) | 0.946 |
| Second quartile | 0.87 | (0.43,1.77) | 0.701 | 0.91 | (0.45,1.82) | 0.781 |
| Third quartile | 0.97 | (0.53,1.78) | 0.933 | 1.03 | (0.57,1.87) | 0.913 |
| Fourth quartile | Reference | Reference | ||||
| Census tract % college in quartile | ||||||
| First quartile | 0.96 | (0.48,1.92) | 0.907 | 1.02 | (0.51,2.02) | 0.964 |
| Second quartile | 0.8 | (0.44,1.47) | 0.474 | 0.84 | (0.46,1.53) | 0.564 |
| Third quartile | 1.14 | (0.65,1.98) | 0.647 | 1.2 | (0.69,2.09) | 0.509 |
| Fourth quartile | Reference | Reference | ||||
Table 4 presents the subgroup analyses for patients with and without subsidies using a multivariable logistic model. The analyses showed different effects of various factors in these two subgroups. For example, in the subgroup without subsidies, older patients (greater than 70 years old vs 70 and below) were more likely to be non-adherent (OR=1.86, 95% CI: 1.2~2.88) while in the subgroup with subsidies, older patients had an odds ratio of 0.86 albeit statistically insignificant. In the subgroup without subsidies, patients with a Medicare prescription drug plan (PDP) were significantly associated with lower likelihood of non-adherence (OR=0.63, 95% CI: 0.4~0.99); in the subgroup with subsidies, the association was opposite albeit insignificant.
Table 4.
Multivariable Logistic Model for Non-adherence in the Subgroups with and without Subsidies
| Subgroup with subsidies | Subgroup without subsidies | |||||
|---|---|---|---|---|---|---|
|
| ||||||
| Covariates | Odds Ratio | CI | P value | Odds Ratio | CI | P value |
| Cohort year | ||||||
| 2007 | 0.69 | (0.17,2.77) | 0.6 | 3.34 | (0.95,11.8) | 0.061 |
| 2008 | 0.7 | (0.19,2.52) | 0.586 | 1.92 | (0.59,6.22) | 0.279 |
| 2009 | 0.23 | (0.06,0.89) | 0.033 | 2.19 | (0.68,7.02) | 0.187 |
| 2010 | 0.33 | (0.09,1.22) | 0.097 | 1.67 | (0.51,5.42) | 0.396 |
| 2011 | 0.27 | (0.07,1.03) | 0.056 | 3.22 | (1.01,10.3) | 0.048 |
| 2012 | Reference | Reference | ||||
| Sex | ||||||
| Male | 1.04 | (0.62,1.75) | 0.882 | 0.84 | (0.56,1.27) | 0.419 |
| Female | Reference | Reference | ||||
| Age | ||||||
| 70 or younger | Reference | Reference | ||||
| older than 70 | 0.86 | (0.50,1.48) | 0.585 | 1.86 | (1.20,2.88) | 0.006 |
| Race | ||||||
| White | Reference | Reference | ||||
| Non-white | 0.97 | (0.54,1.77) | 0.93 | 1.01 | (0.50,2.02) | 0.98 |
| Plan type | ||||||
| Medicare prescription drug plan(PDP) | 1.09 | (0.51,2.30) | 0.825 | 0.63 | (0.40,0.99) | 0.046 |
| Managed Care Organizations or Regional PPO or Employer Sponsored | Reference | Reference | ||||
| Cost share group | ||||||
| Heavily subsidized | 3.51 | (1.73,7.13) | <.001 | N/A | ||
| Moderately subsidized | Reference | |||||
| Logged TKI drug payment per month supply | ||||||
| 1.32 | (1.08,1.62) | 0.007 | 1.09 | (0.98,1.20) | 0.1 | |
| Logged other drug payments | ||||||
| 1.06 | (0.93,1.22) | 0.375 | 1.11 | (0.99,1.24) | 0.071 | |
| Urban/rural status | ||||||
| Metropolitan | 0.91 | (0.39,2.14) | 0.834 | 0.91 | (0.42,2.00) | 0.82 |
| Non-Metropolitan | Reference | Reference | ||||
| Region | ||||||
| Northeast | 1.21 | (0.44,3.30) | 0.711 | 0.79 | (0.42,1.49) | 0.474 |
| Midwest | 0.79 | (0.26,2.39) | 0.678 | 0.62 | (0.28,1.36) | 0.234 |
| South | 1.21 | (0.54,2.71) | 0.639 | 0.62 | (0.32,1.21) | 0.163 |
| West | Reference | Reference | ||||
| Census tract median income in quartile | ||||||
| First quartile | 0.71 | (0.11,4.53) | 0.716 | 1.13 | (0.25,5.16) | 0.873 |
| Second quartile | 1.13 | (0.26,4.93) | 0.875 | 1.15 | (0.38,3.47) | 0.808 |
| Third quartile | 0.75 | (0.22,2.51) | 0.636 | 0.8 | (0.36,1.81) | 0.596 |
| Fourth quartile | Reference | Reference | ||||
| Census tract % below poverty level in quartile | ||||||
| First quartile | 1.24 | (0.29,5.43) | 0.771 | 0.77 | (0.25,2.39) | 0.653 |
| Second quartile | 1.39 | (0.46,4.25) | 0.56 | 0.73 | (0.28,1.94) | 0.533 |
| Third quartile | 1.36 | (0.53,3.49) | 0.527 | 0.84 | (0.37,1.90) | 0.678 |
| Fourth quartile | Reference | Reference | ||||
| Census tract % college in quartile | ||||||
| First quartile | 1.88 | (0.57,6.27) | 0.302 | 0.59 | (0.24,1.46) | 0.255 |
| Second quartile | 1.37 | (0.47,3.98) | 0.558 | 0.53 | (0.24,1.16) | 0.11 |
| Third quartile | 1.7 | (0.64,4.52) | 0.289 | 0.86 | (0.43,1.74) | 0.682 |
| Fourth quartile | Reference | Reference | ||||
Even among patients with subsidies, patients with heavily subsidized plans were much more likely (OR=3.51, 95% CI: 1.73~7.13) to be non-adherent than those with moderately subsidized plans. Higher OOP costs (i.e., a doubling of the costs) per 30 days of TKI drug supply, even in the subgroup with subsidies, were associated with a higher likelihood of non-adherence (OR=1.32, 95% CI: 1.08~1.62); the corresponding odds ratio associated with a doubling of OOP spending on other drugs was 1.06 (95% CI: 0.93~1.22), a result that is statistically insignificant. Higher OOP costs were also associated with a higher likelihood of non-adherence among the subgroup without subsidies. The odds ratio associated with a doubling of OOP costs per 30 days of TKI supply was 1.09 (95% CI: 0.98~1.2); the corresponding odds ratio associated with a doubling of OOP spending on other drugs was 1.11 (95% CI: 0.99~1.24). The two OOP cost variables for the subgroup without subsidies were not individually significant, but were jointly significant with a p-value of 0.0021.
We also examined the percentage of patients having a predicted probability of non-adherence to TKI therapy above 50% (i.e., those more likely to be non-adherent than not) based on these subgroup analyses results. The models predicted that the percentage of patients who are more likely to be non-adherent than not are 5% (without subsidy group) vs 15% (with subsidy group); this large difference further confirms the importance of subsidy status on TKI therapy adherence.
Discussion
Using SEER registry data linked with Medicare Part D claims from 2007-2012, we examined the relationship between patient cost sharing, subsidy status and non-adherence to targeted oral therapies among CML patients. We found that the OOP cost per 30 days of TKI drug supply was a strong predictor for non-adherence to TKI therapy. Patients with higher OOP costs were much more likely to have non-adherence issues. This has important implications as non-adherence to oral TKIs may lead to severe consequences from both clinical and economic perspectives.4–6,8–10 These findings are consistent with the body of literature on adherence to TKIs and OOP costs. In particular, another study15 based on CML patients under private insurance also found that patients with higher copayments were more likely to be non-adherent. However, patients under private insurance and patients under Medicare Part D plans have different characteristics. Patients under Medicare are older and Medicare Part D plans usually require both copayment and coinsurance rather than copayment alone, and OOP costs are higher because of the high price of the TKI drugs. Indeed, we found that CML patients under Medicare Part D in our study had much higher OOP costs for a 30-day supply of TKIs and the non-adherence rate was also much higher. More specifically, the median OOP cost for 30 days of supply was $452 in our cohort compared with the $30 median copayment for the privately insured patients in that study; the corresponding non-adherence rates were 29% compared with 23%, respectively.
Further, after controlling for OOP costs and other patient characteristics, we found that Medicare Part D beneficiaries with subsidies were much more likely to be non-adherent. Given the eligibility criteria for subsidies, the patients with subsidies had lower income and less economic resources. Many studies for different patient populations have shown that lower income and less economic resources is significantly associated with worse medication adherence. One systematic review26 on breast cancer showed that lower socioeconomic status was significantly associated with lower adherence to endocrine therapy. A Brazilian single-center study on CML patients found better adherence to TKIs among patients with higher socioeconomic status.27 A recent study by Winn et al focusing on TKI initiation within 180 days after CML diagnosis and subsequent TKI therapy adherence found an insignificant difference in adherence rates based on subsidy status; instead, higher initiation rates were identified for individuals with cost-sharing subsidies.22 In stark contrast, our study shows that despite substantially lower OOP costs for patients with LIS status, this population still had difficulty adhering to the TKIs. It is possible that the discrepancy in the findings is due to the inclusion of OOP costs into our analyses which separated the impact of subsidy on OOP costs out. Indeed, we found that if we excluded the OOP cost variables, the association between subsidy status and non-adherence was lowered significantly. Another explanation is the bigger sample size in our study focusing on patients who had initiated TKI therapy, resulting in 836 patients in our sample compared to 202 in the study by Winn and colleagues.
There is a vast literature on the various factors related to non-adherence to oral anticancer medications.28,29 One paper on adherence to oral TKIs among CML patients showed that there is a complex interplay of factors that influence adherence including clinical benefits, side effects, economic burden, functional status, patient knowledge and beliefs, physician interactions, lifestyle factors, behavioral management, and family support.30 Another study on CML patients in Italy found that social support, satisfaction with information received and concomitant drug burden have significant impact on adherence to imatinib therapy.31 Some studies have shown that there can be associations between number of physician visits and the adherence to oral anticancer medications. On the one hand, more follow-up visits may help improve adherence;32,33 on the other hand, nonadherence may lead to higher number of physician visits.34,35 To examine the association between number of physician visits and nonadherence among patients, we identified a subgroup of patients who had continuous Medicare Parts A and B enrollment and no Health Management Organization (HMO) enrollment during the 6 months after TKI initiation to ensure completeness of medical claims. For this subgroup, we calculated the number of outpatient visits during the 6 months based on the medical claims. We found no statistically significant difference (t-test p-value=0.75) in adherence. Out of the 529 patients in this subgroup, 375 were adherent to TKI treatment, while 154 were non-adherent. The mean numbers of visits were 22.79 and 23.16 for the adherent and non-adherent group, respectively, and standard deviations were: 11.89 vs. 12.14. Therefore, it is likely that many of these other factors such as social support, health literacy, patient mental conditions and relationship with oncologists played a more prominent role in the higher non-adherence among patients who received low-income subsidies. For example, some of these patients may have had worse functional status, inadequate knowledge about the adverse impact of non-adherence to TKI therapy, less than satisfactory physician interactions, poor behavior management and little family support. The fact that the lower OOP costs did not completely mediate the impact of lower socioeconomic status on non-adherence implies that future strategies to promote better adherence to oral TKIs and reduce socioeconomic disparities should consider many dimensions other than reducing the OOP cost burden on patients. Studies have shown that educational, behavioral, affective, and multidimensional interventions improve adherence to medications.28,36 Focus group studies or surveys, and interventional studies improving social support and patient education among CML patients would be interesting future research directions.
This study is based on SEER registry data linked with Medicare Part D claims, and therefore was constrained by the availability and accuracy of the information available in registry and claims data. For example, some of the adverse side effects of TKIs, such as rash and headache, are difficult to capture in claims data. Therefore, we were not able to assess the impact of adverse effects on adherence. If patients received free TKIs through patient assistance programs, it would not be captured in the Medicare insurance claims. There are many charity foundations that help patients receive anticancer medications.37–39 Therefore, the adherence rate may be underestimated. Because the healthcare system in the U.S. is different from the rest of world, some of the results in this paper may not apply to other countries. However, one major finding of this study is that CML patients with less financial means still have much lower adherence even when they are heavily subsidized (and hence have very low out-of-pocket costs for the TKIs). Such a finding should have relevance to other countries even if they have universal health coverage and relatively low out-of-pocket costs. Nevertheless, to the best of our knowledge, the current study is the first in the literature to examine the impact of cost sharing on drug adherence among CML patients under Medicare Part D plans. We confirmed the impact of OOP costs on adherence, and found that patients with subsidies had much worse adherence. Our results indicate the urgent need to find ways in which adherence to TKIs, an important drug class that is a first-line treatment for CML, can be improved among low-income patients with limited economic resources.
Supplementary Material
Acknowledgments
This study used the linked SEER-Medicare database. The interpretation and reporting of these data are the sole responsibility of the authors. We acknowledge the efforts of the Applied Research Program, National Cancer Institute, the Office of Research, Development and Information, Centers for Medicare & Medicaid Services, Information Management Services Inc., and the SEER Program tumor registries in the creation of the SEER-Medicare database. We thank Gary Deyter for his editorial assistance.
Funding: This work was supported in part by the Duncan Family Institute, the Agency for Healthcare Research and Quality (R01 HS020263), and the National Cancer Institute (R01 CA207216).
Footnotes
Conflicts of Interest Statement: The authors declare no conflicts of interest.
Author Contributions: All authors contributed to the planning, conduct, and reporting of the work described in the article; CS is responsible for the overall content as guarantor.
References
- 1.Afghahi A, Sledge GW., Jr Targeted Therapy for Cancer in the Genomic Era. Cancer journal (Sudbury, Mass) 2015 Jul-Aug;21(4):294–298. doi: 10.1097/PPO.0000000000000135. [DOI] [PubMed] [Google Scholar]
- 2.Gambacorti-Passerini C, Antolini L, Mahon FX, et al. Multicenter independent assessment of outcomes in chronic myeloid leukemia patients treated with imatinib. Journal of the National Cancer Institute. 2011 Apr 6;103(7):553–561. doi: 10.1093/jnci/djr060. [DOI] [PubMed] [Google Scholar]
- 3.Santos FP, Kantarjian H, Quintas-Cardama A, Cortes J. Evolution of therapies for chronic myelogenous leukemia. Cancer journal (Sudbury, Mass) 2011 Nov-Dec;17(6):465–476. doi: 10.1097/PPO.0b013e31823dec8d. [DOI] [PMC free article] [PubMed] [Google Scholar]
- 4.Jabbour E, Cortes J, Kantarjian H. Long-term outcomes in the second-line treatment of chronic myeloid leukemia: a review of tyrosine kinase inhibitors. Cancer. 2011 Mar 1;117(5):897–906. doi: 10.1002/cncr.25656. [DOI] [PMC free article] [PubMed] [Google Scholar]
- 5.Ibrahim AR, Eliasson L, Apperley JF, et al. Poor adherence is the main reason for loss of CCyR and imatinib failure for chronic myeloid leukemia patients on long-term therapy. Blood. 2011 Apr 7;117(14):3733–3736. doi: 10.1182/blood-2010-10-309807. [DOI] [PMC free article] [PubMed] [Google Scholar]
- 6.Marin D, Bazeos A, Mahon FX, et al. Adherence is the critical factor for achieving molecular responses in patients with chronic myeloid leukemia who achieve complete cytogenetic responses on imatinib. Journal of clinical oncology: official journal of the American Society of Clinical Oncology. 2010 May 10;28(14):2381–2388. doi: 10.1200/JCO.2009.26.3087. [DOI] [PMC free article] [PubMed] [Google Scholar]
- 7.Shih YC, Smieliauskas F, Geynisman DM, Kelly RJ, Smith TJ. Trends in the Cost and Use of Targeted Cancer Therapies for the Privately Insured Nonelderly: 2001 to 2011. Journal of clinical oncology: official journal of the American Society of Clinical Oncology. 2015 Jul 1;33(19):2190–2196. doi: 10.1200/JCO.2014.58.2320. [DOI] [PMC free article] [PubMed] [Google Scholar]
- 8.Darkow T, Henk HJ, Thomas SK, et al. Treatment interruptions and non-adherence with imatinib and associated healthcare costs: a retrospective analysis among managed care patients with chronic myelogenous leukaemia. PharmacoEconomics. 2007;25(6):481–496. doi: 10.2165/00019053-200725060-00004. [DOI] [PubMed] [Google Scholar]
- 9.Knopf KB, Divino V, McGarry L, et al. Economic Burden of Tyrosine Kinase Inhibitor Treatment Failure in Chronic Myeloid Leukemia. Clinical lymphoma, myeloma & leukemia. 2015 Aug 5; doi: 10.1016/j.clml.2015.07.647. [DOI] [PubMed] [Google Scholar]
- 10.Wu EQ, Johnson S, Beaulieu N, et al. Healthcare resource utilization and costs associated with non-adherence to imatinib treatment in chronic myeloid leukemia patients. Current medical research and opinion. 2010 Jan;26(1):61–69. doi: 10.1185/03007990903396469. [DOI] [PubMed] [Google Scholar]
- 11.Neugut AI, Subar M, Wilde ET, et al. Association between prescription co-payment amount and compliance with adjuvant hormonal therapy in women with early-stage breast cancer. Journal of clinical oncology: official journal of the American Society of Clinical Oncology. 2011 Jun 20;29(18):2534–2542. doi: 10.1200/JCO.2010.33.3179. [DOI] [PMC free article] [PubMed] [Google Scholar]
- 12.Goldman DP, Joyce GF, Escarce JJ, et al. Pharmacy benefits and the use of drugs by the chronically ill. Jama. 2004 May 19;291(19):2344–2350. doi: 10.1001/jama.291.19.2344. [DOI] [PubMed] [Google Scholar]
- 13.Huskamp HA, Deverka PA, Epstein AM, Epstein RS, McGuigan KA, Frank RG. The effect of incentive-based formularies on prescription-drug utilization and spending. The New England journal of medicine. 2003 Dec 4;349(23):2224–2232. doi: 10.1056/NEJMsa030954. [DOI] [PubMed] [Google Scholar]
- 14.Huskamp HA, Deverka PA, Epstein AM, et al. Impact of 3-tier formularies on drug treatment of attention-deficit/hyperactivity disorder in children. Archives of general psychiatry. 2005 Apr;62(4):435–441. doi: 10.1001/archpsyc.62.4.435. [DOI] [PMC free article] [PubMed] [Google Scholar]
- 15.Dusetzina SB, Winn AN, Abel GA, Huskamp HA, Keating NL. Cost sharing and adherence to tyrosine kinase inhibitors for patients with chronic myeloid leukemia. Journal of clinical oncology: official journal of the American Society of Clinical Oncology. 2014 Feb 1;32(4):306–311. doi: 10.1200/JCO.2013.52.9123. [DOI] [PubMed] [Google Scholar]
- 16.Howlader NNA, Krapcho M, Garshell J, Miller D, Altekruse SF, Kosary CL, Yu M, Ruhl J, Tatalovich Z, Mariotto A, Lewis DR, Chen HS, Feuer EJ, Cronin KA, editors. SEER Cancer Statistics Review, 1975–2012. National Cancer Institute; Bethesda, MD: 2015. http://seer.cancer.gov/csr/1975_2012/, based on November 2014 SEER data submission, posted to the SEER web site, April 2015. [Google Scholar]
- 17.Medpac MPAC. Report to the Congress: Medicare payment Policy. 2015 http://www.medpac.gov/documents/reports/chapter-14-status-report-on-part-d-(march-2015-report).pdf.
- 18.Yala SM, Duru OK, Ettner SL, Turk N, Mangione CM, Brown AF. Patterns of prescription drug expenditures and medication adherence among medicare part D beneficiaries with and without the low-income supplement. BMC health services research. 2014;14:665. doi: 10.1186/s12913-014-0665-3. [DOI] [PMC free article] [PubMed] [Google Scholar]
- 19.Duru OK, Edgington S, Mangione C, et al. Association of Medicare Part D low-income cost subsidy program enrollment with increased fill adherence to clopidogrel after coronary stent placement. Pharmacotherapy. Dec. 2014;34(12):1230–1238. doi: 10.1002/phar.1502. [DOI] [PMC free article] [PubMed] [Google Scholar]
- 20.Doshi JA, Li P, Ladage VP, Pettit AR, Taylor EA. Impact of cost sharing on specialty drug utilization and outcomes: a review of the evidence and future directions. The American journal of managed care. 2016 Mar;22(3):188–197. [PubMed] [Google Scholar]
- 21.Doshi JA, Li P, Huo H, et al. High cost sharing and specialty drug initiation under Medicare Part D: a case study in patients with newly diagnosed chronic myeloid leukemia. The American journal of managed care. 2016 Mar;22(4 Suppl):s78–86. [PubMed] [Google Scholar]
- 22.Winn AN, Keating NL, Dusetzina SB. Factors Associated With Tyrosine Kinase Inhibitor Initiation and Adherence Among Medicare Beneficiaries With Chronic Myeloid Leukemia. Journal of clinical oncology: official journal of the American Society of Clinical Oncology. 2016 Dec 20;34(36):4323–4328. doi: 10.1200/JCO.2016.67.4184. [DOI] [PMC free article] [PubMed] [Google Scholar]
- 23.National Cancer Institute (NCI) The Surveillance, Epidemiology, and End Results (SEER) Program: Site Recode ICD-O-3/WHO 2008 Definition. https://seer.cancer.gov/siterecode/icdo3_dwhoheme/index.html.
- 24.Hess LM, Raebel MA, Conner DA, Malone DC. Measurement of adherence in pharmacy administrative databases: a proposal for standard definitions and preferred measures. The Annals of pharmacotherapy. 2006 Jul-Aug;40(7–8):1280–1288. doi: 10.1345/aph.1H018. [DOI] [PubMed] [Google Scholar]
- 25.Betcher J, Dow E, Khera N. Oral Chemotherapy in Patients with Hematological Malignancies-Care Process, Pharmacoeconomic and Policy Implications. Current hematologic malignancy reports. 2016 Aug;11(4):288–294. doi: 10.1007/s11899-016-0325-2. [DOI] [PubMed] [Google Scholar]
- 26.Roberts MC, Wheeler SB, Reeder-Hayes K. Racial/Ethnic and socioeconomic disparities in endocrine therapy adherence in breast cancer: a systematic review. American journal of public health. 2015 Jul;105(Suppl 3):e4–e15. doi: 10.2105/AJPH.2014.302490. [DOI] [PMC free article] [PubMed] [Google Scholar]
- 27.de Almeida MH, Pagnano KB, Vigorito AC, Lorand-Metze I, de Souza CA. Adherence to tyrosine kinase inhibitor therapy for chronic myeloid leukemia: a Brazilian single-center cohort. Acta haematologica. 2013;130(1):16–22. doi: 10.1159/000345722. [DOI] [PubMed] [Google Scholar]
- 28.Partridge AH, Avorn J, Wang PS, Winer EP. Adherence to therapy with oral antineoplastic agents. Journal of the National Cancer Institute. 2002 May 1;94(9):652–661. doi: 10.1093/jnci/94.9.652. [DOI] [PubMed] [Google Scholar]
- 29.Ruddy K, Mayer E, Partridge A. Patient adherence and persistence with oral anticancer treatment. CA: a cancer journal for clinicians. 2009 Jan-Feb;59(1):56–66. doi: 10.3322/caac.20004. [DOI] [PubMed] [Google Scholar]
- 30.Gater A, Heron L, Abetz-Webb L, et al. Adherence to oral tyrosine kinase inhibitor therapies in chronic myeloid leukemia. Leukemia research. 2012 Jul;36(7):817–825. doi: 10.1016/j.leukres.2012.01.021. [DOI] [PubMed] [Google Scholar]
- 31.Efficace F, Baccarani M, Rosti G, et al. Investigating factors associated with adherence behaviour in patients with chronic myeloid leukemia: an observational patient-centered outcome study. British Journal of Cancer. 2012 Sep 4;107(6):904–909. doi: 10.1038/bjc.2012.348. [DOI] [PMC free article] [PubMed] [Google Scholar]
- 32.Timmers L, Boons CCLM, Verbrugghe M, van den Bemt BJF, Van Hecke A, Hugtenburg JG. Supporting adherence to oral anticancer agents: clinical practice and clues to improve care provided by physicians, nurse practitioners, nurses and pharmacists. BMC Cancer. 2017;17(1):122. doi: 10.1186/s12885-017-3110-2. 2017/02/10. [DOI] [PMC free article] [PubMed] [Google Scholar]
- 33.Schneider SM, Hess K, Gosselin T. INTERVENTIONS TO PROMOTE ADHERENCE WITH ORAL AGENTS. Seminars in oncology nursing. 2011 May;27(2):133–141. doi: 10.1016/j.soncn.2011.02.005. [DOI] [PMC free article] [PubMed] [Google Scholar]
- 34.Kartashov A, Delea TE, Sharma PP. Retrospective study of predictors and consequences of nonadherence with lapatinib (LAP) in women with metastatic breast cancer (MBC) who were previously treated with trastuzumab. Journal of Clinical Oncology. 2012;30(15_suppl):e11067–e11067. doi: 10.1177/8755122513513428. [DOI] [PMC free article] [PubMed] [Google Scholar]
- 35.Geynisman DM, Wickersham KE. Adherence to targeted oral anticancer medications. Discovery medicine. 2013 Apr;15(83):231–241. [PMC free article] [PubMed] [Google Scholar]
- 36.Abughosh SM, Wang X, Serna O, et al. A Pharmacist Telephone Intervention to Identify Adherence Barriers and Improve Adherence Among Nonadherent Patients with Comorbid Hypertension and Diabetes in a Medicare Advantage Plan. Journal of managed care & specialty pharmacy. 2016 Jan;22(1):63–73. doi: 10.18553/jmcp.2016.22.1.63. [DOI] [PMC free article] [PubMed] [Google Scholar]
- 37.American Society of Clinical Oncology. Financial Resources. http://www.cancer.net/navigating-cancer-care/financial-considerations/financial-resources. Accessed 8/10, 2017.
- 38.CancerCare. Sources of Financial Assistance. https://www.cancercare.org/publications/62-sources_of_financial_assistance. Accessed 8/10, 2017.
- 39.American Cancer Society. Help Paying for Prescription Drugs. https://www.cancer.org/treatment/finding-and-paying-for-treatment/understanding-health-insurance/if-you-have-trouble-paying-a-bill/prescription-drug-assistance-programs.html. Accessed 8/10, 2017.
Associated Data
This section collects any data citations, data availability statements, or supplementary materials included in this article.