

Abstract
Introduction
To examine the association between sedentary behavior (SB), cardiometabolic risk factors, and self-reported physical function by level of moderate-vigorous physical activity (MVPA).
Methods
Cross-sectional analysis was completed on 1, 914 older adults aged ≥65 years from the 2003–2006 U.S. National Health and Nutrition Examination Survey (NHANES). MVPA and SB were derived from Actigraph accelerometers worn for one week. MVPA was categorized as sufficient to meet the current U.S. guidelines (≥150 minutes/week) or not; SB was split into quartiles. Various biomarkers were examined in laboratory analyses and physical exams, and the number of functional limitations was self-reported. Statistical interaction between SB and MVPA on the biomarker associations was the primary analysis, followed by an examination of their independent associations with relevant covariate adjustment.
Results
Average SB was 9.4±2.3 hours/day (mean ± SD) and approximately 35% were classified as sufficiently active. Overall, no significant meaningful statistical interactions were found between SB and MVPA for any of the outcomes; however, strong independent positive associations were found between SB and weight (p<0.01), BMI (p<0.01), waist circumference (p<0.01), C-reactive protein (CRP) (p<0.01), plasma glucose (p=0.04), and number of functional limitations (p<0.01) after adjustment for MVPA. Similarly, MVPA was negatively associated with weight (p=0.01), BMI (p<0.01), waist circumference (p<0.01), diastolic blood pressure (p=0.04), CRP (p<0.01), and number of functional limitations (p<0.01) after adjustment for SB.
Conclusion
The results suggest that sufficient MVPA did not ameliorate the negative associations between SB and cardiometabolic risk factors or functional limitations in the current sample and that there was independence on a multiplicative scale in their associations with the outcomes examined. Thus, older adults may benefit from the joint prescription to accumulate adequate MVPA and avoid prolonged sitting.
Keywords: NHANES, aging, physical function, sitting, cardiometabolic risk
INTRODUCTION
Sedentary behavior (SB), defined as participation in activities such as sitting and reclining during waking hours that do not increase energy expenditure substantially (22) has been gaining increased focus in physical activity and health research. Traditionally, SB has been used to describe limited participation in moderate-vigorous physical activity (MVPA); however, research linking prolonged sitting, to adverse health outcomes, while controlling for MVPA, has provided the evidence needed to identify SB as an independent behavior of interest. In particular, SB, or proxy measures such as television viewing, have been shown to be associated with an increased risk of obesity (14), cancer (12), metabolic syndrome (9), type 2 diabetes (14), and all-cause mortality (16) in various populations. There has been very limited research focusing on adults aged ≥65 years despite evidence to suggest older adults represent the most sedentary age group, spending approximately 60% to 70% of their waking hours in SB (19).
Studies that have examined the association between SB and health outcomes in older adults have typically focused on metabolic syndrome and other cardiometabolic risk factors. For instance, increased risk of overweight/obesity, as measured by BMI, was associated with a self-reported TV viewing time of >840 minutes/week in 1,806 Japanese older adults (15). Also, significant associations have been found for objectively measured SB time with lower limb (6), central (25) and total body adiposity (6, 25) measured using dual energy x-ray absorptiometry. Data from a sample of 649 older adults who wore accelerometers in the Health Survey for England demonstrated direct associations for self-reported SB and TV time with a ratio of total to HDL cholesterol, and for objectively measured SB with waist circumference (24). In the AusDiab study, increased odds of having metabolic syndrome and several of its components were found in higher quartiles of self-reported SB and TV time (11). Finally, data from a nationally representative U.S. sample of 1,367 older adults from The National Health and Nutrition Examination Survey (NHANES) was used to examine the risk of metabolic syndrome associated with different parameters of accelerometer-derived SB (1). An increased odds of metabolic syndrome in those with greater time spent in SB was found.
The majority of the studies discussed provide evidence for an association of SB with metabolic syndrome and other cardiometabolic risk factors while controlling for participation in physical activity using multivariate regression techniques. We believe an examination of the association between SB and health outcomes stratified by level of MVPA, in addition to analyses statistically removing its effect, is worthwhile because it specifically answers the question of whether or not SB is associated with deleterious health effects in those that are sufficiently or insufficiently active. Additionally, to our knowledge, just one study (21) has examined the association between physical function and objectively measured SB time in older adults, and this study did not examine the interaction between SB and MVPA. Therefore, the purpose of this study was to examine the association between SB, various cardiometabolic risk factors, and self-reported physical function by strata of MVPA participation. We hypothesized that there would be a statistical interaction between MVPA and SB on the various outcomes in a sample of older adults from the 2003–2006 NHANES. More specifically, we hypothesized there would be an association between SB and the outcomes in those with insufficient MVPA, but not in those who met the current physical activity guidelines (27).
METHODS
Study Population
NHANES is a continual population based survey of the United States conducted by the National Center for Health Statistics consisting of two main parts: an in-home interview and a comprehensive medical exam that includes a series of laboratory tests (2). Objective assessment of ambulatory activity was added to the medical exam portion of NHANES between 2003 and 2006. A total of 14,616 individuals aged 6 years and older participated in this portion of the study, of which 12,721 had valid activity monitor data, defined in the following section. The sample was refined to include only adults aged ≥65 years (n=2,005). The final study sample (n=1, 914) met the above criteria in addition to having complete information for all relevant outcomes and covariates. In separate analyses that included outcomes requiring a 12-hour fasting blood draw data, a subsample of 809 older adults was used. The National Center for Health Statistics Research Ethics Review Board approval and documented consent was obtained from all participants.
Sedentary Behavior and Physical Activity Assessment
Participants were instructed to wear the ActiGraph AM-7164 (ActiGraph, Fort Walton Beach, FL) for one week on an elastic belt over the right hip during all waking hours except in situations with the possibility of water damage. Data, in the form of activity counts per 1-minute epoch, were downloaded from the monitors upon receipt by mail. Estimation of wear time and time spent in SB and MVPA were completed according to generally accepted methods. Nonwear was defined as periods of at least 60 consecutive minutes of no activity with an allowance for two consecutive minutes of observations between 1 and 100 counts. Wear-time of the monitor was determined by subtracting nonwear-time from total daily observation time.
Time spent in SB and MVPA was estimated by summing minutes for observations falling within established cut points for counts. The amount of time spent in activity of less than 100 counts per minute was considered SB and averaged across valid days to provide an average daily duration (hours/day). Time spent in 10+ minute bouts above 760 counts per minute (18) with an allowance for interruptions of 1 or 2 minutes below threshold was considered MVPA, averaged across valid days, and multiplied by 7 to obtain an average weekly duration (minutes/week). A day was considered a valid day with at least 600 minutes (10 hours) of wear without excessive counts (>20,000 counts). At least one valid day was required to be included in the current analysis. Initially, an additional higher threshold of 1,952 (10) counts per minute for MVPA was considered. However, the 760 cut point was chosen because we believe it better reflects a typical older adults’ free-living moderate-intensity activity. We performed a sensitivity analysis with the 1,952 cut point (see Tables 1–4, Supplemental Digital Content 1, which are tables displaying a repeat of all analyses using the average weekly duration of time spent above 1,952 counts per minute to define moderate-vigorous intensity activity) and found similar results.
Table 1.
Participant characteristicsa
| Quartile of Sedentary Hours
|
Mod-Vig Physical Activity
|
|||||||
|---|---|---|---|---|---|---|---|---|
| 1 | 2 | 3 | 4 | Insufficient | Sufficient | |||
| 0–7.92 | 7.93–9.17 | 9.18–10.63 | ≥10.64 | p | <150 min/wk | ≥150 min/wk | p | |
| n | 481 | 483 | 472 | 478 | 1242 | 672 | ||
| Age (years) | 72.4 (5.9) | 74.6 (6.4) | 75.4 (6.6) | 76.1 (6.6) | <0.01 | 75.9 (6.6) | 72.3 (5.7) | <0.01 |
| Gender (% male) | 45.3 | 48.5 | 54.9 | 59.0 | <0.01 | 45.7 | 63.2 | <0.01 |
| Income (%) | ||||||||
| <$20k | 9.6 | 9.1 | 8.9 | 10.3 | 0.92 | 8.2 | 11.8 | <0.01 |
| $20k–$45k | 14.76 | 13.5 | 17.4 | 15.9 | 14.8 | 16.4 | ||
| $45k–$75k | 37.6 | 38.9 | 37.7 | 36.6 | 36.2 | 40.5 | ||
| >$75k | 38.1 | 38.5 | 36.0 | 37.2 | 40.7 | 31.4 | ||
| Education (%) | ||||||||
| < High school | 47.0 | 37.3 | 32.0 | 38.1 | <0.01 | 38.6 | 38.7 | 0.02 |
| High school | 23.9 | 29.4 | 27.1 | 23.4 | 27.8 | 22.6 | ||
| > High school | 29.1 | 33.3 | 40.9 | 38.5 | 33.7 | 38.7 | ||
| Marital Status (%) | ||||||||
| Married | 63.2 | 59.4 | 60.8 | 48.3 | <0.01 | 51.3 | 70.2 | <0.01 |
| Singleb | 26.6 | 31.9 | 29.5 | 40.0 | 38.7 | 19.6 | ||
| Divorced | 10.2 | 8.7 | 9.8 | 11.7 | 10.1 | 10.1 | ||
| CVDc (%) | 4.4 | 4.6 | 5.1 | 5.2 | 0.91 | 5.7 | 3.1 | 0.01 |
| Diabetes (%) | 15.2 | 20.5 | 19.9 | 22.8 | 0.02 | 23.8 | 11.8 | <0.01 |
| Current smoker (%) | 8.9 | 9.7 | 7.2 | 15.1 | <0.01 | 11.4 | 8.2 | 0.03 |
| Current drinker (%) | 41.6 | 41.2 | 39.4 | 34.1 | 0.07 | 35.3 | 46.1 | <0.01 |
Presented as mean (standard deviation) or percent of group.
The marital status category of ‘single’ includes widows.
CVD = cardiovascular disease.
Table 4.
Independent associations of sedentary behavior and moderate-vigorous physical activity with cardiometabolic riska
| Quartile of Sedentary Hours
|
Mod-Vig Physical Activity
|
|||||||
|---|---|---|---|---|---|---|---|---|
| 1 | 2 | 3 | 4 | Insufficient | Sufficient | |||
| Biomarker | 0–7.92 | 7.93–8.17 | 8.18–10.63 | ≥10.64 | ptrend | <150 min/wk | ≥150 min/wk | Pdiff |
| Weightb | 72.7 (1.8) | 75.6 (1.3) | 77.1 (1.3) | 79.6 (1.2) | <0.01 | 77.7 (1.2) | 74.7 (1.0) | 0.01 |
| BMIb | 26.6 (0.6) | 27.4 (0.5) | 27.8 (0.5) | 28.8 (0.4) | 0.01 | 28.3 (0.5) | 27.0 (0.4) | <0.01 |
| Waist Circumferenceb | 98.2 (1.6) | 100.2 (1.3) | 101.9 (1.4) | 104.4 (1.0) | <0.01 | 103.2 (1.2) | 99.2 (1.2) | <0.01 |
| Systolic BPb | 139 (1) | 138 (1) | 134 (1) | 137 (1) | 0.09 | 138 (1) | 135 (1) | 0.07 |
| Diastolic BPb | 63 (1) | 63 (2) | 59 (2) | 63 (1) | 0.32 | 63 (1) | 61 (1) | 0.04 |
| Total Cholesterolb | 190 (4) | 185 (3) | 188 (4) | 186 (4) | 0.50 | 186 (3) | 188 (3) | 0.48 |
| HDLb | 52.5 (1.0) | 50.9 (1.0) | 51.0 (1.0) | 50.9 (1.0) | 0.29 | 50.4 (1.0) | 52.1 (1.1) | 0.05 |
| HbA1Cb | 6.1 (1.0) | 6.0 (1.0) | 6.1 (1.0) | 6.1 (1.0) | 0.29 | 6.1 (1.0) | 6.1 (1.0) | 0.11 |
| CRPb | 0.24 (1.15) | 0.24 (1.12) | 0.26 (1.12) | 0.34 (1.14) | <0.01 | 0.30 (1.11) | 0.24 (1.13) | <0.01 |
| Triglyceridesc | 133.9 (1.2) | 133.1 (1.2) | 140.3 (1.2) | 133.7 (1.2) | 0.85 | 139.9 (1.1) | 130.8 (1.2) | 0.08 |
| LDLc | 93.7 (6.1) | 94.0 (5.6) | 93.1 (4.8) | 90.4 (6.0) | 0.55 | 91.9 (4.8) | 93.7 (4.9) | 0.62 |
| Plasma Glucosec | 115.0 (1.2) | 114.8 (1.2) | 119.2 (1.2) | 119.8 (1.2) | 0.04 | 116.2 (1.1) | 118.1 (1.1) | 0.31 |
Values are least squares mean (standard error), and adjusted for age, gender, ethnicity, education, income, marital status, alcohol consumption, current smoking status, cardiovascular disease, and accelerometer wear time, and BMI (except for weight, waist circumference, and BMI). Additional adjustments made for PA in the SB model and SB in the PA model. BMI=body mass index; BP = blood pressure; HDL = high-density lipoprotein; LDL = low-density lipoprotein; CRP = C-reactive protein; and HbA1c = glycated hemoglobin
n=1914.
n = 809; 12-hour fasting blood draw subsample.
Outcome and Covariate Assessment
Our outcomes of interest were as follows: anthropometric measures including weight (kg), waist circumference (cm), and body mass index (kg/m2); systolic and diastolic blood pressure (mm Hg); C-reactive protein (mg/dL); total-, HDL-, and LDL-cholesterol (mg/dL); plasma glucose (mg/dL); triglycerides (mg/dL); glycohemoglobin (%); and self-reported physical functioning. Weight, waist circumference, and blood pressure were measured directly according to standard procedures. Up to four blood pressure measurements were obtained, with all but the first being averaged for the final value (3). Twelve-hour fasting blood samples were drawn to assess total-cholesterol, HDL-cholesterol, LDL-cholesterol, triglycerides, C-reactive protein, plasma glucose, and glycohemoglobin according to standard procedure (see (4) for detail of the laboratory methods). Physical function was assessed using a questionnaire, where participants reported being limited in any of 20 activities because of physical, emotional, or mental problems (5). We operationalized reduced physical function as self-reported limitations in the following eight activities: walking for a quarter mile; walking up ten steps; stooping, crouching, or kneeling; lifting or carrying; house chores; walking between rooms on the same floor; standing up from an armless chair; and getting in and out of bed. A categorical variable with three levels was created to analyze physical functioning based on the number of limitations reported. Participants could have reported zero, one, or two or more limitations. Covariates included age, gender, ethnicity (non-Hispanic white, non-Hispanic black, Mexican, other), education (did not complete high school, completed high school, completed at least some college), marital status (married, single/widowed, divorced), family income (<$20k, $20k–$45k, $45k–$75k, and >$75k), self-reported presence of diabetes or cardiovascular disease, alcohol intake, and current smoking status. The assessment of these variables was completed via questionnaire.
Statistical Analysis
All analyses were performed in SAS 9.3 (SAS Institute, Cary, NC) using PROC SURVEY procedures to account for the complex, multistage, probability sampling design used by NHANES. Outcome variables were assessed for linearity and normality. Those found to be non-normal and thus log-transformed included systolic blood pressure, HDL-cholesterol, C-reactive protein, glycohemoglobin, triglycerides, and plasma glucose. These variables are presented in tables as geometric means. Daily SB time was split into the following quartiles based on the distribution in the whole sample: less than 7.92, 7.93 to 9.17, 9.18 to 10.53, and greater than 10.54 hours/day. Weekly MVPA time was used to create a dichotomous variable to differentiate those with sufficient activity to meet the recommended amount of ≥150 minutes/week of MVPA in bouts of at least 10 minutes (23) from those who did not. For descriptive purposes, simple linear regression analysis and logistic regression were used to examine differences in participant characteristics by quartile of SB, while independent samples t-tests and χ2 tests were used to examine differences between MVPA groups. Also, we examined the distribution of time spent in SB by level of MVPA with a histogram. The primary analyses for continuous variables consisted of an examination of the association between SB and cardiometabolic biomarkers using multiple linear regression analysis stratified by level of MVPA participation controlling for the covariates identified previously in addition to activity monitor wear time. Physical functioning was analyzed using multinomial logistic regression with a proportional-odds cumulative logit model, which estimates common odds ratios for covariate effects in the related logistic regression models for 0 vs. 1+ functional limitations and for 0–1 vs. 2+ functional limitations. Least squares means or odds ratios were estimated for each SB quartile and a linear trend was tested. Statistical significance of potential interactions was also tested using SB and MVPA as cross-product terms in the regression models. We also examined the independent effects of SB and MVPA on cardiometabolic biomarkers and physical function by mutually adjusting models for both factors.
RESULTS
Study Population
Participant characteristics can be found in Table 1. The overall sample (N=1914) had an average age of 74.6 ± 6.5 years and was 52% male. Those with higher SB were older (p<0.01) and were more likely to be male (p<0.01), less educated (p<0.01), single or divorced (p<0.01), a current smoker (p<0.01), and diabetic (p=0.02). Those who had sufficient MVPA to meet the weekly recommendations were younger (p<0.01), and were more likely to be male (p<0.01), less wealthy (p<0.01), more educated (p=0.02), married (p<0.01), and a current drinker (p<0.01) compared to those who were insufficiently active. The sufficiently active also had lower proportions of those who were current smokers (p=0.03), had diabetes (p<0.01), or had cardiovascular disease (p=0.01).
The median number of valid days the participants wore the activity monitors was 7 (5–7) (interquartile range). Approximately 35% (n=672) of the sample was classified as sufficiently active, while 65% (n=1242) was classified as insufficiently active. The sufficiently active spent 8.2 ± 2.4 hours/day in SB and 322± 304 minutes/week in MVPA, while the insufficiently active spent 9.6 ± 2.4 hours/day in SB and 18 ± 63 minutes/week (median ± interquartile range) in MVPA. As seen in Figure 1, greater proportions of the sufficiently active tend to be in the lowest categories of time spent in SB. In contrast, the insufficiently active display greater variability in their SB time.
Figure 1. Time spent in sedentary behavior by level of physical activity.
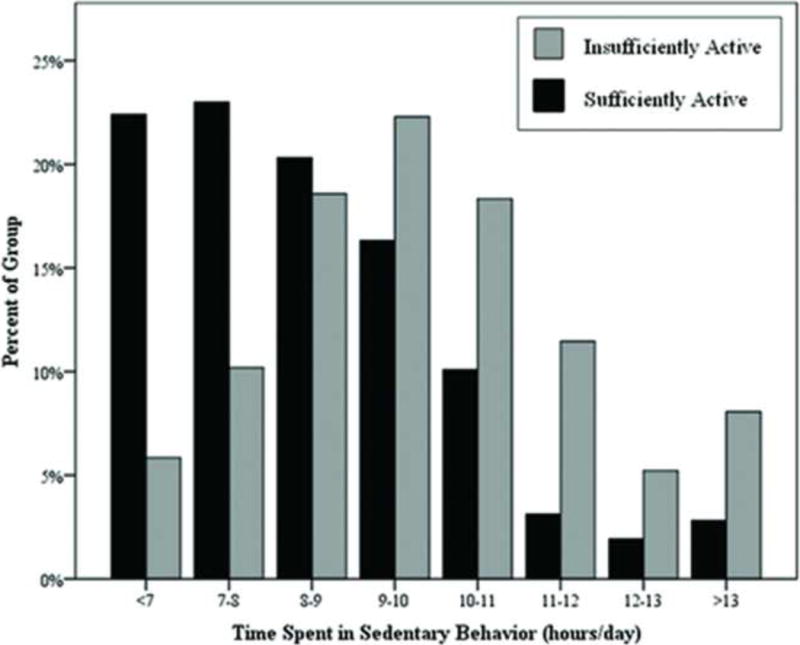
Sufficiently active is defined as ≥150 minutes/week of MVPA in bouts of at least 10 minutes.
The proportion of each activity group by hours/day spent in sedentary behavior is plotted.
Sedentary Behavior Stratified by Level of Physical Activity
Table 2 shows the results of the primary analysis to examine whether the association between SB and cardiometabolic biomarkers varied by level of MVPA. Overall, there were no statistically significant interactions between SB and MVPA. While SB was only statistically significantly associated with health outcomes in the insufficiently active, there were similar non-significant trends for the same outcomes in the sufficiently active, resulting in the non-significant interactions. Also, despite the lack of statistical significance, the magnitude of the differences was often similar between the insufficiently and sufficiently active. For instance, the change in weight from lowest to highest sedentary group was similar in both groups (6.8 kg in the insufficiently active: p=0.01; 7.6 kg in the sufficiently active: p=0.07), as was BMI (2.1 kg/m2 in the insufficiently active, p=0.02; 2.2 kg/m2 in the sufficiently active, p=0.10), and waist circumference (6.6 cm in the insufficiently active, p<0.01; 5.2 cm in the sufficiently active, p=0.05).
Table 2.
Sedentary behavior and cardiometabolic risk factors by level of moderate-vigorous physical activitya
| Quartile of Sedentary Hours
|
|||||||
|---|---|---|---|---|---|---|---|
| 1 | 2 | 3 | 4 | ||||
| Biomarker | Activity Category | 0–7.92 | 7.93–8.17 | 8.18–10.63 | ≥10.64 | ptrend | pinteraction |
| Weightb | Insufficient | 74.2 (2.5) | 77.3 (1.5) | 78.4 (1.4) | 81.0 (1.3) | 0.01 | 0.77 |
| Sufficient | 71.1 (1.6) | 73.6 (1.6) | 76.0 (1.4) | 78.7 (3.6) | 0.07 | ||
| BMIb | Insufficient | 27.4 (0.8) | 28.0 (0.6) | 28.4 (0.6) | 29.5 (0.4) | 0.02 | 0.91 |
| Sufficient | 25.9 (0.6) | 26.7 (0.6) | 27.3 (0.5) | 28.1 (1.1) | 0.10 | ||
| Waist Circumferenceb | Insufficient | 100.0 (1.9) | 102.3 (1.4) | 103.7 (1.5) | 106.6 (1.1) | <0.01 | 0.72 |
| Sufficient | 96.3 (1.6) | 98.1 (1.7) | 100.5 (1.5) | 101.5 (2.2) | 0.05 | ||
| Systolic BPb | Insufficient | 143 (1) | 138 (1) | 134 (1) | 138 (1) | 0.04 | 0.38 |
| Sufficient | 137 (1) | 137 (1) | 134 (1) | 135 (1) | 0.49 | ||
| Diastolic BPb | Insufficient | 0.50 | |||||
| Sufficient | 64 (2) 62 (1) | 63 (2) 63 (2) | 60 (2) 58 (3) | 63 (1) 61 (2) | 0.15 | 0.21 | |
| Total Cholesterolb | Insufficient | 192 (5) | 182 (4) | 187 (4) | 186 (4) | 0.39 | 0.80 |
| Sufficient | 189 (4) | 190 (3) | 192 (6) | 182 (6) | 0.32 | ||
| HDLb | Insufficient | 52.0 (1.0) | 49.5 (1.0) | 50.1 (1.1) | 50.2 (1.1) | 0.37 | 0.69 |
| Sufficient | 53.3 (1.0) | 52.6 (1.0) | 51.9 (1.1) | 50.9 (1.1) | 0.25 | ||
| HbA1cb | Insufficient | 6.12 (1.02) | 6.03 (1.02) | 6.08 (1.03) | 6.19 (1.03) | 0.23 | 0.28 |
| Sufficient | 6.08 (1.02) | 6.03 (1.02) | 6.05 (1.03) | 6.02 (1.03) | 0.63 | ||
| CRPb | Insufficient | 0.27 (1.17) | 0.25 (1.13) | 0.30 (1.13) | 0.40 (1.13) | 0.01 | 0.08 |
| Sufficient | 0.22 (1.16) | 0.24 (1.13) | 0.23 (1.13) | 0.23 (1.21) | 0.80 | ||
| Triglyceridesc | Insufficient | 150.8 (1.1) | 139.6 (1.1) | 138.7 (1.1) | 135.4 (1.1) | 0.25 | 0.05 |
| Sufficient | 123.2 (1.1) | 123.7 (1.1) | 149.3 (1.1) | 143.4 (1.1) | 0.15 | ||
| LDLc | Insufficient | 91.0 (7.8) | 91.4 (6.2) | 93.6 (4.9) | 92.1 (5.6) | 0.80 | 0.05 |
| Sufficient | 96.0 (5.5) | 99.2 (6.0) | 91.9 (6.7) | 81.1 (9.6) | 0.04 | ||
| Plasma Glucosec | Insufficient | 116.0 (1.1) | 113.0 (1.1) | 117.6 (1.1) | 119.4 (1.1) | 0.25 | 0.98 |
| Sufficient | 114.8 (1.1) | 117.2 (1.1) | 121.9 (1.1) | 118.4 (1.1) | 0.24 | ||
Values are least squares mean (standard error), and adjusted for age, gender, ethnicity, education, income, marital status, alcohol consumption, current smoking status, cardiovascular disease, accelerometer wear time, and BMI (except for weight, waist circumference, and BMI). BMI=body mass index; BP = blood pressure; HDL = high-density lipoprotein; LDL = low-density lipoprotein; CRP = C-reactive protein; and HbA1c = glycated hemoglobin.
n=1914.
n = 809; 12-hour fasting blood draw subsample.
The percentage of the sample reporting 0, 1, and 2+ functional limitations was 39.6%, 16.7% and 43.8%, respectively. The results of the analysis to determine if the association between reported functional limitations and SB is modified by MVPA participation are displayed in Table 3. For those who were insufficiently active, the odds of reporting more functional limitations was significantly reduced by half for those in the lowest three quartiles of SB (p<0.01). On the contrary, there was no reduced risk with decreasing SB in the sufficiently active (p=0.42). Similar to the findings for the cardiometabolic outcomes, the interaction effect failed to reach statistical significance (p=0.16) despite a significant trend in the insufficiently active and not the sufficiently active.
Table 3.
Odds ratio (95% Confidence Interval) for a greater number of functional limitations (0, 1, 2+) compared to the next lesser number by sedentary behavior and moderate-vigorous physical activity levela
| Quartile of Sedentary Hours
|
||||||
|---|---|---|---|---|---|---|
| 1 | 2 | 3 | 4 | |||
| Mod-Vig Physical Activity | 0–7.92 | 7.93–8.17 | 8.18–10.63 | ≥10.64 | ptrend | pinteraction |
| Insufficient | 0.48 (0.29–0.79) | 0.49 (0.34–0.69) | 0.52 (0.34–0.79) | 1.00 | <0.01 | 0.16 |
| Sufficient | 0.83 (0.43–1.62) | 0.75 (0.45–1.25) | 0.95 (0.47–1.92) | 1.00 | 0.42 | |
Adjusted for age, gender, ethnicity, education, income, marital status, alcohol consumption, current smoking status, cardiovascular disease, BMI, and accelerometer wear time.
Independent Effects of Sedentary Behavior and Physical Activity
Table 4 presents the independent associations of SB and MVPA with the cardiometabolic biomarkers after mutual adjustment. Independent of the level of MVPA, more time spent in SB was significantly related to increasing weight (p<0.01), BMI (p<0.01), waist circumference (p<0.01), C-reactive protein (p<0.01) and plasma glucose (p=0.04). Independent of time spent in SB, those with sufficient activity to meet the recommendations had lower weight (p=0.01), BMI (p<0.01), waist circumference (p<0.01), diastolic blood pressure (p=0.04), and CRP (p<0.01) than those with insufficient activity. There were also significant associations of self-reported physical function with SB (p<0.01) and MVPA (p<0.01) after mutual adjustment (Figure 2). The odds of reporting more functional limitations were 41–47% lower among those with the least SB, and were 60% lower among those with the most MVPA.
Figure 2. Independent associations between sedentary behavior, physical activity, and physical function.

Models included both SB and sufficient/insufficient MVPA and were additionally adjusted for age, gender, ethnicity, education, income, marital status, alcohol consumption, current smoking status, cardiovascular disease, BMI, and accelerometer wear time. Quartiles of SB were: ≥10.64, 10.63–9.18, 9.17–7.93, and 0–7.92 hours/day.
Sufficiently active is defined as ≥150 minutes/week of MVPA in bouts of at least 10 minutes.
DISCUSSION
We used NHANES data from the 2003–2006 to explore the hypothesis that the association between SB and the health outcomes of cardiometabolic risk and physical function, would vary by level of physical activity participation in those aged 65 years and older. Our main finding was that there were no statistically significant interactions between SB and physical activity on any of the outcomes examined. However, strong main effects of SB and physical activity on both outcomes were found through examination of their independent associations with mutual adjustment.
We were interested in examining the relative distributions of SB and MVPA within our sample of older adults to determine, for example, if there are individuals who meet current MVPA recommendations yet spend substantial time sedentary and vice versa. We found different patterns of SB accumulation between those who were sufficiently and insufficiently active (Figure 1). Approximately 80% of those who were sufficiently active accumulated less than 10 hours of SB. The insufficiently active, on the other hand, display a wide range of time spent in SB. Figure 1 also provides evidence for the existence of SB and physical activity as unique entities first postulated by Owen and colleagues (20) more than 10 years ago. The sufficiently active accumulating high amounts of daily SB are examples of the “active couch potato” while the insufficiently active with less hours of SB per day may be considered what we’ve termed “inactive busy bees”.
We hypothesized that physical activity would have provided protection against the deleterious effects of too much sitting. The finding that the associations between SB, cardiometabolic risk, and physical function are not modified by participation in MVPA that is adequate to meet the recommendations was unexpected. Studies examining the interaction between physical activity and sedentary behavior on health outcomes in older adults are rare. Inoue et al. (15) examined the joint associations between TV viewing time and MVPA sufficient to meet the current recommendations for public health with overweight/obesity using BMI in Japanese adults aged 65 to 74. They found the odds of being overweight/obese were significantly less with low TV viewing time (≤840min/week) in those with both sufficient and insufficient amounts of MVPA. Similarly, we found evidence for a trend of higher BMI with increasing sedentary time in both MVPA groups. In both studies, there was a significant association between SB and BMI that was not modified by MVPA sufficient to meet the guidelines for health benefits. The interaction between self-reported SB and MVPA on the odds of having metabolic syndrome was examined in the previously mentioned AusDiab study (11). No evidence of a statistical interaction was found between TV viewing time or overall sitting time and MVPA in this study, as well.
Analysis of an interaction between SB and MVPA on physical function has not been done in previous reports, so a comparison to previous research is not possible. It is interesting to note that the findings for physical function mirrored those for the cardiometabolic risk factors. A strong trend of lowered odds of reporting functional limitations was found in the insufficiently active. However, the interaction between SB and MVPA was not significant because there was a similar, albeit non-significant, trend in the sufficiently active. The combined result from examining the presence of the hypothesized interaction with cardiometabolic risk factors and physical function leads us to the conclusion that SB and MVPA are truly distinct. When an outcome that we investigated was found to have a significant association with SB, participating in a sufficient amount of MVPA did not affect that association. Further research is required to determine if this association is upheld in other health outcomes and with different volumes of MVPA. For instance it is still unknown whether MVPA at twice the recommended amount (≥300min/week) or at more vigorous intensities only would provide a protective effect against SB.
When examined independently, we found strong associations between SB and a number of the cardiometabolic risk factors as well as with physical function while controlling for MVPA. Several studies (1, 13) have used 2003–2006 NHANES data to examine the association between SB and cardiometabolic health in a similar fashion. Healy et al. (13) performed an analysis in 4557 adults aged ≥20 years and found significant linear trends across quartiles of SB for waist circumference, HDL-cholesterol, CRP, triglycerides, and several other outcomes we did not incorporate into our study. We did not find an association between SB and triglycerides, however our sample was limited to older adults and this association could possibly be modified by age. Similarly, Bankoski et al. (1) also did not find an association between SB and triglycerides in their sample of NHANES participants aged ≥60 years. Mentioned previously, Bankoski and associates examined the association between time spent in SB (modeled as a continuous variable), and metabolic syndrome with its determinants (modeled as categorical variables with two levels). Similar to Bankoski et al., we found a significant association between SB and waist circumference, and no association with HDL-cholesterol and blood pressure.
In regards to physical function, a recent longitudinal study using data from the Women’s Health Initiative (23) provides comparable findings to those from the current study. Nearly 62,000 women aged 50–79 years provided self-reported information on sitting habits and physical function (assessed using the RAND SF-36 where higher scores indicate better function), and were followed over an average of 12.3 years. They found that those in the higher quartiles of SB (>8–11 hours/day and >11 hours/day) had physical function scores that were 1.48 to 3.13 times lower than in those sitting less than eight hours. Similarly, we found that those in highest quartile of SB (≥10.64 hours/day) had nearly twice the odds of reporting functional limitations as those in the lower quartiles. In addition, in a study of 312 Portuguese older adults with accelerometer-derived SB and MVPA, Santos et al. (21) found SB time to be negatively associated with objectively measured physical function (β=−0.002, 95% CI −0.002, −0.001) after controlling for time spent in MVPA. Our findings are consistent with these previous studies regarding the independent association between SB and physical function.
We also found independent associations between MVPA, physical function, and several of the cardiometabolic variables. Examining the association between physical activity and health outcomes while controlling for SB is a relatively recent phenomenon. Studies have found an independent association of MVPA with risk of breast cancer (8) and its biomarkers (17). Vallance et al. (28) found a significant trend for decreasing odds of depression across increasing quartiles of time spent in MVPA after controlling for SB in adults aged ≥20 years. Also, the previously mentioned Santos et al. study (21), found a positive association between MVPA and physical function after controlling for time spent in SB. The current study adds to the growing body of evidence for the association between physical activity and health outcomes while controlling for SB.
It is of interest to note the relative size of the differences in outcomes for SB vs. MVPA when mutually adjusted. In the outcomes associated with both behaviors, the magnitude of difference from the lowest quartile of SB to the highest is similar to that found between sufficient and insufficient activity. For instance, there is 2.2 kg/m2 difference in BMI between those with approximately seven hours/day (Q1) and 12 hours/day (Q4) of SB. Likewise, the difference between those with an average of 17.5 minutes/week of MVPA and those who meet the U.S. guidelines is 1.3 kg/m2. Due to the similarity in presence and magnitude of associations between both exposures and the outcomes selected in this study, it would almost appear that the choice to participate in ≥150 minutes of MVPA or sit less than 8 hours a day are interchangeable. However, it should be noted that there was a consistent pattern in Table 2 for the sufficiently physically active with the least sedentary time to have the most favorable values in the outcomes associated with SB. In addition, the lack of statistically significant interaction on the multiplicative scale would suggest that there is evidence for an additive effect of MVPA and SB. Therefore, a recommendation of obtaining both adequate physical activity and limited SB seems most appropriate.
This study has several strengths including objective assessment of both MVPA and SB with the use of an accelerometer. Also, using NHANES data provided us with a large nationally representative sample of older adults to analyze. This particular analysis benefited from consideration of the interaction between MVPA and SB on health outcomes. As far as we know, this is the first study of its kind to complete such an examination in older adults with cardiometabolic risk factors and physical function as outcomes. Despite there not being significant meaningful interactions, this led us to the observation that, when compared side-by-side, the independent associations between MVPA and SB with the outcomes are quite similar. Future randomized controlled trials should explore the comparative effectiveness of two interventions – one a prescription to be physically active and the other to be less sedentary – to determine if this phenomenon is more than simply observational.
This study also has several limitations. One inherent in using a uniaxial accelerometer is that it is most accurate at detecting ambulatory activity, but does poorly for certain activities such as cycling and swimming. However, it is well understood that walking is a common form of physical activity in adults (7), and we purposefully selected an activity count threshold designed to capture daily physical activities of a moderate intensity (3+ METS); therefore the likelihood of under-ascertaining relevant activities is minimized. The issue of choosing count thresholds for physical activity could also be considered a limitation because there is no single agreed upon cut point that accurately describes MVPA across age groups. However, our separate analyses (see Supplemental Digital Content 1) using cut points at the low (760 counts per minute) and high (1,952 counts per minute) ends of the moderate activity spectrum revealed similar results, despite yielding a substantially lower number of participants meeting the guidelines for MVPA using the 1,952 cut point.
Another limitation of this study is its cross-sectional design, which limits our ability to make casual inferences. However, preliminary information from such study designs is necessary before significant investment is made on trials to explore these associations further. Also, despite having a large sample size, there is the possibility of limited statistical power to detect the number of multiplicative interactions that were investigated in this study. Lastly, our sample was limited to adults aged 65 years or older because out interest lies in the health behaviors and outcomes of the older adult population. Therefore, these findings cannot be generalized to a younger population. Future research will need to reproduce the analyses of this study on younger adults and adolescents. One key difference in the activity profiles of older adults as compared to younger individuals is an almost complete lack of vigorous intensity activity in the former (26). It is unknown how the presence of vigorous intensity activity found in younger individuals will impact the interaction between SB and physical activity on health outcomes.
In summary, these new findings suggest that a statistical interaction between SB and MVPA on biomarkers of cardiometabolic risk and physical function does not likely exist in this representative sample of older adults in the U.S., as the associations between SB and the various health outcomes were not modified by the level of MVPA participation. When examined individually, there were independent associations between both behaviors and similar outcomes suggesting the presence of possibly distinct pathways. Future research should explore this association with different doses of MVPA, in different age groups, and with study designs with better ability to make casual inferences.
Supplementary Material
Acknowledgments
Funding Disclosure: This work was not supported by grant funding. Results of the study do not constitute endorsement by the American College of Sports Medicine.
Footnotes
CONFLICT OF INTEREST
The authors have no conflict of interest to declare
LIST OF SUPPLEMENTAL DIGITAL CONTENT
Supplemental Digital Content 1. Tables displaying a repeat of all analyses using the average weekly duration of time spent above 1,952 counts per minute to define moderate-vigorous intensity activity. docx
References
- 1.Bankoski A, Harris TB, McClain JJ, Brychta RJ, Caserotti P, Chen KY, Berrigan D, Troiano RP, Koster A. Sedentary activity associated with metabolic syndrome independent of physical activity. Diabetes care. 2011;34(2):497–503. doi: 10.2337/dc10-0987. [DOI] [PMC free article] [PubMed] [Google Scholar]
- 2.Centers for Disease Control and Prevention (CDC), and National Center for Health Statistics (NCHS) National Health and Nutrition Examination Survey Data [Internet] Hyattsville, MD: U.S. Department of Health and Human Services, Centers for Disease Control and Prevention; [cited 2012 Jul 21]. Available from: http://www.cdc.gov/nhcs/nhanes.htm/. [Google Scholar]
- 3.Centers for Disease Control and Prevention (CDC), and National Center for Health Statistics (NCHS) National Health and Nutrition Examination Survey Examination Protocol [Internet] Hyattsville, MD: U.S. Department of Health and Human Services, Centers for Disease Control and Prevention; [cited 2012 Jul 21]. Available from: http://www.cdc.gov/nchs/data/nhanes/nhanes_05_06/PE.pdf. [Google Scholar]
- 4.Centers for Disease Control and Prevention (CDC), and National Center for Health Statistics (NCHS) National Health and Nutrition Examination Survey Laboratory Protocol [Internet] Hyattsville, MD: U.S. Department of Health and Human Services, Centers for Disease Control and Prevention; [cited 2012 Jul 21]. Available from: http://cdc.gov/nchs/nhanes/nhanes2005-2006/lab_methods_05_06.htm. [Google Scholar]
- 5.Centers for Disease Control and Prevention (CDC), and National Center for Health Statistics (NCHS) National Health and Nutrition Examination Survey Questionnaires, Examination Components and Laboratory Components 2005–2006 [Internet] Hyattsville, MD: U.S. Department of Health and Human Services, Centers for Disease Control and Prevention; [cited 2012 Jul 21]. Available from: http://www.cdc.gov/nchs/nhanes/nhanes2005-2006/questexam05_06.htm. [Google Scholar]
- 6.Chastin SF, Ferriolli E, Stephens NA, Fearon KC, Greig C. Relationship between sedentary behaviour, physical activity, muscle quality and body composition in healthy older adults. Age Ageing. 2012;41(1):111–4. doi: 10.1093/ageing/afr075. [DOI] [PubMed] [Google Scholar]
- 7.Chodzko-Zajko WJ, Proctor DN, Fiatarone Singh MA, Minson CT, Nigg CR, Salem GJ, Skinner JS, American College of Sports Medicine American College of Sports Medicine position stand. Exercise and physical activity for older adults. Med Sci Sports Exerc. 2009;41(7):1510–30. doi: 10.1249/MSS.0b013e3181a0c95c. [DOI] [PubMed] [Google Scholar]
- 8.Dallal CM, Brinton LA, Matthews CE, Lissowska J, Peplonska B, Hartman TJ, Gierach GL. Accelerometer-based measures of active and sedentary behavior in relation to breast cancer risk. Breast Cancer Res Treat. 2012 Aug;134(3):1279–90. doi: 10.1007/s10549-012-2129-y. [DOI] [PMC free article] [PubMed] [Google Scholar]
- 9.Dunstan DW, Salmon J, Owen N, Armstrong T, Zimmet PZ, Welborn TA, Cameron AJ, Dwyer T, Jolley D, Shaw JE, AusDiab Steering C. Associations of TV viewing and physical activity with the metabolic syndrome in Australian adults. Diabetologia. 2005;48(11):2254–61. doi: 10.1007/s00125-005-1963-4. [DOI] [PubMed] [Google Scholar]
- 10.Freedson PS, Melanson E, Sirard J. Calibration of the Computer Science and Applications, Inc. accelerometer. Med Sci Sports Exerc. 1998;30(5):777–81. doi: 10.1097/00005768-199805000-00021. [DOI] [PubMed] [Google Scholar]
- 11.Gardiner PA, Healy GN, Eakin EG, Clark BK, Dunstan DW, Shaw JE, Zimmet PZ, Owen N. Associations between television viewing time and overall sitting time with the metabolic syndrome in older men and women: the Australian Diabetes, Obesity and Lifestyle study. J Am Geriatr Soc. 2011;59(5):788–96. doi: 10.1111/j.1532-5415.2011.03390.x. [DOI] [PubMed] [Google Scholar]
- 12.Gierach GL, Chang SC, Brinton LA, Lacey JV, Jr, Hollenbeck AR, Schatzkin A, Leitzmann MF. Physical activity, sedentary behavior, and endometrial cancer risk in the NIH-AARP Diet and Health Study. Int j cancer. 2009;124(9):2139–47. doi: 10.1002/ijc.24059. [DOI] [PMC free article] [PubMed] [Google Scholar]
- 13.Healy GN, Matthews CE, Dunstan DW, Winkler EA, Owen N. Sedentary time and cardio-metabolic biomarkers in US adults: NHANES 2003–06. Eur Heart J. 2011;32(5):590–7. doi: 10.1093/eurheartj/ehq451. [DOI] [PMC free article] [PubMed] [Google Scholar]
- 14.Hu FB, Li TY, Colditz GA, Willett WC, Manson JE. Television watching and other sedentary behaviors in relation to risk of obesity and type 2 diabetes mellitus in women. JAMA. 2003;289(14):1785–91. doi: 10.1001/jama.289.14.1785. [DOI] [PubMed] [Google Scholar]
- 15.Inoue S, Sugiyama T, Takamiya T, Oka K, Owen N, Shimomitsu T. Television Viewing Time is Associated with Overweight/Obesity Among Older Adults, Independent of Meeting Physical Activity and Health Guidelines. J Epidemol. 2011;22(1):50–6. doi: 10.2188/jea.JE20110054. [DOI] [PMC free article] [PubMed] [Google Scholar]
- 16.Katzmarzyk PT, Church TS, Craig CL, Bouchard C. Sitting time and mortality from all causes, cardiovascular disease, and cancer. Med Sci Sports Exerc. 2009;41(5):998–1005. doi: 10.1249/MSS.0b013e3181930355. [DOI] [PubMed] [Google Scholar]
- 17.Lynch BM, Friedenreich CM, Winkler EA, Healy GN, Vallance JK, Eakin EG, Owen N. Associations of objectively assessed physical activity and sedentary time with biomarkers of breast cancer risk in postmenopausal women: findings from NHANES (2003–2006) Breast Cancer Res Treat. 2011;130(1):183–94. doi: 10.1007/s10549-011-1559-2. [DOI] [PubMed] [Google Scholar]
- 18.Matthew CE. Calibration of accelerometer output for adults. Med Sci Sports Exerc. 2005;37(11 Suppl):S512–22. doi: 10.1249/01.mss.0000185659.11982.3d. [DOI] [PubMed] [Google Scholar]
- 19.Matthews CE, Chen KY, Freedson PS, Buchowski MS, Beech BM, Pate RR, Troiano RP. Amount of time spent in sedentary behaviors in the United States, 2003–2004. AM J Epidemol. 2008;167(7):875–81. doi: 10.1093/aje/kwm390. [DOI] [PMC free article] [PubMed] [Google Scholar]
- 20.Owen N, Leslie E, Salmon J, Fotheringham MJ. Environmental determinants of physical activity and sedentary behavior. Exerc Sport Sci Rev. 2000;28(4):153–8. [PubMed] [Google Scholar]
- 21.Santos DA, Silva AM, Baptista F, Santos R, Vale S, Mota J, Sardinha LB. Sedentary behavior and physical activity are independently related to functional fitness in older adults. Exp Gerontol. 2012;47(12):908–12. doi: 10.1016/j.exger.2012.07.011. [DOI] [PubMed] [Google Scholar]
- 22.Sedentary Behaviour Research Network. Letter to the editor: standardized use of the terms “sedentary” and “sedentary behaviours”. Appl Physiol Nutr Metab. 2012;37(3):540–2. doi: 10.1139/h2012-024. [DOI] [PubMed] [Google Scholar]
- 23.Seguin R, Lamonte M, Tinker L, Liu J, Woods N, Michael YL, Bushnell C, Lacroix AZ. Sedentary Behavior and Physical Function Decline in Older Women: Findings from the Women’s Health Initiative. J Aging Res. 2012 doi: 10.1155/2012/271589. Epub. [DOI] [PMC free article] [PubMed] [Google Scholar]
- 24.Stamatakis E, Davis M, Stathi A, Hamer M. Associations between multiple indicators of objectively-measured and self-reported sedentary behaviour and cardiometabolic risk in older adults. Prev Med. 2012;54(1):82–7. doi: 10.1016/j.ypmed.2011.10.009. [DOI] [PubMed] [Google Scholar]
- 25.Swartz AM, Tarima S, Miller NE, Hart TL, Grimm EK, Rote AE, Strath SJ. Prediction of body fat in older adults by time spent in sedentary behavior. J Aging Phys Act. 2012;20(3):332–44. doi: 10.1123/japa.20.3.332. [DOI] [PubMed] [Google Scholar]
- 26.Troiano RP, Berrigan D, Dodd KW, Masse LC, Tilert T, McDowell M. Physical activity in the United States measured by accelerometer. Med Sci Sports Exerc. 2008;40(1):181–8. doi: 10.1249/mss.0b013e31815a51b3. [DOI] [PubMed] [Google Scholar]
- 27.U.S. Department of Health and Human Services. Physical Activity Guidelines Advisory Committee Report, 2008 [Internet] Washington, DC: U.S. Department of Health and Human Services; Physical Activity Guidelines Advisory Committee. [Cited 2008 July 28]. Available from: http://www.health.gov/paguidelines/Report/pdf/CommitteeReport.pdf. [Google Scholar]
- 28.Vallance JK, Winkler EA, Gardiner PA, Healy GN, Lynch BM, Owen N. Associations of objectively-assessed physical activity and sedentary time with depression: NHANES (2005–2006) Prev Med. 2011;53(4–5):284–8. doi: 10.1016/j.ypmed.2011.07.013. [DOI] [PubMed] [Google Scholar]
Associated Data
This section collects any data citations, data availability statements, or supplementary materials included in this article.