Abstract
Objective
To summarize seven years of surveillance data for Lyme disease cases reported in Canada from 2009 to 2015.
Methods
We describe the incidence over time, seasonal and geographic distribution, demographic and clinical characteristics of reported Lyme disease cases. Logistic regression was used to explore differences between age groups, sex and year to better understand potential demographic risk factors for the occurrence of Lyme disease.
Results
The number of reported Lyme disease cases increased more than six-fold, from 144 in 2009 to 917 in 2015, mainly due to an increase in infections acquired in Canada. Most locally acquired cases were reported between May and November. An increase in incidence of Lyme disease was observed in provinces from Manitoba eastwards. This is consistent with our knowledge of range expansion of the tick vectors in this region. In the western provinces the incidence has remained low and stable. All cases reported by Alberta, Saskatchewan and Newfoundland and Labrador were acquired outside of the province, either elsewhere in Canada or abroad. There was a bimodal distribution for Lyme disease by age with peaks at 5–9 and 45–74 years of age. The most common presenting symptom was a single erythema migrans rash (74.2%) and arthritis (35.7%). Variations in the frequency of reported clinical manifestations were observed among age groups and years of study.
Conclusion
Lyme disease incidence continues to increase in Canada as does the geographic range of ticks that carry the Lyme disease bacteria. Ongoing surveillance, preventive strategies as well as early disease recognition and treatment will continue to minimize the impact of Lyme disease in Canada.
Introduction
Lyme disease, caused by the spirochete Borrelia burgdorferi sensu stricto, is the most commonly reported vector-borne disease in North America. Lyme disease is transmitted by blacklegged ticks, Ixodes scapularis, in central and eastern Canada and Ixodes pacificus in western Canada (1). Lyme disease is a multisystem infection that is manifested by progressive stages (2). In the early stage, the cutaneous erythema migrans rash appears within 30 days of infection at the site of the infective tick bite in approximately 70% of infected individuals (3). The rash can be accompanied by flu-like symptoms such as fever, fatigue, headache, myalgia or arthralgia. If left untreated, B. burgdorferi can disseminate hematogenously within three months of infection (2). Manifestations of early disseminated Lyme disease include multiple secondary erythema migrans lesions, neurologic manifestations (e.g., facial palsy and meningitis) and cardiac symptoms (e.g., heart block), which may on rare occasions be fatal (4). Over months or years, untreated early disseminated Lyme disease can progress to the late disseminated stage, when arthritis is the most common manifestation (3).
In 2004, approximately 40 human cases of Lyme disease were reported in Canada (1). In 2009, Lyme disease became nationally notifiable, with provincial and territorial health departments reporting clinician-diagnosed cases to the Canadian Notifiable Disease Surveillance System (CNDSS) of the Public Health Agency of Canada (PHAC) (5). In 2010, the Lyme Disease Enhanced Surveillance (LDES) system, designed by a working group of the Pan-Canadian Public Health Network, was implemented. This system aims to improve identification of Canadians at risk by analyzing information beyond that normally transferred to the CNDSS (6). This study aligns with the three pillars of the Federal Framework on Lyme Disease, one of which aims for “the establishment of a national medical surveillance program to use data collected by Public Health Agency of Canada to properly track incidence rates and the associated economic costs of Lyme disease” (7).
The objective of this study is to summarize seven years of surveillance data for Lyme disease cases reported in Canada from 2009 to 2015 in order to identify incidence over time, geographic and seasonal distribution, and demographic and clinical characteristics of Lyme disease cases.
Methods
Case definition
The 2009 national Lyme disease case definition during the study period (8) is shown in Table 1.
Table 1. 2009 national Lyme disease case definition.
| Confirmed case | Probable case |
|---|---|
Clinical evidence of illness with laboratory confirmation:
|
Clinical evidence of illness without a history of residence in or visit to an endemic area but with laboratory evidence of infection:
|
Abbreviations: DNA, deoxyribonucleic acid; ELISA, enzyme-linked immunosorbent assay; PCR, polymerase chain reaction
Data sources
Information on reported Lyme disease cases from 2009 to 2015 was obtained from the CNDSS and LDES system. The CNDSS collects only demographic data (age and sex), episode date and case classification. The LDES system captures additional data, including:
possible geographic location of infection, including both locally acquired and travel-related cases;
clinical manifestations; and
results of laboratory testing.
By 2015, eight provinces were participating in the LDES system: British Columbia, Alberta, Manitoba, Ontario, New Brunswick, Nova Scotia, Prince Edward Island and Newfoundland and Labrador. British Columbia did not provide data on location. Quebec and Saskatchewan provided data only through the CNDSS.
Analysis
Incidence over time
Incidence of reported Lyme disease cases in Canada was calculated by year, province, age group and sex per 100,000 population. The denominators were census population estimates for July 1 of each year of the study period (2009–2015) based on Statistics Canada data (9).
Seasonal and geographic distribution
The seasonal occurrence of cases (by month) was obtained from the reported month of onset for Lyme disease signs or symptoms in the LDES system. The most likely geographic location for acquisition of Lyme disease infection was the centroid of the census subdivision (CSD) or the municipality in which the patient was exposed to Lyme disease risk. Any cases for which there was a history of travel (within or outside of Canada) within 30 days of reporting were not included in geographic analyses. Geographic analysis of cases acquired in BC was not possible as the location of acquisition was not reported to PHAC.
Demographic and clinical characteristics
Variations among age groups, sex and years of reporting clinical manifestations were explored by logistic regression using IBM SPSS Statistics version 24 (IBM, Chicago, IL, USA). In separate models, the outcomes were absence or presence of:
erythema migrans (early Lyme disease);
neurologic and cardiac symptoms and multiple erythema migrans (early disseminated Lyme disease); and
arthritis (late disseminated Lyme disease).
For each model, explanatory variables were age group, sex and year. For the variable “age group,” two age intervals, 10 years and 15 years, were explored in each model, and the reference group were 0–9 years and 0–14 years, respectively. The variable “province” was included in the analysis to account for possible variability in reporting between provinces. The significance level for explanatory variables retained in the multivariable model was less than 0.1. The most parsimonious multivariate models were sought by backward elimination of nonsignificant variables until all factors in the model were significant (P<0.05).
Results
Incidence over time
From 2009 to 2015, a total of 3,012 Lyme disease cases were reported in Canada. The number of reported cases increased more than six-fold, from 144 in 2009 to 917 in 2015. The national incidence per 100,000 population increased from 0.4 to 2.6 (Table 2).
Table 2. Lyme disease cases per 100,000 population reported by province and year in Canada, 2009–2015.
| Province | 2009 | 2010 | 2011 | 2012 | 2013 | 2014 | 2015 |
|---|---|---|---|---|---|---|---|
| Lyme disease cases reported in Canada (n=3,012) | |||||||
| British Columbia | 0.2 | 0.2 | 0.4 | 0.4 | 0.1 | 0.1 | 0.4 |
| Alberta* | 0 | 0.0 | 0.2 | 0.2 | 0.5 | 0.2 | 0.3 |
| Saskatchewan* | 0 | 0.0 | 0.1 | 0.0 | 0.1 | 0.0 | 0.0 |
| Manitoba | 0.4 | 1.0 | 1.0 | 1.5 | 2.3 | 2.7 | 2.4 |
| Ontario | 0.8 | 0.7 | 1.0 | 1.4 | 2.4 | 1.7 | 3.1 |
| Quebec | 0.2 | 0.1 | 0.4 | 0.5 | 1.7 | 1.5 | 1.9 |
| New Brunswick | 0 | 0.3 | 0.7 | 0.9 | 0.7 | 0.7 | 1.7 |
| Nova Scotia | 1.7 | 1.8 | 5.7 | 5.4 | 16.2 | 12.1 | 26.1 |
| Prince Edward Island | 0.0 | 0.0 | 0.7 | 1.4 | 0.0 | 0.0 | 2.7 |
| Newfoundland & Labrador* | 0.0 | 0.2 | 0.0 | 0.0 | 0.0 | 0.0 | 0.4 |
| Canada | 0.4 | 0.4 | 0.8 | 1.0 | 1.9 | 1.5 | 2.6 |
| Lyme disease cases acquired in Canada† (n=2,004) | |||||||
| Manitoba | 0.3 | 0.6 | 0.6 | 1.0 | 2.0 | 2.4 | 2.3 |
| Ontario | 0.5 | 0.5 | 0.8 | 0.8 | 2.1 | 1.3 | 2.7 |
| New Brunswick | 0.0 | 0.3 | 0.4 | 0.7 | 0.7 | 0.5 | 1.5 |
| Nova Scotia | 1.5 | 1.5 | 5.2 | 5.3 | 16.1 | 12.1 | 26.1 |
| Prince Edward Island | 0.0 | 0.0 | 0.0 | 0.7 | 0.0 | 0.0 | 0.0 |
* All cases reported from Alberta, Saskatchewan and Newfoundland and Labrador were travel-related
† The information about whether Lyme disease cases were acquired in Canada was provided by some of the provinces participating in the LDES system (Alberta, Manitoba, Ontario, New Brunswick, Nova Scotia and Prince Edward Island). However, only Lyme disease cases acquired in the province of origin are included
Among the cases acquired in Canada, 63.9% were confirmed cases and 36.1% were probable cases (Table 3).
Table 3. Classification (confirmed and probable) of all reported Lyme disease cases and cases acquired in Canada*, 2009–2015.
| Classification | Number (percentage of cases) | |||||||
|---|---|---|---|---|---|---|---|---|
| Year | 2009 | 2010 | 2011 | 2012 | 2013 | 2014 | 2015 | Total |
| Lyme disease cases reported in Canada (n=3,012) | ||||||||
| Confirmed | 115 (79.9%) | 109 (76.2%) | 195 (73.3%) | 232 (68.6%) | 485 (71.1%) | 334 (64.0%) | 651 (71.0%) | 2,121 (70.4%) |
| Probable | 29 (20.1%) | 34 (23.8%) | 71 (26.7%) | 106 (31.4%) | 197 (28.9%) | 188 (36.0%) | 266 (29.0%) | 891 (29.6%) |
| Total | 144 | 143 | 266 | 338 | 682 | 522 | 917 | 3,012 |
| Lyme disease cases acquired in Canada (n=2,015) | ||||||||
| Confirmed | 56 (70.9%) | 56 (65.1%) | 96 (60.0%) | 129 (58.1%) | 286 (61.1%) | 198 (59.5%) | 467 (70.0%) | 1,288 (63.9%) |
| Probable | 23 (29.1%) | 30 (34.9%) | 64 (40.0%) | 93 (41.9%) | 182 (38.9%) | 135 (40.5%) | 200 (30.0%) | 727 (36.1%) |
| Total | 79 | 86 | 160 | 222 | 468 | 333 | 667 | 2,015 |
* The information on Lyme disease cases acquired in Canada (number and percentage) is provided by provinces participating in the LDES system (Alberta, Manitoba, Ontario, New Brunswick, Nova Scotia and Prince Edward Island). For clarification, all cases reported to be acquired in Canada within or outside the province are included
The increased incidence of Lyme disease in Canada was mainly due to an increase in the number of locally acquired infections—79 in 2009 and 667 in 2015.
Over the study period, information on the country of exposure was available for 1,950 cases. Of those, 1,709 (87.6%) were acquired in Canada. Of those cases for which information on location of acquisition was available, the majority were reported as being acquired in known risk areas. However, some cases were reported as having been acquired in Canada, but outside known risk locations. The rest of these cases, 241 (12.4%), were acquired abroad; more than half of these travel-related cases were reported as being acquired in the United States.
Seasonal distribution
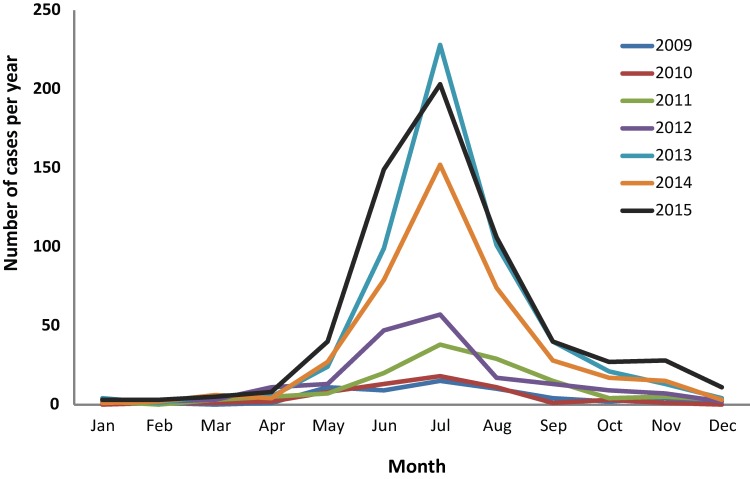
For the provinces participating in the LDES system, the month of illness onset for Lyme disease cases acquired in Canada was available for 2010 cases. Of these, 96% were reported between May and November, with a consistent peak in case numbers in July. Most cases were reported during the summer months of June (20.7%), July (35.4%) and August (17.3%) (Figure 1). In 2015, a greater number of cases were reported with illness onset in November and December, suggesting that the ticks may have been active later in the season that year than in other years.
Figure 1. Month of Lyme disease illness onset for locally-acquired infection: Canada, 2009–2015 (n=2,010).
Geographic distribution
Between 2009 and 2015, provinces from Manitoba eastwards had an increase in incidence of Lyme disease, with the largest increase in Nova Scotia. In the western provinces, the incidence has remained low and stable. All cases reported by Alberta, Saskatchewan and Newfoundland and Labrador were acquired outside of the province, either elsewhere in Canada or abroad. The year 2014 saw a decrease in incidence in most provinces, followed by an increase in 2015.
For the provinces participating in the LDES system, the number of municipalities with acquisition of Lyme disease cases in Canada increased more than five-fold over the study period, from 21 in 2009 to 109 in 2015 (Table 4).
Table 4. Annual number of cases and municipalities of disease acquisition reported by provinces participating in the Lyme Disease Enhanced Surveillance system, Canada, 2009–2015.
| Province | 2009 | 2010 | 2011 | 2012 | 2013 | 2014 | 2015 | |
|---|---|---|---|---|---|---|---|---|
| British Columbia* | Cases (N) | NA | NA | NA | NA | NA | NA | NA |
| Municipalities (N) | NA | NA | NA | NA | NA | NA | NA | |
| Alberta | Cases (N) | 0 | 0 | 0 | 0 | 0 | 0 | 0 |
| Municipalities (N) | 0 | 0 | 0 | 0 | 0 | 0 | 0 | |
| Manitoba | Cases (N) | 0 | 4 | 7 | 12 | 19 | 28 | 22 |
| Municipalities (N) | 0 | 2 | 4 | 3 | 9 | 17 | 12 | |
| Ontario | Cases (N) | 37 | 38 | 85 | 92 | 184 | 144 | 323 |
| Municipalities (N) | 18 | 18 | 31 | 37 | 54 | 45 | 74 | |
| New Brunswick* | Cases (N) | NA | 0 | 3 | 5 | 1 | 3 | 7 |
| Municipalities (N) | NA | 0 | 1 | 1 | 1 | 2 | 2 | |
| Nova Scotia | Cases (N) | 13 | 17 | 50 | 50 | 151 | 114 | 239 |
| Municipalities (N) | 3 | 5 | 10 | 7 | 13 | 15 | 21 | |
| Prince Edward Island* | Cases (N) | NA | NA | NA | 1 | 0 | 0 | 0 |
| Municipalities (N) | NA | NA | NA | 1 | 0 | 0 | 0 | |
| Newfoundland & Labrador | Cases (N) | 0 | 0 | 0 | 0 | 0 | 0 | 0 |
| Municipalities (N) | 0 | 0 | 0 | 0 | 0 | 0 | 0 | |
| Total | Cases (N) | 50 | 59 | 145 | 160 | 355 | 289 | 591 |
| Municipalities (N) | 21 | 25 | 46 | 49 | 77 | 79 | 109 | |
Abbreviations: N, number; NA, not available
* New Brunswick, Prince Edward Island and British Columbia started participating to the Lyme Disease Enhanced Surveillance (LDES) system in 2010, 2012 and 2015, respectively. British Columbia does not provide information on location of acquisition of disease. Cases reported in Alberta and Newfoundland and Labrador are travel-related cases only
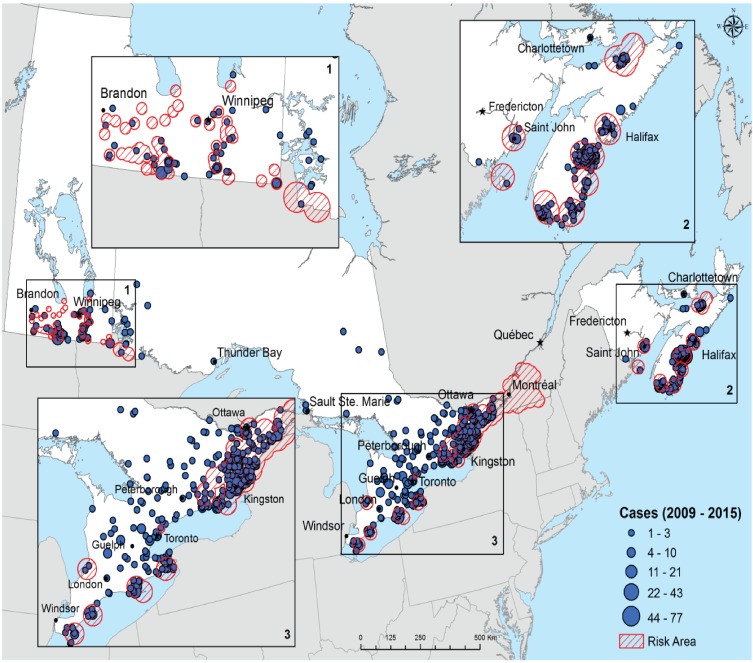
The reported locations of where Lyme disease was acquired in Canada are shown in Figure 2. Lyme disease risk areas have increased over time for Manitoba, Ontario, Quebec, New Brunswick and Nova Scotia (1).
Figure 2. Reported locations of Lyme disease acquisition, Canada, 2009–2015.
Legend: The size of each circle represents the number of cases acquired in a given municipality. The centre of each circle is the centroid of the probable municipality of acquisition. The data on location of acquisition are not available for cases reported in British Columbia, Saskatchewan and Quebec. Furthermore, cases reported in Alberta and Newfoundland and Labrador are travel-related cases only. Hatched areas indicate Lyme disease risk areas. These are locations where field surveillance suggests that populations of the Lyme disease vector Ixodes scapularis have begun to become established (1)
Demographic and clinical characteristics
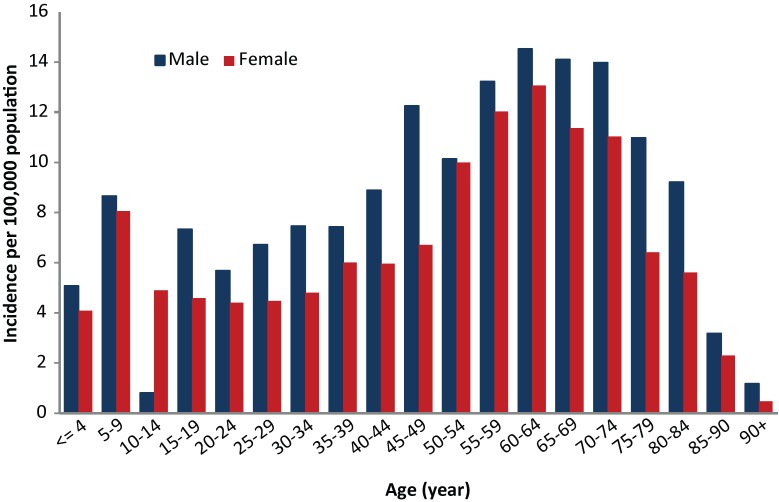
Over the study period, slightly more cases of Lyme disease were reported among men (n=1,688, 56% of cases) than women (n=1,316, 44% of cases). The mean age of all reported cases was 45 years (95% CI: 44.3–45.8). The incidence per 100,000 population showed a bimodal pattern with high incidence in adults aged 45–74 years and children aged 5–9 years. In all age groups, incidence was higher among males than females, except for the 10–14 age group (Figure 3).
Figure 3. Incidence of Lyme disease by age group and sex, Canada 2009–2015 (n=3,004).
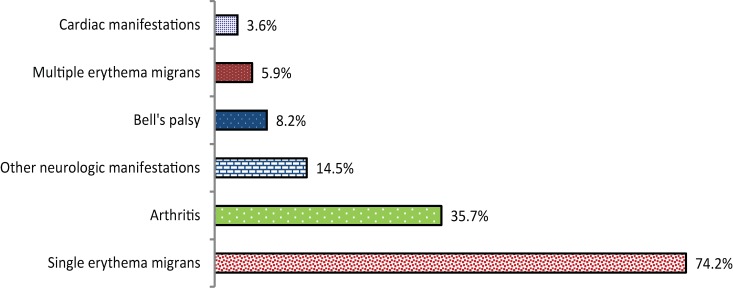
Clinical information on those affected by Lyme disease acquired in Canada was available in 1,657 (55%) of reported cases. A single erythema migrans rash (74.2%) and arthritis (35.7%) were the most common manifestations, and multiple erythema migrans lesions (5.9%) and cardiac symptoms (3.6%) were the least common (Figure 4). Multiple clinical manifestations were reported in 33.2% of cases.
Figure 4. Percentage of clinical manifestations for Lyme disease infections acquired in Canada, 2009–2015 (n=1,657).
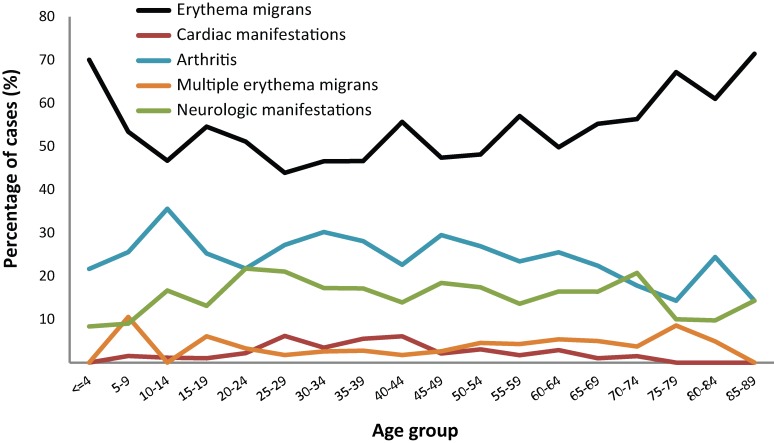
The relative proportions of the different clinical manifestations were somewhat different for cases reported in children younger than 15 years of age than in other age groups. In this age group, erythema migrans lesions were more commonly reported, whereas neurologic and cardiac manifestations were less frequently reported than for older age groups (Figure 5). Cardiac manifestations were more frequently reported for adults of 20–44 years of age than for other age groups.
Figure 5. Percentage of reported Lyme disease casesI by clinical manifestation and age group, Canada, 2009–2015 (n=1,657).
Abbreviation: %, percentage
I Reported in the Lyme Disease Enhanced Surveillance System
In the multivariate analysis for clinical manifestations, children aged 0–9 years had a greater number of cases reported as early Lyme disease (erythema migrans only) than patients aged 10–19 and 30–39 years.(P<0.05) (Table 5). For early disseminated manifestations, young adults 20–29 years of age reported more neurologic manifestations, cardiac manifestations or multiple erythema migrans than the reference age group of 0–9 years (P<0.05). For late disseminated manifestations, children under 15 years of age were more frequently reported as having arthritis than other age groups.
Table 5. Final multivariate logistic regression models predicting occurrence of Lyme disease clinical manifestations in patients, Canada, 2009–2015 (n=1,657).
| Explanatory variables | Estimate | Odds ratio | CI at 95% | Wald test | P value |
|---|---|---|---|---|---|
| Early Lyme disease (erythema migrans) | |||||
| 10–19 years vs 0–9 years | −0.490 | 0.613 | 0.378–0.994 | 3.932 | 0.047 |
| 30–39 years vs 0–9 years | −0.513 | 0.599 | 0.378–0.950 | 4.753 | 0.029 |
| Early disseminated (neurologic and cardiac symptoms; multiple erythema migrans) | |||||
| Male vs female | −0.272 | 0.762 | 0.585–0.992 | 4.083 | 0.043 |
| 20–29 years vs 0–9 years | 0.678 | 1.969 | 1.071–3.623 | 4.751 | 0.029 |
| Year 2010 vs 2015 | −0.555 | 0.574 | 0.392–0.841 | 8.137 | 0.004 |
| Late disseminated (arthritis) | |||||
| Male vs female | 0.246 | 1.279 | 1.031–1.586 | 5.012 | 0.025 |
| 75+ years vs 0–14 years | −0.691 | 0.501 | 0.283–0.888 | 5.604 | 0.018 |
| Year 2011 vs 2015 | 0.565 | 1.759 | 1.221–2.533 | 9.200 | 0.002 |
| Year 2010 vs 2015 | 0.774 | 2.168 | 1.630–2.883 | 28.777 | 0.000 |
| Year 2009 vs 2015 | 0.472 | 1.603 | 1.168–2.199 | 8.554 | 0.003 |
Abbreviations: CI, confidence interval
Cases reported as being in the late disseminated phase were significantly higher in 2009–2011 than in 2015 (P<0.01). Consistent with this was the observation that there were more cases reported as being in the early disseminated phase in 2015 than in 2010 (P<0.01).
Discussion
Since Lyme disease became nationally notifiable in Canada in 2009, the number of reported Lyme disease cases has continued to increase from 0.4 to 2.6 per 100,000 population. Over the seven-year period, most of the cases were reported from three provinces, Ontario, Quebec and Nova Scotia; and most were locally acquired. The increase in geographic distribution of Lyme disease cases is consistent with the ongoing range expansion of blacklegged ticks, which is likely associated in part with effects of a warming climate on range spread of the tick vector I. scapularis in eastern and central Canada (10). However the incidence remains low and stable in western provinces of British Columbia, Alberta and Saskatchewan. This is due to the fact that in BC, fewer western blacklegged ticks, the Lyme disease vector in this area, are being infected with the Lyme disease bacterium than blacklegged ticks found in central and eastern Canada. In Alberta and Saskatchewan despite an increased effort, no known black-legged tick populations have been detected.
Reported illness onset was greater during the summer months which corresponds with the activity period of I. scapularis ticks seeking hosts (11) and overlaps with the period when most Canadians engage in outdoor activities.
Among adults, the highest incidence was between 55–74 years. Among children, the highest incidence was between 5–9 years. This is consistent with demographic trends seen in the United States (3,6) and may be useful when targeting awareness messaging (12,13). Fewer late disseminated Lyme disease cases were reported in 2015 compared with the years from 2009 to 2011, which could suggest increased awareness and earlier diagnosis and reporting of Lyme disease cases over time.
Strengths and limitations
This study summarizes data from the Canadian Notifiable Diseases Surveillance System, supplemented in most provinces with information from the Lyme Disease Enhanced Surveillance system. Using these data, we are able to follow spatial and temporal trends in the evolution of Lyme disease incidence in Canada and observe the geographic spread of Lyme disease risk and effectiveness of public health actions.
There are three main limitations to the interpretation of these findings. First, it is likely that the incidences over time are conservative estimates as some Lyme disease cases may be undiagnosed and probable cases may be underreported. Second, information on whether the Lyme disease infection was locally acquired or travel-related is an estimate because not all provinces provided this data. Finally, because of limited resources, field tick surveillance to detect expanding Lyme disease risk areas may not be up to date in many locations, which would affect classification of cases.
Conclusion
The number of reported Lyme disease cases has continued to increase in Canada over recent years, as is the geographic range of ticks that carry the Lyme disease bacteria. Continued surveillance, preventive strategies as well as early disease recognition and treatment will continue to minimize the impact of Lyme disease in Canada.
Acknowledgements
The authors thank all the provincial and regional public health workers who collect and report data to the CNDSS, and Yann Pelcat of the Public Health Agency of Canada for preparing Figure 5.
Conflict of interest: None.
Funding: This study was supported by the Public Health Agency of Canada and all the provincial public health organizations that contributed to the data.
References
- 1.Ogden NH, Koffi KJ, Pelcat Y, Lindsay LR. Environmental risk from Lyme disease in central and eastern Canada: a summary of recent surveillance information. Can Commun Dis Rep 2014;40(5):74–82. Available from: http://www.phac-aspc.gc.ca/publicat/ccdr-rmtc/14vol40/dr-rm40-05/assets/pdf/14vol40_05-eng.pdf [DOI] [PMC free article] [PubMed] [Google Scholar]
- 2.Hatchette TF, Davis I, Johnston BL. Lyme disease: clinical diagnosis and treatment. Can Commun Dis Rep 2014;40(11):194–208. Available from: https://www.canada.ca/en/public-health/services/reports-publications/canada-communicable-disease-report-ccdr/monthly-issue/2014-40/ccdr-volume-40-11-may-29-2014/ccdr-volume-40-11-may-29-2014.html [DOI] [PMC free article] [PubMed] [Google Scholar]
- 3.Bacon RM, Kugeler KJ, Mead PS; Centers for Disease Control and Prevention (CDC). Surveillance for Lyme disease--United States, 1992-2006. MMWR Surveill Summ 2008. Oct;57(10 SS-10):1–9. [PubMed] [Google Scholar]
- 4.Centers for Disease Control and Prevention (CDC). Three sudden cardiac deaths associated with Lyme carditis - United States, November 2012-July 2013. MMWR Morb Mortal Wkly Rep 2013. Dec;62(49):993–6. [PMC free article] [PubMed] [Google Scholar]
- 5.Public Health Agency of Canada. Surveillance of Lyme disease. Ottawa: Public Health Agency of Canada; 2017. https://www.canada.ca/en/public-health/services/diseases/lyme-disease/surveillance-lyme-disease.html#a2 [Accessed 2017 Apr 13].
- 6.Ogden NH, Koffi KJ, Lindsay LR, Fleming S, Monbourquette DC, Sanford C et al. Surveillance for Lyme disease in Canada, 2009-2012. Can Commun Dis Rep 2015;41(6):132–45. Available from: https://www.canada.ca/en/public-health/services/reports-publications/canada-communicable-disease-report-ccdr/monthly-issue/2015-41/ccdr-volume-41-06-june-4-2015/ccdr-volume-41-06-june-4-2015-2.html [DOI] [PMC free article] [PubMed] [Google Scholar]
- 7.Public Health Agency of Canada. Lyme disease in Canada - A Federal Framework. Ottawa: Public Health Agency of Canada; 2017. https://www.canada.ca/en/public-health/services/publications/diseases-conditions/lyme-disease-canada-federal-framework.html [Accessed 2017 Aug 17].
- 8.Public Health Agency of Canada. Case definition for communicable diseases under National Surveillance. Ottawa: Public Health Agency of Canada; 2017. https://www.canada.ca/en/public-health/services/reports-publications/canada-communicable-disease-report-ccdr/monthly-issue/2009-35/definitions-communicable-diseases-national-surveillance/lyme-disease.html [Accessed 2017 Aug 17].
- 9.Statistics Canada. CANSIM by subject: population and demography. Ottawa: Statistics Canada; 2017. http://www5.statcan.gc.ca/cansim/a33?lang=eng&spMode=master&themeID=3867&RT=TABLE [Accessed 2017 Apr 13].
- 10.Leighton PA, Koffi KJ, Pelcat Y, Lindsay LR, Ogden NH. Predicting the speed of tick invasion: an empirical model of range expansion for the Lyme disease vector Ixodes scapularis in Canada. J Appl Ecol 2012;49(2):457–64. Available from: 10.1111/j.1365-2664.2012.02112.x 10.1111/j.1365-2664.2012.02112.x [DOI] [Google Scholar]
- 11.Kurtenbach K, Hanincová K, Tsao JI, Margos G, Fish D, Ogden NH. Fundamental processes in the evolutionary ecology of Lyme borreliosis. Nat Rev Microbiol 2006. Sep;4(9):660–9. Available from: 10.1038/nrmicro1475 10.1038/nrmicro1475 [DOI] [PubMed] [Google Scholar]
- 12.Liang W, Shediac-Rizkallah MC, Celentano DD, Rohde C. A population-based study of age and gender differences in patterns of health-related behaviors. Am J Prev Med 1999. Jul;17(1):8–17. 10.1016/S0749-3797(99)00040-9 [DOI] [PubMed] [Google Scholar]
- 13.Public Health Agency of Canada. Prevention of Lyme disease. Ottawa: Public Health Agency of Canada; 2017. https://www.canada.ca/en/public-health/services/diseases/lyme-disease/prevention-lyme-disease.html [Accessed 2017 Aug 17].


