

SUMMARY
RNA viruses exist in genetically diverse populations due to high levels of mutations, many of which reduce viral fitness. Interestingly, intestinal bacteria can promote infection of several mammalian enteric RNA viruses, but the mechanisms and consequences are unclear. We screened a panel of 41 bacterial strains as a platform to determine how different bacteria impact infection of poliovirus, a model enteric virus. Most bacterial strains, including those extracted from cecal contents of mice, bound poliovirus with each bacterium binding multiple virions. Certain bacterial strains increased viral co-infection of mammalian cells even at a low virus to host cell ratio. Bacteria-mediated viral co-infection correlated with bacterial adherence to cells. Importantly, bacterial strains that induced viral co-infection facilitated genetic recombination between two different viruses, thereby removing deleterious mutations and restoring viral fitness. Thus, bacteria-virus interactions may increase viral fitness through viral recombination at initial sites of infection, potentially limiting abortive infections.
eTOC Blurb
Enteric viruses rely on intestinal bacteria for replication and transmission. By screening a diverse panel of bacterial strains, Erickson et al. demonstrate that bacteria differentially bind poliovirus and that some bacterial strains promote viral co-infection and genetic recombination, thus enhancing viral fitness.
INTRODUCTION
Enteric viruses, including poliovirus, reovirus, and norovirus, are spread through the fecal-oral route and replicate in the gastrointestinal tract where they encounter numerous resident bacteria. Previously we and others demonstrated that gut microbiota promote replication, transmission, and pathogenesis of several enteric viruses (Baldridge et al., 2015; Jones et al., 2014; Kane et al., 2011; Kuss et al., 2011; Robinson et al., 2014; Uchiyama et al., 2014). Microbiota enhance replication and transmission of enteric viruses through several mechanisms (Pfeiffer and Virgin, 2016). For example, microbiota can dampen innate immune responses (Baldridge et al., 2015; Kane et al., 2011), or increase infectivity of virions by aiding attachment to host cells (Jones et al., 2014; Kuss et al., 2011; Robinson et al., 2014), or enhancing virion stability (Kuss et al., 2011; Li et al., 2015; Robinson et al., 2014).
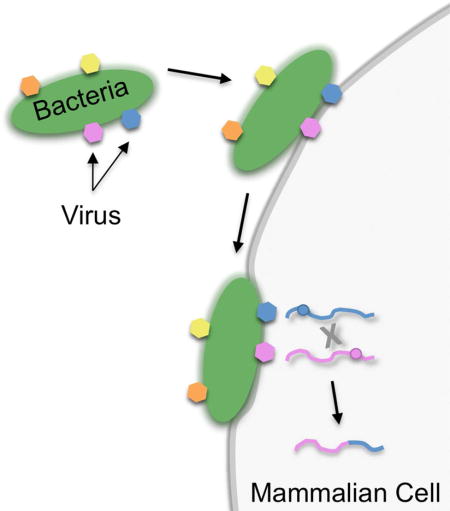
Enteric viruses can bind to bacteria via bacterial surface polysaccharides. For example, human norovirus is thought to bind specific bacteria by interacting with histo-blood group antigen glycans (Almand et al., 2017; Jones et al., 2014; Li et al., 2015; Miura et al., 2013). Poliovirus binds to bacterial N-acetylglucosamine-containing polysaccharides including lipopolysaccharide and peptidoglycan (Kuss et al., 2011; Robinson et al., 2014). Recently it was demonstrated that human norovirus can bind to different bacteria and multiple virions bound to a single bacterium (Almand et al., 2017; Li et al., 2015; Miura et al., 2013). It is unclear whether different bacteria bind viruses with different efficiencies. Furthermore, the consequences of virus-bacterial interactions are not completely understood. It is possible that bacteria deliver viruses to intestinal cells, which could be impeded by mucus. However, several viruses infect the intestine via M cells within Peyer’s patches and these sites are thought to have penetrable mucus (Ermund et al., 2013).
RNA viruses such as poliovirus, reovirus, and norovirus exist as populations of genetically diverse viruses with varying levels of fitness (Domingo and Holland, 1997). Viral genetic diversity is generated through error-prone RNA replication. Mutations can have several consequences: most are deleterious, some are neutral, and a few may be beneficial. Fitness of viruses with deleterious mutations can sometimes be restored by replication under high multiplicity of infection (MOI) conditions, which can facilitate processes such as complementation and recombination (Domingo and Holland, 1997; Duarte et al., 1994; Muller, 1964). Mouse models of poliovirus infection have shown that both mutation and recombination promote infection by driving viral adaptation necessary for replication and dissemination (Pfeiffer and Kirkegaard, 2005; Vignuzzi et al., 2006; Xiao et al., 2016). Poliovirus RNA recombination occurs in cells infected at high MOI (Egger and Bienz, 2002; Jarvis and Kirkegaard, 1992; Kirkegaard and Baltimore, 1986; Lowry et al., 2014; Runckel et al., 2013) and also occurs in humans after oral polio vaccination (Cuervo et al., 2001; Minor et al., 1986). A basal requirement for observable recombination is co-infection of a cell with at least two viruses. Co-infection of a cell is unlikely when there are a limited number of viral particles, such as during the first cycle of replication following inter-host transmission. Recently it was demonstrated that poliovirus can spread as one unit containing multiple viral particles, either within lipid vesicles or as viral aggregates, and this delivery mode increased co-infection frequency and infectivity (Aguilera et al., 2017; Chen et al., 2015). How enteric RNA viruses generate high levels of population diversity upon the primary replication cycle within the host intestinal tract when a limited number of virions are present is unclear, but bacteria-mediated delivery of multiple virions is an intriguing possibility.
Here we use a panel of bacterial strains to evaluate enteric virus-bacteria interactions and consequences on viral infection and evolution. We discovered that poliovirus-bacteria interactions vary among different bacteria, and we observed multiple virions bound to the bacterial surface. Several bacterial strains enhanced viral co-infection efficiency and recombination, even when the ratio of virions to host cells was low. Bacteria that facilitated co-infection could deliver up to six different viral genomes per host cell. Importantly, bacteria-mediated viral co-infection and genetic recombination generated variants that could replicate under conditions where the parental viruses could not. These results suggest that bacteria may increase viral fitness and population diversity.
Results
Screening Bacterial Strains for Poliovirus Binding
To investigate bacteria-virus interactions, we sought a diverse collection of bacterial species to screen several parameters. In addition to 16 strains obtained from collaborators and 2 strains obtained from the American Type Culture Collection, we cultured 23 bacterial strains from the cecal contents of mice. We obtained pure cultures and identified strains using 16S ribosomal DNA sequencing (Fig. S1A)(Duerkop et al., 2012; Koropatkin et al., 2008; Stojiljkovic et al., 1995; Winter et al., 2010).
Our previous work indicated that poliovirus binds to bacteria; therefore, we examined poliovirus-bacterial interactions using two assays. First, electron microscopy (EM) analysis revealed that poliovirus bound to a variety of Gram-positive and Gram-negative bacteria. Additionally, we observed multiple virions bound to the surface of each bacterium (Fig. 1A–D). Second, we used a pull-down assay where 35S-labeled poliovirus was incubated with bacteria prior to centrifugation, washing, and scintillation counting to determine the percent of input virus bound to bacteria. Non-specific binding was quantified using inert beads with a diameter similar to bacteria. We found that 2% of input virus bound to beads, and 32 of the 36 bacterial strains initially tested bound significantly more virus compared to beads (Fig. 1E). Poliovirus bound to both Gram-negative bacteria and Gram-positive bacteria, with binding efficiencies ranging from 4–37% (Fig. 1E). Lactobacillus johnsonii, a Gram-positive strain isolated from feces, bound poliovirus with the highest efficiency.
Figure 1. Poliovirus Binding to Bacteria.
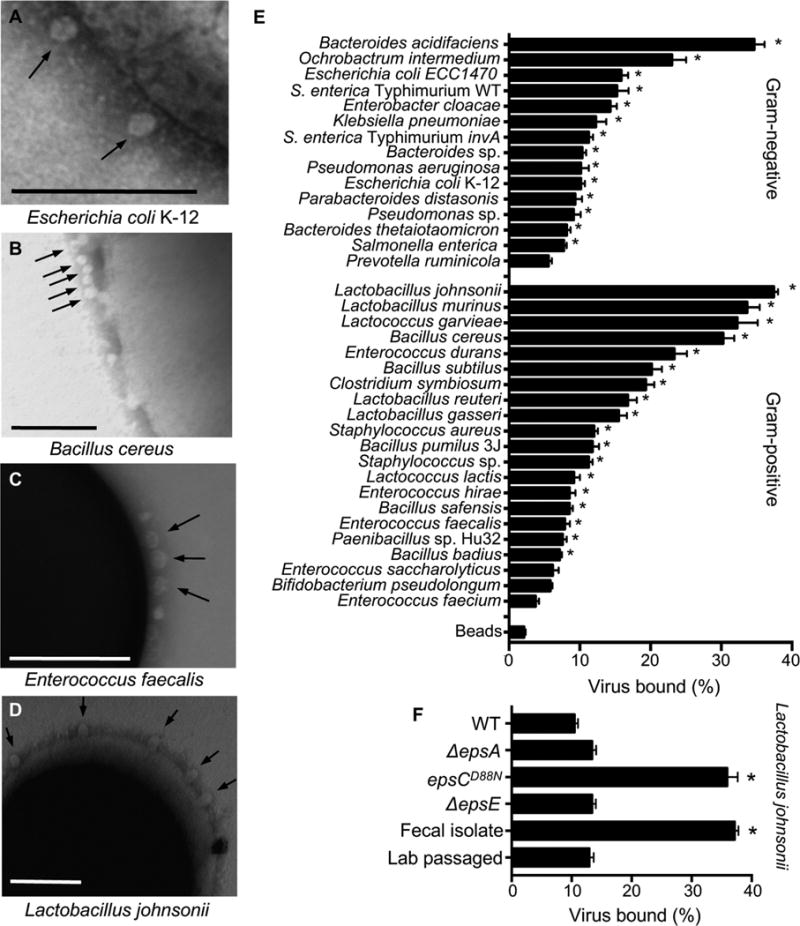
Bacteria were isolated from mouse cecal contents (n=22) or were acquired from collaborators or the ATCC (n=14)(Fig. S1A). (A–D) Electron micrographs of poliovirus bound to the surface of bacteria: 1×10⁶ CFUs of Escherichia coli K-12 (A), Bacillus cereus (B), Enterococcus faecalis (C), and Lactobacillus johnsonii- Fecal isolate (D) were incubated with 1×10⁷ PFU of purified poliovirus for 1 h prior to fixation, staining, and imaging. Arrows show poliovirus on the bacterial surface. Scale bars represent 200 nm. (E) Pull down assay. 1×10⁶ PFU/5,000 CPM of 35S-labeled poliovirus was incubated with 1×10⁹ CFU of bacteria or inert beads for 1 h prior to centrifugation, washing, and scintillation counting of bacteria-associated 35S. Data are represented as mean ± SEM of the percent of input virus bound to the bacterial pellet. *p<0.05 versus Beads (one-way ANOVA followed by Dunnet’s multiple comparison test). (F) Quantification of poliovirus binding by L. johnsonii strains. Several L. johnsonii strains were used in this work, including: Fecal isolate (isolated from mouse cecal contents), Lab passaged (a version of the Fecal isolate that was serially passaged; a lab-adapted strain), WT (FI9785, isolated from poultry)(Horn et al., 2013), ΔepsA (FI10938, WT strain lacking epsA, produces no EPS)(Dertli et al., 2016), epsCD88N (FI10386, WT strain with a mutation in the putative chain length and polymerization protein EpsC, overproduces EPS and alters phenotype)(Horn et al., 2013), ΔepsE (FI10844, WT strain lacking epsE, produces altered/reduced EPS)(Horn et al., 2013). Data are represented as mean ± SEM (n≥14, ≥3 independent experiments). *p<0.05 versus WT (one-way ANOVA followed by Dunnet’s multiple comparison test). See also Figure S1.
While working with L. johnsonii, we noticed that after 3–5 passages in liquid culture, the strain had altered properties suggestive of lab adaptation. For example, the original fecal isolate of L. johnsonii (called L. johnsonii-Fecal isolate) auto-aggregated following resuspension of bacteria in PBS whereas the lab-adapted strain (called L. johnsonii-Lab passaged) did not (Fig. S1B). Lab adaptation of L. johnsonii strains can be conferred by changes in exopolysaccharide (EPS). Previous studies demonstrated that L. johnsonii strains with mutations in the eps gene cluster have altered EPS production, auto-aggregation, and adhesion to host cells (Dertli et al., 2013; Dertli et al., 2016; Horn et al., 2013). Therefore, we examined EPS production in our strains compared to eps mutant strains. Our collection of previously published isogenic L. johnsonii strains includes WT (FI9785, EPS+, producing glycan EPS1 and heteropolysaccharide EPS2), ΔepsA (EPS negative), epsCD88N (EPS overproducer), ΔepsE (reduced EPS with no EPS2)(Dertli et al., 2013; Dertli et al., 2016; Horn et al., 2013). First, EM analysis showed EPS on the cell surface of WT, Fecal isolate, and Lab passaged L. johnsonii strains but EPS was absent from the ΔepsA mutant (Fig. S1C). Second, we quantified purified EPS from the strains using a biochemical assay. Confirming previous findings (Dertli et al., 2016; Horn et al., 2013), epsCD88N had increased EPS production, and ΔepsA and ΔepsE had reduced EPS production (Fig. S1D). We determined that the L. johnsonii-Fecal isolate and L. johnsonii-Lab passaged strains had similar EPS amounts, which was lower but not significantly different from WT (Fig. S1D).
Since we previously found that bacterial surface polysaccharides bind poliovirus (Kuss et al., 2011; Robinson et al., 2014), we asked whether L. johnsonii EPS production impacts poliovirus binding using the pull-down assay. We determined that the WT, ΔepsA, ΔepsE, and Lab passaged L. johnsonii strains had relatively low amounts (10–13%) of poliovirus bound, while the epsCD88N and Fecal isolate strains had high amounts (>36%) of poliovirus bound (Fig. 1F). Notably, there was no correlation between EPS amounts and viral binding (Fig. S1E), suggesting that the ability of L. johnsonii to bind poliovirus is not dependent on the amount of EPS produced and that other factors contribute to binding.
Certain Bacterial Strains Increase Viral Infectivity
Previously we found that exposure to bacteria enhanced poliovirus infectivity in plaque assays (Kuss et al., 2011); therefore, we screened our bacteria to determine whether strains differ in their capacity to promote poliovirus infection. We used a high-throughput flow cytometry-based assay with polioviruses encoding DsRed or GFP (Teterina et al., 2010) to quantify infection (Fig. 2A). We used this assay previously to quantify viral co-infection frequencies from virion aggregates (Aguilera et al., 2017). To establish assay conditions, we performed mock infections, single infections with 1×10⁴ PFU DsRed or GFP poliovirus, or mixed infections of 1×10⁶ HeLa cells (MOI of 0.01). At 16 hpi, cells were fixed and the number of uninfected, single infected, or dual infected cells was quantified by flow cytometry. The total percentage of cells infected was determined as the percentage of DsRed+ and GFP+ gated cells (Fig. 2, S2). As predicted based on the MOI of 0.01, ~1% of cells exposed to both viruses were infected, with ~0.5% GFP+ and ~0.5% DsRed+ (Fig. 2B, S2). To determine whether different bacteria enhance poliovirus infection, we pre-incubated 1×10⁴ PFU of DsRed and GFP viruses with inert beads or 1×10⁸ CFU bacteria, followed by infection of 1×10⁶ HeLa cells and analysis by flow cytometry. We found that 32% (13/41) of the strains increased poliovirus infectivity (Fig. 2B). There was no correlation between binding efficiency of poliovirus to bacteria and the number of infected cells (Fig. 2C). We also examined whether our collection of L. johnsonii strains enhance poliovirus infection, but only L. johnsonii-Fecal isolate increased infection marginally (Fig. 2D). Again, there was no significant correlation between the amount of virus bound to bacteria and the number of cells infected (Fig. 2E), suggesting that other factors such as the kinetics or strength for virus binding to bacteria may influence bacteria-mediated enhancement of poliovirus infection.
Figure 2. The Impact of Bacteria on Viral Infectivity.
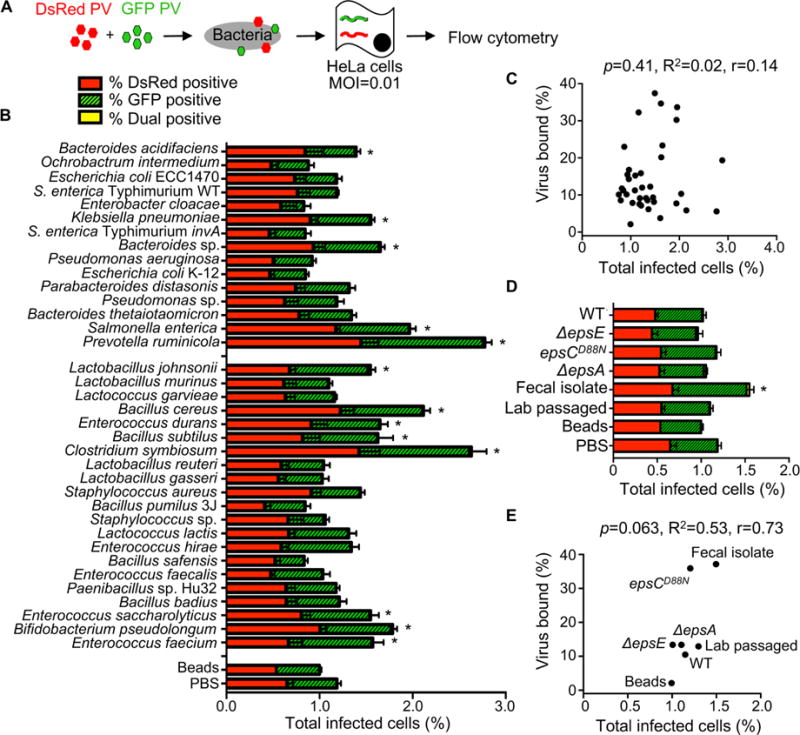
(A) Schematic of flow cytometry infectivity assay that applies to Figures 2 and 3. 1×10⁴ DsRed- and/or GFP-expressing polioviruses were incubated with or without 1×10⁸ CFU bacteria for 1 h at 37°C prior to infection of 1×10⁶ HeLa cells (MOI of 0.01), bacteria and remaining virus were removed from cells by washing, infection proceeded for a single cycle (16 h), and DsRed and GFP positive cells were quantified by flow cytometry. Each experiment counted ≥5×10⁵ events. (B) Total percentage of infected cells. Bars indicate the total percent of infected cells, which includes DsRed+ cells, GFP+ cells, or dual-positive cells. Bars are shaded to show the percentages of DsRed, GFP, and DsRed and GFP (dual) positive cells. Note that dual positive cells were a small fraction of the total; thus, the yellow shaded portions are small. Data are represented as mean± SEM (n=8–26). *p<0.05 versus PBS (one-way ANOVA followed by Dunnet’s multiple comparison test). (C) Scatter plot for correlation of total percent of infected cells and the percentage of virus bound. Data points are the mean values presented in Figures 2B and 1E. p=0.41, R2=0.02, r=0.14 (Pearson’s correlation coefficient). (D) The total percent of infected cells after viral incubation with or without L. johnsonii strains. Data are represented as mean ± SEM, n≥8. *p<0.05 versus PBS (one-way ANOVA followed by Dunnet’s multiple comparison test). (E) Scatter plot to test for correlation of total percent of infected cells and the percentage of virus bound for each L. johnsonii strain. Data points are the mean values presented in Figures 2D and 1F. p=0.06, R2=0.53, r=0.73 (Pearson’s correlation coefficient). See also Figure S2.
Certain Bacterial Strains Facilitate Viral Co-infection
Since EM images in Figure 1 indicated that each bacterium binds multiple virions, we wondered whether bacteria facilitate delivery of more than one viral genome per HeLa cell, a process we refer to as bacteria-mediated viral co-infection. We hypothesized that bacteria may facilitate viral co-infection even when very little virus is present. To test this hypothesis, we infected 1×10⁶ HeLa cells with 1×10⁴ PFU of DsRed and GFP expressing polioviruses (MOI=0.01) with or without exposure to 1×10⁸ CFU of bacteria as described in Figure 2, and we quantified the number of cells infected with both viruses. We performed experiments to determine the detection limit of the assay and established that >0.0018% co-infection was within the linear range of detection (Fig. S3A and see Methods). We determined that GFP and DsRed viruses incubated with beads or PBS prior to infection of HeLa cells at an MOI of 0.01 resulted in approximately 0.006% of cells dual positive (GFP+DsRed+)(Fig. 3A, S2), a value close to the predicted Poisson distribution value of 0.005%. We confirmed that dual-infected cells were from the initial viral replication cycle and not from secondary cycles of replication by demonstrating that the percentage of dual-infected cells at 16 hpi was not significantly changed in the presence of antibody blocking the poliovirus receptor to prevent secondary infection (Fig. S3B). We found that 39% of strains significantly enhanced the percent of dual-infected cells at least 2-fold over beads (Fig. 3AC). Additionally, the L. johnsonii- Fecal isolate, ΔepsA, and ΔepsE strains significantly enhanced dual infection by approximately 5–6 fold over beads (Fig. 3C). There was no correlation between viral binding efficiency and percentage of dual infected cells (Fig. 3BD). However, there was a strong correlation between total infectivity and percent of dual infected cells (Fig. 3E). These results suggest that bacteria that increase infection efficiency also increase co-infection efficiency, likely because they effectively increase the MOI. However, four strains, Staphylococcus sp., L. johnsonii- Fecal isolate, ΔepsA, and ΔepsE, were outliers and did not display a linear relationship between infectivity and co-infection frequencies. Instead, for these four strains, the co-infection frequency was much higher than would be predicted from the total percent of infected cells (Fig. 3EF), suggesting additional factors play a role in bacterial mediated delivery of multiple viruses to a single cell.
Figure 3. The Impact of Bacteria on Viral Co-infection.
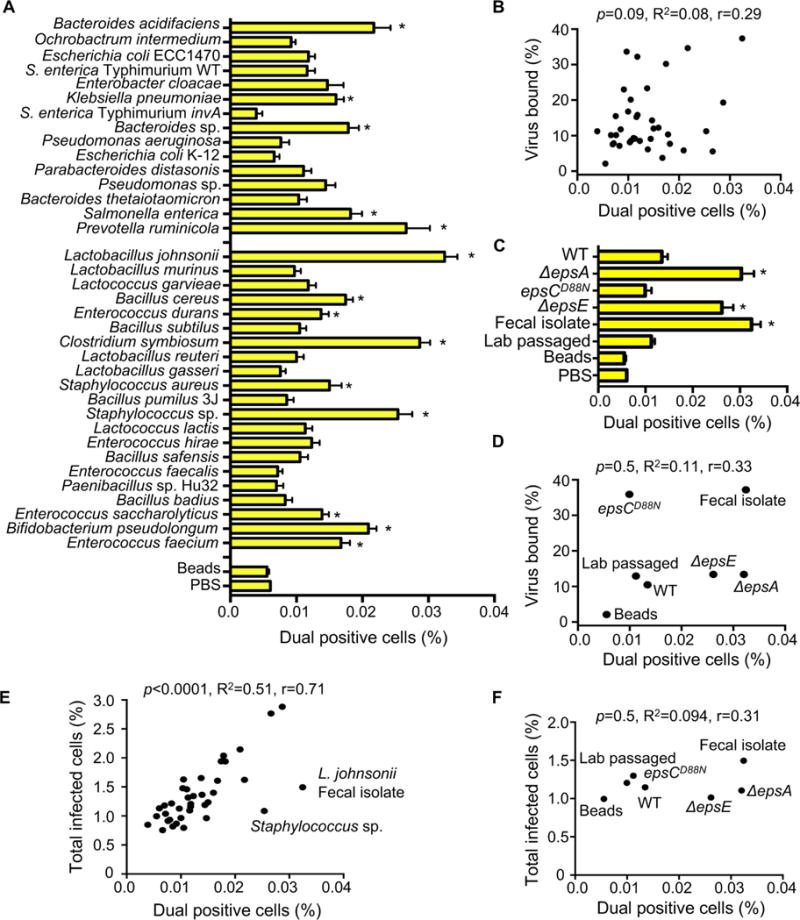
(A) Percentage of dual infected cells positive for both DsRed and GFP determined using the flow cytometry assay described in Figure 2. Data are represented as mean ± SEM (n=8–52, ≥3 independent experiments). *p<0.05 versus Beads (one-way ANOVA followed by Dunnet’s multiple comparison test). (B) Scatter plot to test for correlation between the percentage of dual infected cells and the percentage of virus bound for each bacterial strain. Data points are the mean values presented in Figures 3A and 1E. p=0.1, R2=0.08, r=0.3 (Pearson’s correlation coefficient calculation). (C) Percentage of dual infected cells for L. johnsonii strains. Data are represented as mean ± SEM (n≥6). *p<0.05 versus Beads (one-way ANOVA followed by Dunnet’s multiple comparison test). (D) Scatter plot to test for correlation between the percentage of dual infected cells and the percentage of virus bound for each L. johnsonii strain. Data points are the mean values presented in Figures 3C and 1F. p=0.5, R2=0.1, r=0.3 (Pearson’s correlation coefficient calculation). (E) Scatter plot to test for correlation between the percentage of dual infected cells and the total percent of infected cells. Data points are the mean values presented in Figures 3A and 2B. p<0.0001, R2=0.5, r=0.71 (Pearson’s correlation coefficient calculation). (F) Scatter plot to test for correlation between the percentage of dual infected cells and the total percent of infected cells for each L. johnsonii strain. Data points are the mean values presented in Figures 3C and 2D. p=0.5, R2=0.1, r=0.31 (Pearson’s correlation coefficient calculation). See also Figure S3.
Bacteria-Mediated Viral Co-Infection Correlates with Bacterial Adherence to Host Cells
To further investigate the ability of bacteria to impact viral co-infection frequency we evaluated the hypothesis that bacterial adherence and/or invasion of HeLa cells may drive co-infection. We measured bacterial invasion using a gentamicin protection assay. 1×10⁶ CFU of bacteria were incubated with 1×10⁵ HeLa cells for 1 h, treated with or without gentamicin for 2 h to kill extracellular bacteria, and the percent of intracellular bacteria was determined by CFU counts. Anaerobic bacteria were not included in these assays due to inconsistent survival. We found that wild-type S. enterica serovar Typhimurium, a positive control for invasion, had significantly higher numbers of intracellular bacteria compared to an isogenic invasion-deficient mutant (invA mutant)(Stojiljkovic et al., 1995; Winter et al., 2010)(Fig. 4A). All of the tested strains had less than 0.005% of input bacteria internalized, indicating that none are invasive (Fig. 4A and data not shown). To quantify bacterial adherence to HeLa cells, 1×10⁶ bacteria were incubated with 1×10⁵ HeLa cells for 1 h, followed by washing and quantification of cell-associated bacteria by CFU counts of HeLa lysate vs. input to reveal the percent of cell-associated bacteria. The adherence efficiencies of the strains varied greatly, ranging from 0.02 to 9% of cell-associated bacteria (Fig. 4B). A significant correlation was observed between the percent of cell-associated bacteria and the percentage of dual infected cells (Fig. 4C). As expected from previous studies, EPS levels of the isogenic L. johnsonii strains (Fig. S1D) inversely correlated with binding to mammalian cells (Fig. 4D)(Dertli et al., 2016; Horn et al., 2013). In contrast, despite having similar amounts of EPS (Fig. S1D), the L. johnsonii- Fecal isolate had 3-fold higher adherence to HeLa cells compared with the L. johnsonii- Lab passaged strain (Fig. 4D). For the L. johnsonii strains, the correlation between adhesion to HeLa cells and viral dual-infection was striking (Fig. 4E). These results indicate that bacterial adhesion to HeLa cells may drive viral co-infection. Curiously, there was no correlation between the total percent of cells infected (DsRed, GFP, or both) and bacterial adhesion efficiency (Fig. S4AB). Collectively, these data suggest that enhanced ability of bacteria to adhere to HeLa cells can increase viral co-infection frequency in a manner independent of enhanced total infectivity.
Figure 4. Bacterial Adherence to HeLa Cells and Impact on Viral Co-infection.
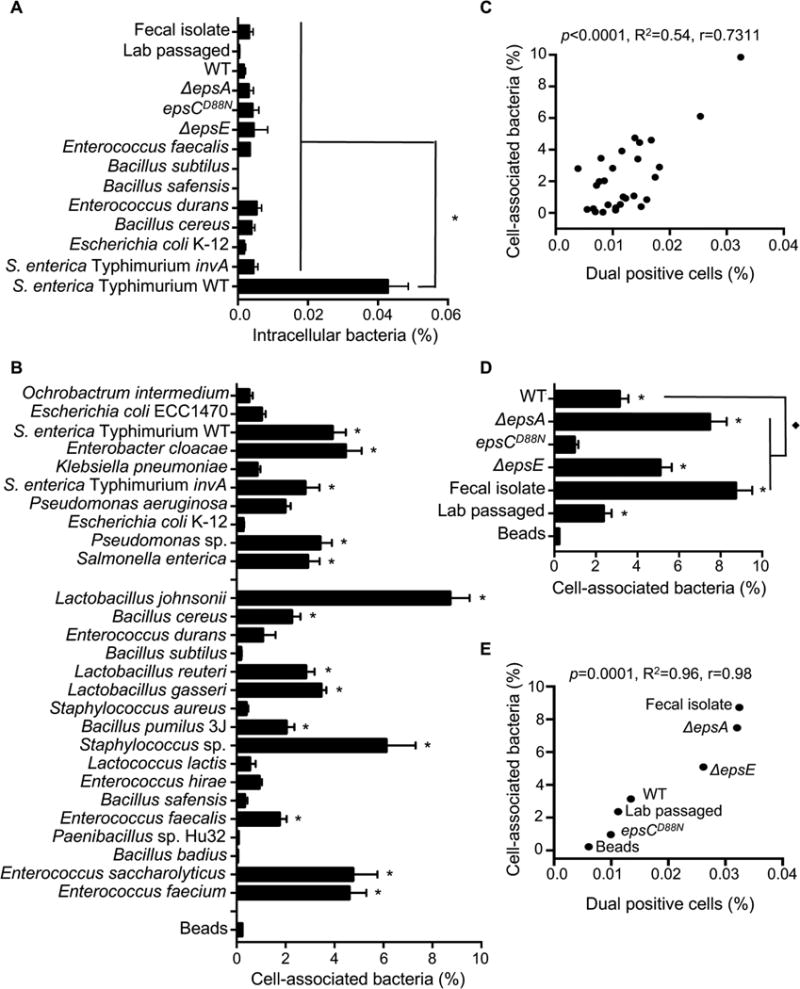
(A) Bacterial invasion assay. 1×10⁵ HeLa cells were incubated with 1×10⁶ CFU bacteria for 1 h, washed, and treated with or without gentamicin to kill extracellular bacteria. HeLa cells were lysed and the number of intracellular bacteria determined from CFU counts, and data are reported as percentage of input CFU. Data are represented as mean ± SEM (n≥3). *p<0.0001 versus S. enterica serovar Typhimurium WT (one-way ANOVA followed by Dunnet’s multiple comparison test). (B) Bacterial attachment to HeLa cells. 1×10⁵ HeLa cells were incubated with 1×10⁶ CFU bacteria for 1 h, washed, and the number of cell-associated bacteria was enumerated by CFU counts in HeLa lysates. The percent of cell-associated bacteria is shown as the percentage of total input CFU. The percent of cell-association for inert beads was determined from OD600 values of lysed Hela cells before (input) and after (attached) washing of the cell monolayers and are represented as percentage of input. Data are represented as mean ± SEM (n≥6). *p<0.05 versus beads (one-way ANOVA). (C) Scatter plot to test for correlation between the percentage of dual infected cells and the percentage of cell-associated bacteria. Data points are the mean values presented in Figures 3A and 4B. p<0.0001, R2=0.54, r=0.73 (Pearson’s correlation coefficient calculation). (D) Percentages of cell-associated bacteria for L. johnsonii strains. Data are represented as mean ± SEM (n≥6). *p<0.05 versus Beads or ◆p<0.05 versus WT (one-way ANOVA followed by Dunnet’s multiple comparison test). (E) Scatter plot to test for correlation between the percentage of dual infected cells and the percentage of cell-associated bacteria for L. johnsonii strains. Data points are the mean values presented in Figures 3C and 4D. p=0.0001, R2=0.96, r=0.98 (Pearson’s correlation coefficient calculation). See also Figure S4.
Exposure to Certain Bacterial Strains Enhances Poliovirus Genetic Recombination
Several studies have suggested that RNA viruses benefit from the delivery of multiple viral genomes to a single cell (Aguilera et al., 2017; Chen et al., 2015; Combe et al., 2015; Domingo and Holland, 1997; Duarte et al., 1994; Novella et al., 1995). Therefore, we asked whether bacteria with differential abilities to facilitate viral co-infection under low MOI conditions could affect the poliovirus recombination frequency and restoration of fitness. To quantify poliovirus recombination, we employed a well-characterized system consisting of two viruses that can be discriminated from each other and from recombinants by phenotype (Kirkegaard and Baltimore, 1986). Wild-type poliovirus is sensitive to the drug guanidine hydrochloride (DrugS), but can grow at the high temperature of 39.5°C (TempR). Conversely, a virus with mutations in the 2C coding region and an insertion in the 3′ non-coding region is resistant to guanidine hydrochloride (DrugR) and temperature sensitive (TempS). Upon high MOI infection with the DrugS/TempR and DrugR/TempS viruses, recombination can generate a variety of variants, including those that are DrugR/TempR and are able to replicate in the presence of drug at 39.5°C (Fig. 5A).
Figure 5. Effect of Bacterial Strains on Poliovirus Recombination Frequency.

(A) Diagram of recombination between DrugR/TempS and DrugS/TempR parental polioviruses. Triangle denotes mutation conferring guanidine (Drug) resistance and x denotes site of temperature sensitive mutations inhibiting replication at 39.5°C (Kirkegaard and Baltimore, 1986). The dotted line indicates the location of recombination events that create progeny that are able to grow at 39.5°C in the presence of 1 mM guanidine (DrugR/TempR). (B) Schematic of recombination assay. 1×10⁵ PFU of each parental virus was mixed and incubated with 1×10⁸ CFU bacteria prior to infection of 1×10⁷ HeLa cells (MOI of 0.01). Infection proceeded for 8 h under permissive conditions for both viruses (33°C without drug) and progeny viruses were quantified by plaque assay at both permissive and restrictive conditions to determine yields of individual parental viruses and recombinants. (C) Recombination frequencies after exposure to bacterial strains. Recombination frequencies are shown as the viral titers (PFU/mL) at 39.5°C+Drug divided by viral titers at 33°C−drug. HeLa cells were also infected in parallel with each parental virus alone as controls to calculate the frequency of reversion and de novo mutation acquisition. Data are represented as the mean ± SEM (n=4–12), from at least 2 independent experiments. *p<0.01 versus the mix of parental viruses in PBS (Student’s unpaired t test). (D) Scatter plot to test for correlation between the percentage of dual infected cells and the recombination frequency. Data points are the mean values presented in Figures 5C, 3A and 3C. p<0.0001, R2=0.93, r=0.97 (Pearson’s correlation coefficient calculation). See also Figure S5.
To determine whether bacteria can influence recombination even under low MOI conditions, we incubated 1×10⁵ PFU of both the DrugS/TempR and DrugR/TempS parental viruses or each alone with PBS or 1×10⁸ CFU bacteria prior to infection of 2×10⁷ HeLa cells (MOI=0.01) under dual permissive conditions (33°C, no drug) to facilitate replication of both parental viruses. At 8 hpi, viral progeny were harvested and quantified by plaque assays performed under permissive and restrictive growth conditions to calculate recombination frequencies and frequencies of confounding variables such as reversion of DrugR or TempS mutations or de novo mutation acquisition (Fig. 5B, S5AB). We found that each parental virus produced progeny with the expected frequencies/phenotypes during single infections: Both replicated efficiently at 33°C−drug, the DrugS/TempR parent had a 6,200-fold replication defect at 33°C+drug, the DrugR/TempS parent had a 26,000-fold replication defect at 39.5°C−drug, and both viruses had a >75,000-fold replication defect at 39.5°C+drug (Fig. S5B). However, when both viruses were incubated together in PBS prior to infection of HeLa cells, a small number of plaques formed at 39.5°C+drug (Fig. S5AB). This frequency of plaques at 39.5°C+drug was 20-fold higher than that observed from either parental virus alone, indicating that reversion or de novo DrugR or TempR mutation acquisition was negligible. By dividing the yield at 39.5°C+drug by the yield at 33°C−drug, we determined that viruses incubated with PBS had an observed recombination frequency of 2×10⁻⁴. When we incubated the parental viruses with bacteria prior to the infection, we found that recombination frequencies ranged from 1.6×10⁻⁴ to 1.2×10⁻³ (Fig. 5C). Prevotella ruminicola, L. johnsonii- Fecal isolate, ΔepsE, and ΔepsA strains all significantly increased recombinant yields by more than 4.6-fold over PBS (Fig. 5C and S5AC). Sequence analysis revealed that 83.3% of scored plaques were indeed genotypic recombinants, confirming the results from the phenotypic assay (Fig. S5AD). Next, we assessed the relationship between recombination frequencies (Fig. 5C) and co-infection frequencies (Fig. 3AC) for each strain and we observed a striking correlation (Fig. 5D). These data suggest that poliovirus interactions with certain bacteria prior to initial infection of host cells increases the probability that a cell will be infected with multiple viruses even at low viral concentrations. Furthermore, bacterial enhancement of viral co-infection can facilitate recombination, generating progeny with the ability to grow under otherwise restrictive conditions.
Certain Bacterial Strains Deliver More Than Two Viruses to a Host Cell
How many viruses do bacteria deliver to host cells when co-infection occurs, many or just two? Since co-infected cells are rare due to our intentionally low MOI, and only co-infected cells are informative to address this question, we sought to select for co-infected cells prior to determination of founding virus numbers. We used selective growth of recombinants, which are products of co-infection, in conjunction with genetically tagged viruses to determine the number of founding viruses per co-infected cell. As described in Figure 6AB, we used five barcoded polioviruses (Kuss et al., 2008) as the DrugS/TempR parental viruses for the recombination assay. If only two viruses are delivered per host cell–the minimum for observable recombination–we should detect the recombinant virus plus one of the five barcoded viruses. We mixed the five DrugS/TempR barcoded viruses with the DrugR/TempS parental virus (containing a WT barcode) in the presence or absence of four bacterial strains prior to infecting HeLa cells at a low MOI for several hours under permissive conditions to facilitate replication of recombinants and co-infecting barcode viruses. Prior to release of progeny viruses, we collected infected cells and plated dilutions of the cells on fresh monolayers to generate plaques (infectious center assay). These plates were incubated at 39.5°C + drug to select for recombinants: Only recombinant viruses should form plaques, spotlighting initially co-infected founder cells (Fig. 6B). Non-recombinant barcode viruses should not spread beyond the initially infected cell due to the selective conditions and lack of trans-complementation of the DrugR 2C protein (Kirkegaard and Baltimore, 1986; Nugent et al., 1999). However, if the barcode viruses replicated in the initially infected cell prior to plating under selective conditions, then they should be detectable after amplification of plaque viruses under permissive conditions. We picked plaques, amplified viruses under permissive conditions, and performed RT-PCR with specific primer sets to detect each viral barcode.
Figure 6. Examining the Number of Virions Delivered to Co-Infected Host Cells.
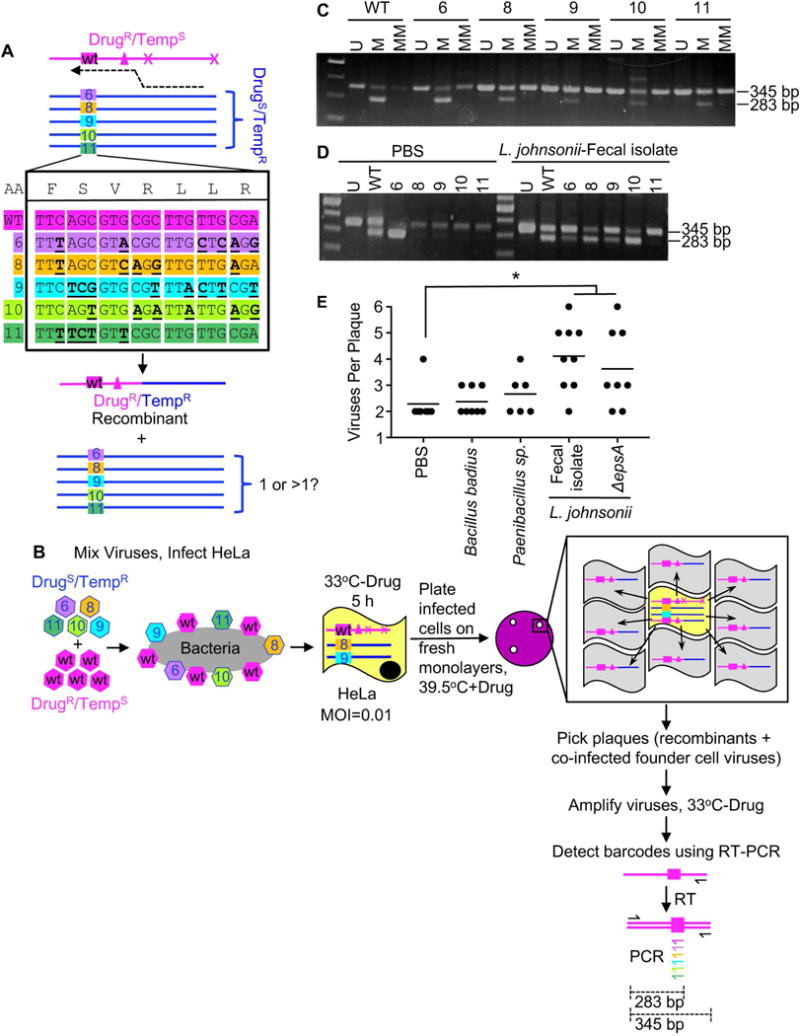
(A) Using barcoded viruses to discriminate founding viruses in co-infected cells. Five viruses (6, 8, 9, 10, 11) with silent mutation “barcodes” were used as the DrugS/TempR parental virus in recombination crosses with the DrugR/TempS virus, which contained a WT barcode. Based on the constellation of barcodes and phenotypic markers, legitimate recombinants contain the WT barcode and the DrugR/TempR markers, and we assessed whether viruses with other barcodes were present. (B) Using barcoded viruses and recombinant virus plaques to assess the number of founding viruses in co-infected cells. 2×10⁴ PFU of each DrugS/TempR barcode virus (6, 8, 9, 10, 11) was mixed with 1×10⁵ PFU of the DrugR/TempS virus with the WT barcode and the virus mixtures were incubated with or without 1×10⁸ CFU bacteria prior to infection of 2×10⁷ HeLa cells (MOI of 0.01). Infection proceeded for 5 h under permissive conditions (33°C without drug). Prior to release of progeny viruses, infected cells were harvested and dilutions of the cells were plated on fresh monolayers, agar overlays were added, and plates were incubated at 39.5°C in the presence of 1 mM guanidine to select for products of recombination. Only recombinant viruses spread radially (gray cells) from the initially co-infected cell (yellow), but the plaques contain the founder viruses in the center cell. Plaques were picked and viruses were amplified in naïve cells for 18 h, followed by extraction of RNA and cDNA synthesis using a universal poliovirus antisense primer. PCR was performed with a universal poliovirus sense primer and barcode-specific (colored) or universal (black) antisense primers. (C) Amplification specificity for viral barcodes. PCR was performed with cDNA from each individual virus with the universal sense primer and three different antisense primers: 1) the universal antisense primer (“U”, positive control, 345 bp product), 2) the matched antisense primer (“M”, 283 bp product from specific amplification, 345 bp product from carry-over universal antisense primer used in cDNA synthesis), or 3) a mixture of the primers to detect the other barcodes (“MM” for mismatched, 283 bp product only if non-specific amplification, 345 bp product from carry-over universal antisense primer used in cDNA synthesis). (D) Representative gel showing multiple barcode virus PCR products from two individual plaques. (E) Number of barcoded viruses per recombinant virus plaque. All recombinant plaques had the DrugR/TempR recombinant (WT barcode) and at least one additional barcode virus (6, 8, 9, 10, 11). Data points are individual plaques (n=6–9) with mean number of viruses per plaque shown. *p<0.05 versus the mix of parental viruses in PBS (Student’s unpaired t test).
First, we confirmed that each barcoded virus could be detected specifically by RT-PCR. RNA was extracted from cells infected with each barcoded virus and cDNA was synthesized using a universal antisense primer. Template cDNAs were amplified in PCRs using a universal sense primer and either a universal antisense primer (“U”, positive control), a virus-specific matched antisense primer (“M”), or a mixture of the other mismatched antisense primers (“MM”, negative control). Each viral cDNA was amplified only by the universal antisense primer and its matched antisense primer, confirming specificity (Fig. 6C).
Next, we determined which plaques contained the WT virus barcode. Because the DrugR/TempS parental virus contains a WT barcode and this WT barcode is 5′ of the recombination cross-over site between the DrugR and TempS alleles, all legitimate recombinants should contain the WT barcode and DrugR/TempR alleles (Fig. 6A). Indeed, 84% of plaques contained the WT barcode virus. This value is comparable to the frequency observed by sequencing, where 83% of 39.5°C+Drug plaques were recombinants and 17% were non-recombinant DrugS/TempR viruses that acquired de novo DrugR mutations (Fig. S5D). Since plaques without the WT barcode were likely not the products of co-infection, we eliminated them from subsequent analysis.
Finally, for all plaques containing the WT barcode virus, we determined whether the other barcode viruses were present using specific primer sets. In addition to the WT barcode virus, plaques generated by viruses pre-incubated with bacteria contained one to five additional barcode viruses (Fig. 6D). The number of different barcoded viruses correlated with the co-infection frequency and recombination frequency of each bacterial strain: Strains that promoted minimal co-infection and recombination had fewer barcoded viruses (B. badius and Paenibacillus sp.) and strains that promoted significant co-infection and recombination had more barcoded viruses (L. johnsonii- Fecal isolate and ΔepsA)(Fig. 6E). Recombinant plaques from the PBS control generally had two founder viruses, the basal requirement for observable recombination. Overall, this assay indicates that bacteria can deliver more than two viruses per host cell–in some cases, 50–100% of the available pool members.
DISCUSSION
As a platform to understand how bacteria can impact enteric viruses, we screened bacterial strains for the capacity to bind to poliovirus, facilitate viral infection and co-infection of mammalian cells, and promote viral genetic recombination. To mimic the first cycle of viral replication upon inter-host transmission, we used low MOI conditions in the presence or absence of bacteria. We found that exposure to certain bacteria enhanced viral infectivity and increased viral co-infection frequency even when the ratio of virus to host cells was low. Viral co-infection correlated with bacterial adherence to mammalian cells. Importantly, bacteria-mediated viral co-infection had functional consequences: bacteria that induced viral co-infection facilitated fitness restoration through genetic recombination, with progeny viruses able to replicate under conditions where parental viruses could not. Thus, bacteria-virus interactions may facilitate viral propagation and adaptation at initial sites of infection within a host.
First, we found that poliovirus bound to different bacteria with different efficiencies. Notably, although 90% of bacterial strains bound to poliovirus more efficiently than beads, only 5 of the 41 strains bound more than 30% of viral input. A specific poliovirus-bacteria binding ligand or common factor shared among these high binding strains has not been identified. While specific bacterial ligands important for poliovirus binding remain unclear, we used these strains to examine factors that impact bacteria-mediated viral infection and co-infection.
Next, we used a flow-cytometry assay to determine whether bacteria enhance poliovirus infectivity and co-infection of cells when the ratio of viruses to mammalian cells is low. Because only 13 of the 41 strains increased viral infectivity in this assay (Fig. 2BD), bacteria differ in their capacities to promote viral infection.
EM images showed multiple virions bound to various bacterial strains (Fig. 1A–D); therefore, we hypothesized that bacteria may deliver more than one viral genome to a mammalian cell. We found that the percentage of dual infected cells for polioviruses incubated with inert beads or PBS was close to the predicted Poisson distribution value (1% of cells infected; 0.005% of cells dual infected at MOI of 0.01). However, the actual co-infection frequency is likely higher than that observed here since cells infected with two DsRed or two GFP viruses cannot be scored. We found that 39% of the bacterial strains increased poliovirus co-infection frequency (Fig. 3AC). Not surprisingly, there was a strong correlation between co-infection frequency and the total percent of infected cells for most strains (Fig. 3E). However, four strains were outliers and increased co-infection far more than would be predicted from the total number of infected cells (Fig. 3EF). We do not know why these strains increased viral co-infection without increasing total infection to a similar extent. It is possible that these strains deliver a relatively large number of virions to a relatively small number of cells, and that infection events are underestimated in the assay since cells infected with two or more DsRed or GRP viruses are not discriminated from singly infected cells. Indeed, EM images of L. johnsonii- Fecal isolate show dozens of viral particles on the bacterial surface (Fig. 1D and data not shown) and L. johnsonii- Fecal isolate and ΔepsA could deliver more than four distinct virions per cell (Fig. 6E). Bacteria-mediated viral co-infection correlated with bacterial adhesion to mammalian cells (Fig. 4CE). These data suggest a model where bacteria must bind at least two virions (likely more), and adhere to cells to promote viral co-infection.
Because certain bacteria facilitated viral co-infection of cells, we wondered whether bacteria increase viral fitness by promoting genetic recombination. Observable recombination requires that two or more viruses co-infect the same cell. Therefore, previous experiments examining poliovirus recombination in cell culture were performed at high MOI (>10). Under high MOI conditions, several groups have shown that 1–20% of single cycle progeny are recombinants (Jarvis and Kirkegaard, 1992; King, 1988; Kirkegaard and Baltimore, 1986; Lowry et al., 2014; Runckel et al., 2013). Because the first cycle of replication following inter-host transmission is likely initiated by a small number of virions at mucosal sites, we sought to determine whether recombination is detectable under low MOI conditions and whether bacteria can facilitate viral recombination. We hypothesized that, at an MOI of 0.01, recombinants should be rare unless bacteria facilitate synchronous viral co-infection. We determined that PBS-treated parental viruses generated a recombination frequency of 2×10⁻⁴ (for the 190 nt interval between relevant alleles) under MOI 0.01 conditions. This recombination frequency was much higher than expected, given that previous work with these viruses using an MOI of 60 generated a recombination frequency of 1.3×10⁻³ (Kirkegaard and Baltimore, 1986). It is possible that recombination frequency does not correlate linearly with MOI, that the later time point for progeny collection used here (8 hpi vs. 4 hpi) enhances the observed recombination frequency, or that viral aggregates facilitated co-infection as we have recently shown (Aguilera et al., 2017). While our observed recombination frequency for PBS-treated parental viruses was 2×10⁻⁴, bacteria-exposed parental viruses generated recombination frequencies of 1.6×10⁻⁴ to 1.2×10⁻³. Recombinant progeny yields were significantly increased, up to 3.5-fold, for 4 out of 10 strains evaluated (Fig. 5C). As predicted, we found a striking correlation between bacteria mediated co-infection and poliovirus recombination frequency (Fig. 5D). Interestingly, bacteria that enhanced co-infection and recombination facilitated delivery of multiple viruses—up to six, the maximum that could be observed using our experimental approach (Fig. 6E). We used a relatively high ratio of bacteria to virus in these experiments to mimic the large bacterial numbers in the gut; thus, it is possible that co-infection and recombination frequencies could be even higher if we used a lower ratio of bacteria to virus.
Our results indicate that bacteria-mediated viral co-infection can facilitate recombination with the potential to drive adaptation and increase fitness. While our model system used genetic markers for ease of detection, our results would theoretically apply to escape from a variety of detrimental mutations. We speculate that bacteria-mediated enhancement of viral recombination in the first cycle of replication in a newly infected host may rescue viral defects that may otherwise culminate in abortive infection. Overall, by screening a panel of bacterial strains, our work revealed insights into virus-microbiota interactions and expands our understanding of how microbiota promote enteric viral infections.
STAR★Methods
Contact for Reagent and Resource Sharing
Further information and requests for resources and reagents should be directed to and will be fulfilled by the Lead Contact, Julie Pfeiffer (Julie.Pfeiffer@utsouthwestern.edu).
Experimental Model and Subject Details
Bacterial Strains
Bacterial strains were either acquired from collaborators, the ATCC, or were isolated from the cecal contents of healthy mice, as indicated in Table S1. For fecal isolates, fresh feces were resuspended in PBS containing 0.1% L-Cysteine (as a reducing agent to aid survival of anaerobic bacteria) prior to dilution and plating on rich media (see Fig. S1A). Plates were incubated at 37°C for 24–72 h in normal atmospheric conditions (aerobic), in incubators supplemented with 5% CO2, or in an anaerobic chamber. Well separated colonies were picked, streaked for isolation, and identified based on 16S rDNA sequencing of PCR products generated with one of two bacterial universal primer sets (Forward: 5′ AGAGTTTGATYMTGGCTCAG, Reverse: 5′ACGGYTACCTTGTTACGACTT or Forward: 5′ CCAGACTCCTACGGGAGGCAGC, Reverse: 5′ CTTGTGCGGGCCCCCGTCAATTC) (Rudi et al., 1997). For experiments, 25 mL liquid cultures of bacterial strains were inoculated from frozen glycerol stocks and incubated under conditions/media listed in Figure S1A. The next day, cultures were centrifuged at 4,000 rpm for 20 min, pellets were washed and bacteria were resuspended in PBS. Bacterial concentrations were determined by OD600 values and comparison to standard curves of CFU dilutions.
Viruses and Cells
Poliovirus work was performed under BSL2+ conditions as recommended by the World Health Organization. All experiments used serotype 1 Mahoney poliovirus and HeLa cells. HeLa (cervical cancer) cells were a gift from K. Kirkegaard and were authenticated in March, 2016 by the University of Arizona Genetics Core using short tandem repeat (STR) profiling with the Promega PowerPlex16HS Assay. HeLa cells were grown in Dulbecco’s modified Eagle’s medium (DMEM) supplemented with 10% calf serum and 1% penicillin-streptomycin in 5% CO2. Virus stocks were generated from infectious clone plasmids as previously described (Kuss et al., 2011; Racaniello and Baltimore, 1981). The DrugR/TempS virus, 3NC-202guaR, contains a mutation that confers guanidine resistance (2C-M187L) and two mutations that confer temperature sensitivity (2C-V250A and an insertion in the 3′ noncoding region, 3NC-202)(Kirkegaard and Baltimore, 1986; Sarnow et al., 1986). Wild-type poliovirus was used as the DrugS/TempR virus. DsRed- and GFP-expressing viruses contain fluorescent protein sequences inserted after amino acid 144 of poliovirus protein 2A (Teterina et al., 2010). Barcoded viruses 6, 8, 9, 10, 11 are DrugS/TempR and contain silent point mutations that facilitate discrimination by RT-PCR or hybridization (Kuss et al., 2008).
Method Details
Mice
Mice were handled according to the Guide for the Care of Laboratory Animals of the National Institutes of Health. All mouse studies were performed at UT Southwestern (Animal Welfare Assurance #A3472-01) using protocols approved by the local Institutional Animal Care and Use Committee. C57BL/6 PVR-IFNAR−/− mice, expressing the human PVR and deficient for the IFNα/β receptor, were obtained from S. Koike (Tokyo, Japan)(Ida-Hosonuma et al., 2005). Mice were maintained in specific pathogen-free facilities and were housed in individually ventilated cages with ad libitum access to water and feed (irradiated Envigo Global 16% Protein Rodent Diet #2916). On 3–5 separate occasions, pairs of co-housed six-week old male mice were euthanized using carbon dioxide inhalation and cecal contents were collected to isolate bacterial strains as described below.
Electron Microscopy
Poliovirus was purified by cesium chloride gradient centrifugation, followed by concentration and desalting using Amicon filters (Millipore) as previously described (Kuss et al., 2011). Prior to imaging, 1×10⁶ CFU (as determined by OD600 values) of indicated bacterial strains was incubated with or without 1×10⁷ PFU poliovirus for 1 h at 37°C to facilitate binding. Samples were fixed with 2.5% glutaraldehyde for 1 h at room temperature and 2.5 μl of the inactivated virus was placed on 400 mesh carbon-coated copper grids that had been glow discharged for 30 s using PELCO EasiGlowTM 91000. The grids were stained with 2% phosphotungstic acid and examined using a TEI Technai G2 Spirit Biotwin transmission electron microscope (FEI, Hillsboro, OR) equipped with Gatan ultrascan charge-coupled-device (CCD) camera, and with a side-mounted SIS Morada 11-megapixel CCD camera, operated at an acceleration voltage of 120 kV. Images were taken at magnifications of 43,000× and 60,000×.
Viral Pull Down Assays
35S-labeled poliovirus (1×10⁶ PFU/5,000 CPM) was generated as previously described (Kuss et al., 2011) and incubated with 1×10⁹ CFU bacteria (as determined by OD600 values) or ~3.5×10⁶ inert beads (Dynabeads M-280 Streptavidin, Invitrogen) for 1 h at 37°C to facilitate viral binding. Following incubation, samples were centrifuged at 4,000 rpm for 20 min, washed with PBS, and 35S was quantified in a scintillation counter.
EPS Isolation and Quantification
Capsular EPS was isolated using methods adapted from (Dertli et al., 2016). Lactobacillus strains were inoculated from glycerol stocks into 20 mL of MRS broth and grown overnight, and these cultures were used to inoculate 500 mL of MRS broth, and cultures were grown for 48 h. Cultures were agitated vigorously to disperse aggregates and aliquots were plated for total CFU determination. Bacteria cells were pelleted by centrifugation at 6,000 × g for 30 min at 4°C and washed twice. Bacterial pellets were res uspended in 50 mL of 1M NaCl and capsular EPS was extracted from cells by sonication (4 times for 45 seconds at 30% amplitude). To remove insoluble material samples were centrifuged at 6,000 × g for 30 min and supernatants were collected. EPS was precipitated by adding an equal volume of ethanol and incubating at −20°C overnight, then centrifuged at 10,000 × g for 30 min at 4°C and supernatant was discarded. Pellets were resuspended in water and EPS was recovered with ethanol precipitation repeated twice, with final resuspension in 20 mL water, followed by dialysis for 72 h at 4°C using 12–14 kDa dialysis m embranes. Samples from dialysis tubing were then lyophilized by freeze drying for 2 days. Freeze dried pellets were weighed and resuspended in 10 mL water to provide crude EPS for further analysis.
EPS produced from each of the L. johnsonii strains was quantified using the phenol-sulfuric method (DuBois et al., 1956; Masuko et al., 2005) with glucose as the standard. A standard curve was generated using D-Glucose (Sigma) in water. EPS samples were serially diluted in 100 μL water in glass tubes and 100 μL 5% phenol/water (Sigma-P9346) was added. Samples were vortexed and 500 μL of concentrated sulfuric acid (96%) was added, mixed, and 200 μL was used for absorbance readings at 490nm. EPS quantity of each sample was calculated using glucose standard curve and is expressed as μg per total CFU.
Flow Cytometry
The flow cytometry based assay for co-infection was performed as previously described (Aguilera et al., 2017). Polioviruses were derived from Mahoney serotype 1 poliovirus with DsRed or GFP fluorescent proteins inserted after amino acid 144 of poliovirus protein 2A (Teterina et al., 2010). 1×10⁴ PFU of DsRed-Poliovirus and 1×10⁴ PFU GFP-Poliovirus were incubated in 200 μL PBS+ (PBS supplemented with 100 μg/mL MgCl2 and CaCl2) or 1×10⁸ CFU bacteria or Beads (Dynabeads M-280 Streptavidin, Invitrogen) for 1 h at 37°C. Samples (200 μL total) were added to 2×10⁶ HeLa cells for 30 min at 37°C. Cell monolayers were washed 3 times and 2 mL DMEM supplemented with 5% calf serum and 1% penicillin-streptomycin was added to cells. After incubation at 37°C for 16 h cells were harvested using 0.1% trypsin-0.05% EDTA, washed and fixed with 2% paraformaldehyde/PBS for 15 min at room temperature, washed and resuspended in 300 μL PBS containing 1% bovine serum albumin and sieved with 35-μm cell strainer snap cap tubes prior to analysis by FACs. DsRed and GFP expression was determined from at least 5×10⁵ events using a FACSCalibur cytometer (Becton Dickinson, Franklin Lakes, NJ) equipped with 488- and 635-nm lasers. GFP was excited by an argon laser and fluorescence was detected using a 530 nm bandpass filter in the FL1 channel and DsRed fluorescence or propidium iodide emission was detected using a 585nm bandpass filter in the FL2 channel. Data were analyzed using FlowJo software. For propidium iodide (PI) counterstaining, 10 μL of PI staining solution (10 μg of PI/mL of PBS) was added to fixed cells 30 min prior to FACs analysis. Apoptotic cells, dead cells, debris, and cell clusters were distinguished from healthy single HeLa cells by plotting FL2 area vs. FL2 width in PI stained controls and the subsequent light scatter gate (FSC vs. SSC) was applied to all samples to include only events characteristic of healthy HeLa cells. Elimination of autofluorescent cells was done by plotting FL2-H vs. FL4-H and gating on FL2+ and FL4− events. Gates were manually established using several control groups in each experiment: uninfected HeLa cells, DsRed-PV-infected HeLa cells, GFP-PV-infected HeLa cells, and versions of each of these groups with each of the bacterial strains. The calculated limit of detection (LOD) of dual infected cells was determined from the mean dual positive from uninfected cells + 1.645 × standard deviation (SD) of the frequency of spurious dual positive events from uninfected cells+bacteria, GFP or DsRed alone infected cells, and cells infected with GFP+DsRed at an MOI < 0.001 (n≥40) and was calculated as 3 dual infected cells. The LOD was also experimentally determined by generating dual-infected cells, diluting them into an excess of uninfected cells, and quantifying the number of detectable dual infected cells. We infected HeLa cells at an MOI of 0.5 with 5×10⁵ DsRed- and GFP-expressing polioviruses to generate dual infected cells. Infections using MOIs higher than 0.5 resulted in a large percentage of cell death and a shift in the forward (FSC) and side scatter (SSC) characteristics of the cells; therefore, we used an MOI of 0.5, which generated 10% dual-infected cells. At 16 hpi, cells were harvested and serially diluted with uninfected HeLa cells for a total of 106 total cells so that dual infected cells represented approximately 0–10% (1–10,000 cells) of the total. The mixtures of infected and uninfected cells were then fixed, washed and processed as described above for FACs analysis of dual infected cells. The empirical determination of the limit of detection of dual infected cells was 0.0018%, or 6 dual infected cells. The lowest number of events included in our analysis of dual positive cells was 0.003%, or 10 dual positive cells, which is above the determined LOD for the flow cytometry assay. There were no statistically significant differences in the frequencies of GFP- vs. DsRed-positive cells in each condition and alternative gating strategies did not alter the relative ratios of DsRed-positive, GFP-positive, and dual-positive cells (data not shown).
Bacterial Invasion and Adherence Assays
Bacteria were inoculated from glycerol stocks into 5 mL growth medium and grown overnight as described above in Bacterial Strains and Figure S1A. 1 mL of culture was centrifuged at 5,000 × g for 5 min, washed and resuspended in 1 mL PBS. The OD600 was measured and bacteria diluted in PBS to reach OD600=0.01, or approximately 1×10⁶ CFU bacteria in 100 μL PBS. Serial dilutions were plated on appropriate agar plates and incubated at 37°C for 24–72 h for input CFU/mL determination, or added to 105 HeLa cells for experiments. After incubation at 37°C for 1 h cells were washed 5 time s with PBS and 0.5 mL of DMEM and 5% calf serum (for attachment assay) or DMEM and 5% calf serum and 100 μg/mL Gentamicin (for invasion assay) was added. After incubation at 37°C for 2 h cell monolayers were washed 3 times with PBS and 0.5 mL 1% TritonX-100 in PBS was added for 15 min at room temperature to lyse HeLa cells. The lysate was collected and mixed vigorously. Serial dilutions of lysate in PBS was plated on appropriate agar plates and incubated at 37°C for 24–72 h. Bacterial colonies were counted and CFU/mL determined. We quantified the adherence of control beads (Dynabeads M-280 Streptavidin, Invitrogen) using OD600 analysis. The percent of cell-associated beads was calculated by the OD600 of beads+wash divided by OD600 of beads-wash. To rule out the possibility that the majority of apparent bacterial adherence to HeLa cells was due to bacterial binding to the plastic dishes, the assay was performed in the absence of HeLa cells for a subset of bacterial strains. We found that background from binding to plastic was generally 0.1% or less of the input bacterial counts. Given that most of these strains had HeLa cell association values ranging from 1% to 8%, we conclude that binding to plastic did not contribute substantially to the values shown in Fig. 4B and 4D (data not shown).
Recombination Assays
Viruses used for the recombination assay, wild type Mahoney serotype 1 poliovirus (DrugS/TempR) and mutant poliovirus 3NC-202guaR (DrugR/TempS) were previously described (Kirkegaard and Baltimore, 1986; Racaniello and Baltimore, 1981). Prior to infection 1×10⁵ PFU of both the DrugS/TempR and DrugR/TempS parental viruses or 1×10⁵ PFU of each alone were incubated with 1 mL PBS or 1 mL PBS and 1×10⁸ CFU bacteria at 37°C for 1 h, then added to 1×10⁷ HeLa cells (poliovirus PFU:HeLa cell MOI=0.01). After incubation at 33°C for 30 min, virus and bacteria were removed by washing 2 times with PBS. 10 mL of DMEM containing 5% calf serum and 1% penicillin-streptomycin was added and plates incubated at 33°C for 8 h. Cells were harves ted by scraping and resuspended in 1 mL of PBS followed by freeze thawing three times to lyse the cells and release progeny viruses. Samples were centrifuged to remove cell debris at 1,500 × g for 10 min and viral supernatant collected. Dilutions of the viral stocks were added to 4 × 6-well plates of HeLa cells for titer analysis. After 30 min incubation at 33°C, the viru s was removed by washing and 5 mL of 1% agar/DMEM or 1% agar/DMEM containing 1 mM guanidine was added to the cells and incubated at 4 separate conditions: 33°C, 33°C and 1 mM guanidine, 39.5°C, and 39.5°C and 1 mM guanidine. After incubation for 2 days at 39.5°C or 4 days at 33°C, agar overlays were removed and cells stained with 0.1% crystal violet for plaque enumeration and calculation of PFU/mL. For RNA extraction and sequencing of progeny viruses/recombinants, prior to removal of agar overlay from plates incubated at 39.5°C and 1 mM guanidine, single plaques were picked and virus amplified on HeLa cells for 4 h. Infected cells were harvested and added to 1 mL TRIZOL for RNA extractions and RT-PCR. Sequences of RT-PCR products using primers for poliovirus genome region 2C from nucleotides 4352 to 4955 were generated using the UT Southwestern Sequencing Core.
Analysis of Number of Founder Viruses per Co-Infected Cell
2×10⁴ PFU of each DrugR/TempS barcode virus (6, 8, 9, 10, 11; 1×10⁵ PFU total) and 1×10⁵ PFU of the DrugS/TempR parental viruses were mixed and incubated with 1 mL PBS or 1 mL PBS and 1×10⁸ CFU bacteria at 37°C for 1 h, then added to 2×10⁷ HeLa cells (poliovirus PFU:HeLa cell MOI=0.01). After incubation at 33°C f or 30 min, virus and bacteria were removed by washing 2 times with PBS. 10 mL of DMEM containing 5% calf serum and 1% penicillin-streptomycin was added and plates incubated at 33°C for 5 h. Cells were harvested by trypsinization and dilutions of the intact infected cells were plated on monolayers of HeLa cells. After 1 h incubation at 33°C to facilitate c ell attachment, 1% agar/DMEM containing 1 mM guanidine was added to the cells and incubated 39.5°C. After incubation for 2–3 days, plaques were picked and plaque viruses were amplified in naïve HeLa cells for 18 h at 37°C in the absence of drug. Infected cells were harvested and added to 1 mL TRIZOL for RNA extractions and RT-PCR. cDNA was synthesized using a universal antisense primer (BN2 anti 5′ATGCTTTCAAGCATCTGACCTAACC), and PCR was performed with a universal sense primer (2160 sense 5′CTGTTGGTGTCATACGCG) and specific antisense primers specific to each barcode (primers: WT anti 5′TCGCAACAAGCGCACGCTG, 6 anti 5′CCTGAGCAAGCGTACGCTA, 8 anti 5′TCTCAACAACCTGACGCTA, 9 anti 5′ACGAAGTAAACGCACCGAG, 10 anti 5′CCTCAATAATCTCACACTG, 11 anti 5′TCGCAACAAGCGAACAGAA)(annealing temperature= 54°C, 3 0 cycles). PCR products were run on 1.5% agarose gels and stained with ethidium bromide. To test for specificity of amplification, PCR was performed for cDNA from each individual virus with the universal sense primer and 1) the universal antisense primer (“U”, positive control, 345 bp product), 2) its matched antisense primer (“M”, 283 bp product from specific amplification, 345 bp product from carry-over universal antisense primer from cDNA synthesis), or 3) a mixture of the primers to detect the other mismatched barcodes (“MM”, 283 bp product only if non-specific amplification, 345 bp product from carry-over universal antisense primer from cDNA synthesis). Initially, plaque-derived viruses were screened for the presence of the WT barcode to confirm recombinant virus (DrugR/TempR/WT barcode) was present, and therefore that the original founder cell was indeed co-infected. 7 of 45 plaques did not contain the WT virus barcode and were not analyzed further. The remaining samples were screened for the presence of the other barcoded viruses and the total number of founding viruses per plaque was determined. As expected, all recombinant plaques contained at least two barcodes (WT barcode plus an additional barcode= 2 founders) and some contained all six barcodes (WT and 6, 8, 9, 10, 11). All 5 barcoded viruses were approximately equally represented in total plaques analyzed with no significant differences in representation between each condition (p=0.1 to p=0.96, Student’s unpaired t test). Although plaques were picked from plates that only had 3–4 well-spaced plaques, it is possible that when plaques were picked, nearby founder cells that harbored non-recombinant virus (unable to form plaques) were also present and amplified along with the desired co-infected founder cell at the center of the plaque. Thus, theoretically, a barcoded virus that was not present in the founder cell of interest could be detectable and manifest as >2 founding viruses in the co-infected cell. If this was a common occurrence, it should be possible to amplify virus from areas of the cell monolayer that lack plaques. Of 56 “plaques” that were picked for analysis, 11 ended up not containing detectable virus in the RT-PCR assay. This means that at least 11 agar plugs/HeLa cell clusters did not contain detectable virus and therefore it is unlikely that signal from non-plaque associated cells contributes significantly to our scoring of founding virus numbers in this assay (data not shown).
Quantification and Statistical Analysis
Data were analyzed using GraphPad Prism v7 and are presented as the mean values ± standard error of mean (SEM). The figure legends report the number of biological replicates (n), the number of independent experiments, and the statistical tests performed. Differences were analyzed using either unpaired t test, ANOVA followed by Dunnet’s multiple comparison test, or by calculation of Pearson’s correlation coefficient (r). For scatter plot data the calculated p-value (two-tailed), R squared (R2), and Pearson’s r are reported in figures. Differences were considered significant at *p < 0.05.
Data and Software Availability
The bacterial 16S rRNA sequences reported in this paper are listed in Figure S1A and have been deposited in the NCBI database. (https://www.ncbi.nlm.nih.gov/popset/?term=ky950611).
Supplementary Material
Highlights.
Screened a diverse panel of bacterial strains for their effects on enteric virus infection
Multiple poliovirus virions bind to a variety of bacterial strains
Bacteria facilitate poliovirus co-infection under low MOI conditions
Bacteria enhance viral fitness by promoting genetic recombination
Acknowledgments
We thank Karla Kirkegaard for DrugR/TempS (3NC-202guaR) and PV-2A144-DsRed plasmids, John Schoggins for the PV-2A144-GFP plasmid, and Lora Hooper and Lisa Forrest for bacterial strains. We also thank the Electron Microscopy and Flow Cytometry Core Facilities at UT Southwestern. Finally, we thank Matthew Taylor for a helpful tip about DrugR/TempS poliovirus.
This work was funded by NIH NIAID grants R01 AI74668 and R21 AI114927, and a Burroughs Wellcome Fund Investigators in the Pathogenesis of Infectious Diseases Award to J.K.P. The research of J.K.P. was supported in part by a Faculty Scholar grant from the Howard Hughes Medical Institute. Work in S.E.W.’s lab is supported by NIH NIAID grants R01 AI118807 and R21 AI128151.
Footnotes
Publisher's Disclaimer: This is a PDF file of an unedited manuscript that has been accepted for publication. As a service to our customers we are providing this early version of the manuscript. The manuscript will undergo copyediting, typesetting, and review of the resulting proof before it is published in its final citable form. Please note that during the production process errors may be discovered which could affect the content, and all legal disclaimers that apply to the journal pertain.
Author Contributions
Conceptualization, A.K.E, J.K.P.; Investigation, A.K.E, P.R.J.; Writing – Original Draft, A.K.E, J.K.P.; Writing – Review & Editing, A.K.E, P.R.J., J.K.P., S.E.W, M.J.M., A.N.; Funding Acquisition, J.K.P., S.E.W.; Resources, M.J.M., A.N., S.E.W.; Supervision, J.K.P.
References
- Aguilera ER, Erickson AK, Jesudhasan PR, Robinson CM, Pfeiffer JK. Plaques Formed by Mutagenized Viral Populations Have Elevated Coinfection Frequencies. MBio. 2017;8 doi: 10.1128/mBio.02020-16. [DOI] [PMC free article] [PubMed] [Google Scholar]
- Almand EA, Moore MD, Outlaw J, Jaykus LA. Human norovirus binding to select bacteria representative of the human gut microbiota. PLoS One. 2017;12:e0173124. doi: 10.1371/journal.pone.0173124. [DOI] [PMC free article] [PubMed] [Google Scholar]
- Baldridge MT, Nice TJ, McCune BT, Yokoyama CC, Kambal A, Wheadon M, Diamond MS, Ivanova Y, Artyomov M, Virgin HW. Commensal microbes and interferon-lambda determine persistence of enteric murine norovirus infection. Science. 2015;347:266–269. doi: 10.1126/science.1258025. [DOI] [PMC free article] [PubMed] [Google Scholar]
- Chen YH, Du W, Hagemeijer MC, Takvorian PM, Pau C, Cali A, Brantner CA, Stempinski ES, Connelly PS, Ma HC, et al. Phosphatidylserine vesicles enable efficient en bloc transmission of enteroviruses. Cell. 2015;160:619–630. doi: 10.1016/j.cell.2015.01.032. [DOI] [PMC free article] [PubMed] [Google Scholar]
- Combe M, Garijo R, Geller R, Cuevas JM, Sanjuan R. Single-Cell Analysis of RNA Virus Infection Identifies Multiple Genetically Diverse Viral Genomes within Single Infectious Units. Cell Host Microbe. 2015;18:424–432. doi: 10.1016/j.chom.2015.09.009. [DOI] [PMC free article] [PubMed] [Google Scholar]
- Cuervo NS, Guillot S, Romanenkova N, Combiescu M, Aubert-Combiescu A, Seghier M, Caro V, Crainic R, Delpeyroux F. Genomic features of intertypic recombinant sabin poliovirus strains excreted by primary vaccinees. J Virol. 2001;75:5740–5751. doi: 10.1128/JVI.75.13.5740-5751.2001. [DOI] [PMC free article] [PubMed] [Google Scholar]
- Dertli E, Colquhoun IJ, Gunning AP, Bongaerts RJ, Le Gall G, Bonev BB, Mayer MJ, Narbad A. Structure and biosynthesis of two exopolysaccharides produced by Lactobacillus johnsonii FI9785. J Biol Chem. 2013;288:31938–31951. doi: 10.1074/jbc.M113.507418. [DOI] [PMC free article] [PubMed] [Google Scholar]
- Dertli E, Mayer MJ, Colquhoun IJ, Narbad A. EpsA is an essential gene in exopolysaccharide production in Lactobacillus johnsonii FI9785. Microb Biotechnol. 2016;9:496–501. doi: 10.1111/1751-7915.12314. [DOI] [PMC free article] [PubMed] [Google Scholar]
- Domingo E, Holland JJ. RNA virus mutations and fitness for survival. Annu Rev Microbiol. 1997;51:151–178. doi: 10.1146/annurev.micro.51.1.151. [DOI] [PubMed] [Google Scholar]
- Duarte EA, Novella IS, Ledesma S, Clarke DK, Moya A, Elena SF, Domingo E, Holland JJ. Subclonal components of consensus fitness in an RNA virus clone. J Virol. 1994;68:4295–4301. doi: 10.1128/jvi.68.7.4295-4301.1994. [DOI] [PMC free article] [PubMed] [Google Scholar]
- DuBois M, Gilles KA, Hamilton JK, Rebers PA, Smith F. Colorimetric Method for Determination of Sugars and Related Substances. Anal Chem. 1956;28:350–356. [Google Scholar]
- Duerkop BA, Clements CV, Rollins D, Rodrigues JL, Hooper LV. A composite bacteriophage alters colonization by an intestinal commensal bacterium. Proc Natl Acad Sci U S A. 2012;109:17621–17626. doi: 10.1073/pnas.1206136109. [DOI] [PMC free article] [PubMed] [Google Scholar]
- Egger D, Bienz K. Recombination of poliovirus RNA proceeds in mixed replication complexes originating from distinct replication start sites. J Virol. 2002;76:10960–10971. doi: 10.1128/JVI.76.21.10960-10971.2002. [DOI] [PMC free article] [PubMed] [Google Scholar]
- Ermund A, Schutte A, Johansson ME, Gustafsson JK, Hansson GC. Studies of mucus in mouse stomach, small intestine, and colon. I. Gastrointestinal mucus layers have different properties depending on location as well as over the Peyer’s patches. Am J Physiol Gastrointest Liver Physiol. 2013;305:G341–347. doi: 10.1152/ajpgi.00046.2013. [DOI] [PMC free article] [PubMed] [Google Scholar]
- Horn N, Wegmann U, Dertli E, Mulholland F, Collins SR, Waldron KW, Bongaerts RJ, Mayer MJ, Narbad A. Spontaneous mutation reveals influence of exopolysaccharide on Lactobacillus johnsonii surface characteristics. PLoS One. 2013;8:e59957. doi: 10.1371/journal.pone.0059957. [DOI] [PMC free article] [PubMed] [Google Scholar]
- Ida-Hosonuma M, Iwasaki T, Yoshikawa T, Nagata N, Sato Y, Sata T, Yoneyama M, Fujita T, Taya C, Yonekawa H, et al. The alpha/beta interferon response controls tissue tropism and pathogenicity of poliovirus. J Virol. 2005;79:4460–4469. doi: 10.1128/JVI.79.7.4460-4469.2005. [DOI] [PMC free article] [PubMed] [Google Scholar]
- Jarvis TC, Kirkegaard K. Poliovirus RNA recombination: mechanistic studies in the absence of selection. EMBO J. 1992;11:3135–3145. doi: 10.1002/j.1460-2075.1992.tb05386.x. [DOI] [PMC free article] [PubMed] [Google Scholar]
- Jones MK, Watanabe M, Zhu S, Graves CL, Keyes LR, Grau KR, Gonzalez-Hernandez MB, Iovine NM, Wobus CE, Vinje J, et al. Enteric bacteria promote human and mouse norovirus infection of B cells. Science. 2014;346:755–759. doi: 10.1126/science.1257147. [DOI] [PMC free article] [PubMed] [Google Scholar]
- Kane M, Case LK, Kopaskie K, Kozlova A, MacDearmid C, Chervonsky AV, Golovkina TV. Successful transmission of a retrovirus depends on the commensal microbiota. Science. 2011;334:245–249. doi: 10.1126/science.1210718. [DOI] [PMC free article] [PubMed] [Google Scholar]
- King AM. Preferred sites of recombination in poliovirus RNA: an analysis of 40 intertypic cross-over sequences. Nucleic Acids Res. 1988;16:11705–11723. doi: 10.1093/nar/16.24.11705. [DOI] [PMC free article] [PubMed] [Google Scholar]
- Kirkegaard K, Baltimore D. The mechanism of RNA recombination in poliovirus. Cell. 1986;47:433–443. doi: 10.1016/0092-8674(86)90600-8. [DOI] [PMC free article] [PubMed] [Google Scholar]
- Koropatkin NM, Martens EC, Gordon JI, Smith TJ. Starch catabolism by a prominent human gut symbiont is directed by the recognition of amylose helices. Structure. 2008;16:1105–1115. doi: 10.1016/j.str.2008.03.017. [DOI] [PMC free article] [PubMed] [Google Scholar]
- Kuss SK, Best GT, Etheredge CA, Pruijssers AJ, Frierson JM, Hooper LV, Dermody TS, Pfeiffer JK. Intestinal microbiota promote enteric virus replication and systemic pathogenesis. Science. 2011;334:249–252. doi: 10.1126/science.1211057. [DOI] [PMC free article] [PubMed] [Google Scholar]
- Kuss SK, Etheredge CA, Pfeiffer JK. Multiple host barriers restrict poliovirus trafficking in mice. PLoS Pathog. 2008;4:e1000082. doi: 10.1371/journal.ppat.1000082. [DOI] [PMC free article] [PubMed] [Google Scholar]
- Li D, Breiman A, le Pendu J, Uyttendaele M. Binding to histo-blood group antigen-expressing bacteria protects human norovirus from acute heat stress. Frontiers in Microbiology. 2015;6 doi: 10.3389/fmicb.2015.00659. [DOI] [PMC free article] [PubMed] [Google Scholar]
- Lowry K, Woodman A, Cook J, Evans DJ. Recombination in enteroviruses is a biphasic replicative process involving the generation of greater-than genome length ‘imprecise’ intermediates. PLoS Pathog. 2014;10:e1004191. doi: 10.1371/journal.ppat.1004191. [DOI] [PMC free article] [PubMed] [Google Scholar]
- Masuko T, Minami A, Iwasaki N, Majima T, Nishimura S, Lee YC. Carbohydrate analysis by a phenol-sulfuric acid method in microplate format. Anal Biochem. 2005;339:69–72. doi: 10.1016/j.ab.2004.12.001. [DOI] [PubMed] [Google Scholar]
- Minor PD, John A, Ferguson M, Icenogle JP. Antigenic and molecular evolution of the vaccine strain of type 3 poliovirus during the period of excretion by a primary vaccinee. J Gen Virol. 1986;67(Pt 4):693–706. doi: 10.1099/0022-1317-67-4-693. [DOI] [PubMed] [Google Scholar]
- Miura T, Sano D, Suenaga A, Yoshimura T, Fuzawa M, Nakagomi T, Nakagomi O, Okabe S. Histo-blood group antigen-like substances of human enteric bacteria as specific adsorbents for human noroviruses. J Virol. 2013;87:9441–9451. doi: 10.1128/JVI.01060-13. [DOI] [PMC free article] [PubMed] [Google Scholar]
- Muller HJ. The Relation of Recombination to Mutational Advance. Mutat Res. 1964;106:2–9. doi: 10.1016/0027-5107(64)90047-8. [DOI] [PubMed] [Google Scholar]
- Novella IS, Duarte EA, Elena SF, Moya A, Domingo E, Holland JJ. Exponential increases of RNA virus fitness during large population transmissions. Proc Natl Acad Sci U S A. 1995;92:5841–5844. doi: 10.1073/pnas.92.13.5841. [DOI] [PMC free article] [PubMed] [Google Scholar]
- Nugent CI, Johnson KL, Sarnow P, Kirkegaard K. Functional coupling between replication and packaging of poliovirus replicon RNA. J Virol. 1999;73:427–435. doi: 10.1128/jvi.73.1.427-435.1999. [DOI] [PMC free article] [PubMed] [Google Scholar]
- Pfeiffer JK, Kirkegaard K. Increased fidelity reduces poliovirus fitness and virulence under selective pressure in mice. PLoS Pathog. 2005;1:e11. doi: 10.1371/journal.ppat.0010011. [DOI] [PMC free article] [PubMed] [Google Scholar]
- Pfeiffer JK, Virgin HW. Viral immunity. Transkingdom control of viral infection and immunity in the mammalian intestine. Science. 2016;351 doi: 10.1126/science.aad5872. [DOI] [PMC free article] [PubMed] [Google Scholar]
- Racaniello VR, Baltimore D. Molecular cloning of poliovirus cDNA and determination of the complete nucleotide sequence of the viral genome. Proc Natl Acad Sci U S A. 1981;78:4887–4891. doi: 10.1073/pnas.78.8.4887. [DOI] [PMC free article] [PubMed] [Google Scholar]
- Robinson CM, Jesudhasan PR, Pfeiffer JK. Bacterial lipopolysaccharide binding enhances virion stability and promotes environmental fitness of an enteric virus. Cell Host Microbe. 2014;15:36–46. doi: 10.1016/j.chom.2013.12.004. [DOI] [PMC free article] [PubMed] [Google Scholar]
- Rudi K, Skulberg OM, Larsen F, Jakobsen KS. Strain characterization and classification of oxyphotobacteria in clone cultures on the basis of 16S rRNA sequences from the variable regions V6, V7, and V8. Applied and environmental microbiology. 1997;63:2593–2599. doi: 10.1128/aem.63.7.2593-2599.1997. [DOI] [PMC free article] [PubMed] [Google Scholar]
- Runckel C, Westesson O, Andino R, DeRisi JL. Identification and manipulation of the molecular determinants influencing poliovirus recombination. PLoS Pathog. 2013;9:e1003164. doi: 10.1371/journal.ppat.1003164. [DOI] [PMC free article] [PubMed] [Google Scholar]
- Sarnow P, Bernstein H, Baltimore D. A poliovirus temperature-sensitive RNA synthesis mutant located in a noncoding region of the genome. Proc Natl Acad Sci USA. 1986;83:571–575. doi: 10.1073/pnas.83.3.571. [DOI] [PMC free article] [PubMed] [Google Scholar]
- Stojiljkovic I, Bäumler AJ, Heffron F. Ethanolamine utilization in Salmonella typhimurium: nucleotide sequence, protein expression, and mutational analysis of the cchA cchB eutE eutJ eutG eutH gene cluster. Journal of Bacteriology. 1995;177:1357–1366. doi: 10.1128/jb.177.5.1357-1366.1995. [DOI] [PMC free article] [PubMed] [Google Scholar]
- Teterina NL, Levenson EA, Ehrenfeld E. Viable polioviruses that encode 2A proteins with fluorescent protein tags. J Virol. 2010;84:1477–1488. doi: 10.1128/JVI.01578-09. [DOI] [PMC free article] [PubMed] [Google Scholar]
- Uchiyama R, Chassaing B, Zhang B, Gewirtz AT. Antibiotic treatment suppresses rotavirus infection and enhances specific humoral immunity. J Infect Dis. 2014;210:171–182. doi: 10.1093/infdis/jiu037. [DOI] [PMC free article] [PubMed] [Google Scholar]
- Vignuzzi M, Stone JK, Arnold JJ, Cameron CE, Andino R. Quasispecies diversity determines pathogenesis through cooperative interactions in a viral population. Nature. 2006;439:344–348. doi: 10.1038/nature04388. [DOI] [PMC free article] [PubMed] [Google Scholar]
- Winter SE, Thiennimitr P, Winter MG, Butler BP, Huseby DL, Crawford RW, Russell JM, Bevins CL, Adams LG, Tsolis RM, et al. Gut inflammation provides a respiratory electron acceptor for Salmonella. Nature. 2010;467:426–429. doi: 10.1038/nature09415. [DOI] [PMC free article] [PubMed] [Google Scholar]
- Xiao Y, Rouzine IM, Bianco S, Acevedo A, Goldstein EF, Farkov M, Brodsky L, Andino R. RNA Recombination Enhances Adaptability and Is Required for Virus Spread and Virulence. Cell Host Microbe. 2016;19:493–503. doi: 10.1016/j.chom.2016.03.009. [DOI] [PMC free article] [PubMed] [Google Scholar]
Associated Data
This section collects any data citations, data availability statements, or supplementary materials included in this article.