

SUMMARY
Diet strongly affects gut microbiota composition and gut bacteria can influence the colonic mucus layer, a physical barrier that separates trillions of gut bacteria from the host. However, the interplay between a Western style diet (WSD), gut microbiota composition and the intestinal mucus layer is less clear. Here we show that mice fed a WSD have an altered colonic microbiota composition that causes increased penetrability and a reduced growth rate of the inner mucus layer. Both barrier defects can be prevented by transplanting microbiota from chow-fed mice. In addition, we found that administration of Bifidobacterium longum was sufficient to restore mucus growth whereas administration of the fiber inulin prevented increased mucus penetrability in WSD-fed mice. We hypothesize that the presence of distinct bacteria is crucial for proper mucus function. If confirmed in humans, these findings may help to better understand diseases with an affected mucus layer, such as ulcerative colitis.
eTOC
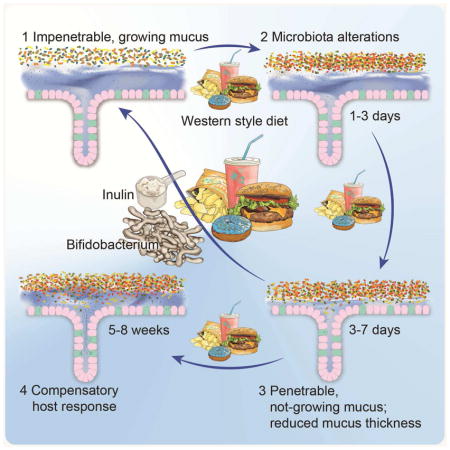
The inner colonic mucus layer separates gut bacteria from their host. Schroeder et al. now find that gut bacteria can mediate functional defects of the mucus layer of mice fed a Western-style diet. The defects can be prevented by application of a probiotic bifidobacteria or the prebiotic fiber inulin.
INTRODUCTION
Colonic mucus is a physical barrier that consists of two layers and protects the host against the tremendous amounts of gut bacteria. In the healthy colon the inner layer is virtually sterile, well defined, and attached to the epithelium. In contrast, bacteria heavily colonize the outer mucus layer and degrade mucus glycans as energy source (Johansson et al., 2008). Consequently, the outer layer is only loosely attached, less defined and formed by mucus, bacteria and intestinal content. Colonic mucus is maintained by an extensively glycosylated mucin-2 (Muc2) network that expands after secretion from intestinal goblet cells and renews the inner mucus layer in 1–2 hours (Ambort et al., 2012; Johansson, 2012), thus preventing microbes from reaching and translocating the intestinal epithelium (Johansson et al., 2008). Accordingly, structural defects or complete absence of the mucus layer can cause severe colitis in mice (Fu et al., 2011; Heazlewood et al., 2008; Johansson et al., 2008). In humans, similar bacterial penetration into the mucus layer was observed in patients with active ulcerative colitis (Johansson et al., 2014) and a correlation between mucus penetrability and dysglycemia has been observed (Chassaing et al., 2017).
Recent evidence has demonstrated that the intestinal microbiota can influence the properties of the colonic mucus layer (Earle et al., 2015; Jakobsson et al., 2015). Certain microbial generalists and specialists possess various carbohydrate utilization gene clusters that allow them to degrade and metabolize specific glycans of the intestinal mucus layer (Kaoutari et al., 2013; Martens et al., 2008). Indeed, bacterial glycan metabolism in mice that were colonized with 14 human gut microbiota species switched from fiber-degradation to mucus glycan degradation when fed a fiber-free diet (Desai et al., 2016). Accordingly, feeding mice a fiber-depleted diet for up to 40 days reduced colonic mucus layer thickness by analyzing fixed tissue sections (Desai et al., 2016; Earle et al., 2015; Everard et al., 2013). Such a deteriorated colonic mucus layer contributed to lethal colitis when the mice were infected with the intestinal pathogen Citrobacter rodentium (Desai et al., 2016). Similarly, human obesity, which is often caused by high intake of a “Western style” diet (WSD) - a diet rich in saturated fats and simple carbohydrates but depleted of dietary fiber - is a risk factor for infection by the enteric pathogen Clostridium difficile in humans (Bishara et al., 2013).
High intake of WSD is not only associated with obesity and metabolic disease but also with an altered and less diverse gut microbiota composition (Cotillard et al., 2013; Filippo et al., 2010; Schnorr et al., 2014; Sonnenburg et al., 2016; Yatsunenko et al., 2012). As the gut microbiota is a crucial environmental factor contributing to host physiology, alterations in their community composition change their metabolic output, which can affect nearby and distant organs in the host (Koh et al., 2016; Schroeder and Bäckhed, 2016). Moreover, metabolic disease can be initiated by microbial products, or potentially even intact bacteria, translocating from the intestine into the systemic circulation (Burcelin et al., 2013; Caesar et al., 2012; Cani et al., 2007; Everard et al., 2013; Teixeira et al., 2012).
Although these observations indicate a defective mucosal barrier in obesity, it is at present unknown how WSD and obesity affect the intestinal mucus layer in living tissue. Thus, we here investigated the properties and function of the inner colonic mucus layer in mouse models of diet-induced and genetic obesity.
RESULTS
Western style diet affects growth rate and penetrability of the colonic mucus layer
To explore how WSD affected the inner colonic mucus layer we fed mice a WSD for 8 weeks and compared them to chow-fed littermates. As expected, consumption of WSD resulted in significantly higher body weight, fasting blood glucose, insulin levels and homeostatic model assessment insulin resistance index (HOMA-IR) (Figure 1A), indicating a pre-diabetic state.
Figure 1.

Western style diet feeding impairs the inner colonic mucus layer in mice. Mice (4 – 5 mice/group) were fed a Western style diet (WSD) or chow diet for 8 weeks and metabolic parameters such as body weight, fasting blood glucose and insulin concentration were measured and HOMA-IR was calculated (A). Thickness of the inner colonic mucus layer was measured ex vivo with a micromanipulator by measuring the distance between black 10 μm beads and the epithelial surface (B) or with a confocal microscope by measuring the distance of fluorescent 1 μm (bacteria sized) beads and the stained epithelium (C). (D) Confocal z-stacks, (left), calculated from the position of fluorescent 1 μm beads (center), were used to determine penetrability of the inner colonic mucus layer (right). The median z-stack is shown for each mouse. Fluorescent beads, inner mucus layer and colonic epithelium are indicated in the figure. Turquoise: colonic tissue; red: bacteria-sized beads. (E) Growth rate of the inner colonic mucus layer. (F) Carnoy fixed colonic tissue sections were stained with Alcian Blue/periodic acid-Schiff or with polyclonal antibodies against glycosylated (mature) Muc2 (Muc2-C3, green)(G). Please note that the outer mucus layer is less defined and often not observed in fixed tissue sections. (H) Goblet cell number per colonic crypts. (I) Carnoy fixed colonic tissue sections were incubated with polyclonal antibodies against non-O-glycosylated (immature) Muc2 (Muc2-PH497, green) and glycosylated (mature) Muc2 (Muc2-C3, green) (J). Arrows in (J) indicate mucus secretion inside the crypts. Data in A, D, E H are presented as mean ± SEM. Statistical significance was determined by Mann-Whitney U test with (*) = p<0.05 and (**) = p<0.01. Size bar = 25 μm, representative images are shown. See also Figure S1.
By using the ex vivo explant method (Gustafsson et al., 2012), in which intestinal content and the loosely attached outer mucus layer have been gently removed by flushing, we did not observe altered thickness of the inner mucus layer, either by measuring of the distance between the epithelium and 10 μm beads trapped on the mucus surface with a micromanipulator (Figure 1B) or by analyzing the distance between fluorescent 1 μm (bacteria-sized) beads and the stained epithelium with a confocal microscope (Figure 1C). However, we observed that penetrability of bacteria-sized beads into the mucus layer was greater in mice fed a WSD compared with chow fed mice (Figure 1D, p = 0.008). Moreover, by taking thickness measurements over time we observed a significantly slower mucus growth rate (p = 0.016) in WSD fed mice as compared to chow-fed mice (Figure 1E).
To unravel whether the observed defective mucus layer is a consequence of dietary or host metabolic factors we next studied mucus properties in leptin deficient, genetically obese mice (Ob/Ob mice) that were fed a chow diet (Figure S1A). Blood glucose concentration in Ob/Ob mice is controlled by strongly augmented secretion of insulin, leading to a higher HOMA-IR. Mucus thickness was similar between Ob/Ob and lean mice (Figure S1B,C), but in contrast to the diet-induced obesity model no significant difference in penetrability (Figure S1D) or mucus growth rate (Figure S1E) was detected. Thus, our data suggest that WSD affects penetrability and growth rate of the inner colonic mucus and that the defects might be a consequence of dietary composition rather than of obesity and impaired glucose metabolism. However, since two out of six Ob/Ob mice displayed a highly penetrable inner mucus layer (Figure S1D) a diet-independent contribution to the phenotype cannot be excluded.
Western style diet results in increased mucus production
To evaluate whether the mucus phenotype can be explained by altered structural organization of the mucosal barrier we stained Carnoy-fixed colonic tissue sections by Alcian blue/periodic acid–Schiff (AB/PAS). A well-defined inner mucus layer and distinct dark-blue staining of mucus-producing goblet cells were observed in chow-fed mice (Figure 1F). In agreement with increased penetrability, the inner mucus layer appeared less organized upon WSD-feeding. While some qualitative differences in the outer mucus layer were occasionally observed between chow-fed and WSD fed mice, these are prone to artifacts from the diet composition and fixation procedure. We therefore limit our analysis to the inner mucus layer, which is well preserved and thus more reliable. Upon WSD feeding the crypt goblet cells appeared more filled and intensely stained, an observation that was confirmed by staining for the Muc2 mucin (Figure 1G), and a trend towards increased number of goblet cells per crypt (Figure 1H). Increased penetrability of the mucus allows more bacteria to access the epithelium, which provokes several host responses, including faster turnover and production of the Muc2 mucin (Birchenough et al., 2016; Johansson et al., 2014). Indeed, we observed more intense staining for immature, non-O-glycosylated Muc2 at the bottom of the crypts in WSD-fed mice (Figure 1I). Secretion of the mature Muc2 is normally restricted to the crypt openings and epithelial surface; however, in WSD-fed mice Muc2 secretion was also observed along the entire length of the crypt (Figure 1J). We therefore conclude that impairment of the mucus barrier may provoke a compensatory host response.
Western style diet does not alter overall mucus protein composition but affects distinct proteins and amount of Muc2
Evaluation of the mass spectrometry based analysis of the mucus proteome revealed that WSD feeding did not cause any major global alteration in the mucus protein composition, as mucus samples were not separated based on diet in cluster analysis or principal component analysis (Figure 2A). Correspondingly, 81% of the proteins were detected in both dietary groups while 11% were unique to the chow group and 8% to the WSD group, respectively. Furthermore, according to mass-spectrometry based label-free quantification (LFQ) no significant differences in relative protein abundance of the four major mucus proteins Muc2, Zg16, Fcgbp and Clca1 were found between the two diet groups (Figure 2B). However, one protein, Dmbt1, demonstrated a large response to WSD (Figure S2). This protein can agglutinate bacteria and is thus involved in mucosal innate immunity (Madsen et al., 2010). The increased abundance of Dmbt1 in the mucus as well as increased expression of Dmbt1 in the colon of WSD-fed mice (Figure 2C) is possibly another element of the compensatory host response to the mucus barrier defects and the subsequent contact of bacteria with the epithelium.
Figure 2.

Western style diet feeding has a minor effect on the mucus proteome composition but provokes a host response. (A) Hierarchical clustering, principal component analysis and Venn diagram of the mucus proteome from WSD and chow fed mice (n = 5 mice/group). Proteins that were detected in at least 3 samples per group are depicted in the Venn diagram. (B) Label-free quantification (LFQ) by mass spectrometry of the major mucus proteins Muc2, Zg16, Fcgbp and Clca1 in colonic mucus. (C) LFQ of Dmbt1 protein in colonic mucus and its transcript quantification in colonic tissue. (D) Absolute Muc2 protein quantification per sample and normalized to volume (E) by mass spectrometry of Muc2 in the formed colonic mucus by using isotope-labeled Muc2 peptides (n = 8–10 mice/group). Data are presented as mean ± SEM and statistical significance was determined by Mann-Whitney U test with (*) = p<0.05 and (**) = p<0.01. C: Dmtb1 was below detection limit in four samples; those values were set to “0”. See also Figure S2 and Table S2.
Absolute Muc2 quantification by using labeled standard peptides after ex vivo incubation revealed a significantly lower amount of Muc2 in mucus samples of WSD-fed mice when compared to chow-fed mice (Figure 2D). Even though the difference in Muc2 concentration did not reach statistical significance (p = 0.059, Figure 2E), we hypothesize that the lower amount of Muc2 could result in a less dense mucus layer that might contribute to the higher penetrability observed in WSD fed mice.
Luminal and mucosal distal colonic microbiota are altered in mice fed a Western style diet
Diet is a major factor modulating gut microbiota composition (Cotillard et al., 2013; David et al., 2014), and we therefore investigated the gut microbiota composition by 16S rDNA analysis. Similar to previous studies (Hildebrandt et al., 2009; Turnbaugh et al., 2008, 2009), we observed increased abundance of taxa belonging to Firmicutes and reduced abundance of Bacteroidetes and Actinobacteria in the colonic lumen of mice fed a WSD (Figure 3A and Table S1). On %, p < 0.001, p(adj) < 0.05) and a reduction in Bifidobacterium genus (3.3% vs. 11.6%, p < 0.001, p(adj) < 0.05) in the WSD-fed mice. Moreover, feeding a WSD caused a significant reduction in α-diversity (Figure 3B, phylogenetic diversity whole tree, p = 0.002) and a significant separation of the microbial community (Figure 3C, weighted Unifrac, p = 0.007) from mice fed a chow diet.
Figure 3.

Microbiota composition in the colonic lumen and at the mucosa is altered in WSD-fed mice. Relative abundance of microbial taxa was determined by 16S rDNA analysis in the lumen (A-C) and at the mucosa (D-F) of the distal colon in WSD and chow-fed mice (n = 5 mice/group). (A) Relative abundance of luminal taxa was determined on phylum and genus level, for which abundances >1% are shown. (B) Alpha diversity and beta-diversity (weighted Unifrac, C) for the luminal microbial community. (D) Relative abundance of mucosa-associated taxa was determined on phylum and genus level, for which abundances >1% are shown. (E) Alpha diversity and beta-diversity (weighted Unifrac, F) for the mucosa-associated microbial community. Statistical significance for diversity analyses was calculated as described in the methods sections. (G) Caecal fermentation products of mice fed WSD or chow diet determined by GC-MS. Data are presented as mean ± SEM and statistical significance was determined by Mann-Whitney U test with (*) = p<0.05 and (**) = p<0.01. See also Table S1.
Analysis of colonic mucosa-associated bacterial composition revealed lower abundance of Bacteroidetes upon WSD feeding and higher abundance of Proteobacteria (Figure 3D and Table S1), which was due to a bloom of the genus Helicobacter (43.7% vs. 0.0%, p < 0.001, p(adj) = 0.06). Furthermore, relative abundance of the S24-7 family (3.9% vs. 29.6%, p < 0.001, p(adj) = 0.06) and the Bifidobacterium genus (0.7% vs. 2.9%, p < 0.001, p(adj) = 0.06) was lower upon WSD feeding. In accordance with the luminal microbiota we found significantly lower α-diversity (Figure 3E, phylogenetic diversity whole tree, p = 0.006) and a clear separation of the microbial communities at the mucosa (Figure 3F, weighted Unifrac, p = 0.003).
The loss of potential fiber-degrading bacteria such as the S24-7 family and Bifidobacterium (Kaoutari et al., 2013; Ormerod et al., 2016) is likely attributable to the lack of dietary fiber in the WSD. Dietary fiber is mainly fermented into short-chain fatty acids (SCFAs) by the gut microbiota. Consequently, SCFAs and other fermentation products were quantified in order to verify that microbial fiber metabolism was disrupted by WSD feeding. As expected, we observed significantly lower concentrations of the SCFAs acetate, propionate and butyrate as well as the organic acids lactate and succinate in mice fed WSD (Figure 3G). In contrast, fermentation of branched chain amino acids was not altered, as indicated by similar levels of isobutyrate and isovalerate.
Shifts in microbial community parallel mucus penetrability and growth defect
To investigate whether mucus growth defect and increased penetrability are linked to the alterations in the microbial community we fed mice a WSD for up to 28 days (n = 3 mice per group and time point). We observed a rapid increase in body weight that plateaued after 7 days (Figure 4A) and a significant decrease in mucus thickness over the time course of the experiment (Figure 4B, p = 0.002), which has been observed previously when feeding mice a fiber-free diet for 10 – 40 days (Desai et al., 2016; Earle et al., 2015; Everard et al., 2013). Regarding mucus properties and function, a significant reduction in mucus growth rate (Figure 4C, p = 0.015) and a significant increase in mucus penetrability (p = 0.034) were observed over the 28 days period, with both defects appearing between 3–7 days after initiation of WSD feeding (Figures 4D).
Figure 4.

Mucus penetrability and growth defect co-occur and are accompanied with distinct alterations in microbiota composition. After 0–28 days of WSD feeding body weight (A), colonic mucus thickness (B) and colonic mucus growth rate (C) were determined from 3 mice per time point. (D) Confocal z-stacks were calculated from the position of fluorescent 1 μm beads as shown and used to determine the normalized penetrability of the inner colonic mucus layer (right). The median z-stack is shown for each mouse. Turquoise: colonic tissue; red: bacteria-sized beads. Data in A-D are presented as mean ± SEM and statistical significance was determined by linear regression over time. (E) Relative abundance of luminal colonic bacteria was determined on phylum and genus level, for which abundances >1% are shown. Uncl. = unclassified. (F) Alpha diversity and beta-diversity (weighted Unifrac, G) for the colonic microbial communities. Statistical significance for diversity analyses was calculated as described in the methods sections. (H) Carnoy fixed colonic tissue sections were stained with Alcian Blue/periodic acid-Schiff. Size bar = 25 μm, representative images are shown. See also Table S1.
16S rDNA analyses from colonic luminal content (Figure 4E and Table S1) revealed a gradual decrease of Actinobacteria (Bifidobacterium), Bacteroidetes (family S24-7), Proteobateria (Sutterella) and Verrucomicrobia (Akkermansia) between day 0 and day 28, while Firmicutes (order Clostridiales, Lactobacillus, Oscillospira) increased in relative abundance. Due to blending of the fiber- and carbohydrate/fat-rich diets during the first day α-diversity initially increased, but then decreased with prolonged WSD feeding (Figure 4F). Moreover, principal component analysis revealed significant clustering according to feeding duration (weighted Unifrac, p = 0.001, Figure 4G). Accordingly, reduction in mucus growth rate and increased penetrability co-occur between 3–7 days of WSD feeding, a time point when alterations in microbial composition have already started.
Examination of the mucosa over the course of the experiment (Figure 4H) revealed that the distinct goblet cell phenotype that was observed after prolonged WSD-feeding (Figure 1F) was not fully developed after 28 days. This indicates that the goblet cell phenotype is not causative for growth defect and penetrability of the mucus layer but rather might be a consequence.
Microbiota transplantation prevents the defect in mucus properties
To elucidate whether the gut microbiota is causal for the reduced mucus growth and increased penetrability we performed a microbiota transplantation experiment (Figure 5A). After initial antibiotic treatment mice received a weekly microbial transplant from either WSD-fed mice (WSD->WSD) or from chow-fed mice (WSD->Chow) while feeding on a WSD. Over the course of the experiment no difference in body weight was observed between the groups (Figure S3A). Likewise, when the experiment was terminated after six weeks we did not observe differences in metabolic parameters such as body weight, body fat, fasting blood glucose, fasting insulin concentration, or HOMA-IR (Figure 5B and Figure S3B), nor the length of the colon (Figure S3C). However, penetrability of the mucus layer was significantly lower in WSD->Chow mice in comparison to WSD->WSD mice (Figure 5C, p = 0.009). Similarly, growth of the inner colonic mucus layer was fully restored in WSD->Chow mice (Figure 5D, p = 0.004) while total mucus thickness was not significantly altered between the two groups (Figure S3D). Of note, concentrations of caecal fermentation products were also similar in both mouse groups (Figure 5E), suggesting that the observed mucus defect may be independent of these microbial metabolites.
Figure 5.

Microbiota transplant from chow-fed mice prevents deterioration of the colonic mucus layer upon WSD feeding. (A) 10 week old mice (n= 7–8 mice/group) were treated with an antibiotic cocktail (ABX: ampicillin 1 g/l, metronidazole 1 g/l, vancomycin 0.5 g/l, neomycin 0.5 g/l) for 3 days and subsequently switched to a WSD. Mice received a weekly microbiota transplant either from WSD-fed donor mice (WSD->WSD) or from chow-fed donor mice (WSD->Chow). After six weeks metabolic parameter were determined (B). (C) Confocal z-stacks (left) calculated from the position of fluorescent 1 μm beads (center) were used to determine penetrability of the inner colonic mucus layer (right). The median z-stack is shown for each mouse. Turquoise: colonic tissue; red: bacteria-sized beads. (D) Growth rate of the inner colonic mucus layer. (E) Caecal fermentation products of WSD->WSD and WSD->Chow mice. Data in B-E are presented as mean ± SEM. Statistical significance was determined by unpaired t-test for normally distributed data and Mann-Whitney U test for not-normally distributed data with (*) = p<0.05 and (**) = p<0.01. (F) Relative abundance of microbial taxa was determined by 16S rDNA analysis of colonic bacteria on phylum and genus level, for which abundances >1% are shown. (G) Alpha diversity and beta-diversity (weighted Unifrac, H) for the colonic microbial community. Statistical significance for diversity analyses was calculated as described in the methods sections. See also Figure S3 and Table S1.
By 16S rDNA analysis in the colonic lumen we identified lower abundance of Firmicutes and higher abundance of Bacteroidetes in WSD->Chow mice (Figure 5F and Table S1). Moreover, relative abundance of Bifidobacteria increased from 0.2 to 3.7% (p < 0.001, p(adj) < 0.05) and S24-7 family from 6.3% to 16.2% (p < 0.05, p(adj) = 1.0) while abundance of Allobaculum decreased from 36.4% to 16.3% (p < 0.01, p(adj) = 0.19) upon receiving the WSD->Chow microbiota transplant. These alterations were accompanied by a significant re-gain in α-diversity (Figure 5G, phylogenetic diversity whole tree, p = 0.018) and a significant separation from mice receiving the WSD->WSD transplant (Figure 5H, weighted Unifrac, p = 0.028). Notably, the growth rate of the inner mucus layer correlated with relative abundance of Bifidobacterium while mucus penetrability displayed a threshold-like dependency (Figure S3E).
Bifidobacterium longum or inulin supplement prevent mucus defects
Since the abundance of Bifidobacterium correlated with mucus growth rate (Figure S3E) and was dramatically reduced between 3 and 7 days of WSD feeding (Figure 4E) we tested whether Bifidobacterium was causally involved in colonic mucus properties. We thus fed mice a WSD for 4 weeks and supplemented their drinking water with either prebiotic oligofructose-enriched inulin that is known to enrich bifidobacteria (Gibson et al., 1995; Rossi et al., 2005; Vandeputte et al., 2017), the probiotic strain Bifidobacterium longum NCC 2705 (B. longum), or with a synbiotic combination of both (Figure 6A). As higher concentrations of inulin have been described to improve metabolic dysfunction (Dewulf et al., 2011; Kumar et al., 2016) but our microbiota transplant experiment did not reveal any metabolic improvements (Figure 5B and Figure S2A,B), we provided inulin only at a low concentration (1%). Accordingly, neither the probiotic, prebiotic nor synbiotic supplementation to the WSD led to improved metabolic parameters in WSD-fed mice (Figure 6B). In contrast, supplementation with inulin was sufficient to prevent penetrability of the inner colonic mucus layer (Figure 6C,D, p = 0.007). However, this protective effect was not observed in mice receiving either B. longum or the synbiotic combination. Conversely, the mucus growth defect was prevented by B. longum in the absence (p = 0.006) or presence (p = 0.005) of inulin but not by the prebiotic fiber inulin alone (Figure 6E). In agreement with our previous results, no alterations in mucus thickness were observed by any of the treatments (Figure 6F). Accordingly, probiotic and prebiotic treatments can prevent individual but distinct aspects of the WSD-induced mucus defects. Significantly, these data thus indicate that the WSD-induced increase in mucus penetrability and decrease in mucus growth rate are not directly linked.
Figure 6.

Probiotic and prebiotic supplement prevent distinct aspects of diet-mediated mucus defects. (A) After mucus properties were analyzed in a control subset of mice (C, n = 4) the remaining animals were divided into 4 groups (n = 7 per group) and switched to a Western style diet (WSD) at the age of 9 – 11 weeks. Drinking water was supplemented with vehicle control (WSD), 1% (w/v) oligofructose-enriched inulin (I) Bifidobacterium longum NCC2705 (B) or a combination of both (B+I). (B) Metabolic parameters were analyzed 3 weeks after the dietary switch and mucus measurements performed after 4 weeks on supplemented WSD. (C) Confocal z-stacks (top) calculated from the position of fluorescent 1 μm beads (bottom) were used to determine penetrability of the inner colonic mucus layer (D). The median z-stack is shown for each mouse. Turquoise: colonic tissue; red: bacteria-sized beads. (E) Growth rate and thickness (F) of the inner colonic mucus layer. Data are presented as mean ± SEM. Statistical significance against WSD fed mice (vehicle control) was determined by Kruskal-Wallis test and corrected by Dunn’s multiple comparisons test with (*) = p<0.05 and (**) = p<0.01.
DISCUSSION
Here we have shown that WSD-mediated alterations of the gut microbiota composition cause defects of the inner colonic mucus layer, which includes a strongly reduced growth rate and higher penetrability. We observed that a loss of Bifidobacterium taxa paralleled the onset of the mucus defects and that mucus growth positively correlated with Bifidobacterium abundance. Consistently, supplementation of WSD with a Bifidobacterium longum strain prevented the growth defect but not the increase in penetrability, which was instead prevented by the addition of inulin. Despite the co-occurrence of both phenotypes in our experiment involving full microbial communities we deciphered that mucus penetrability and growth rate are separate events.
Diet rapidly affects gut microbiota composition and mice fed a fiber-deficient diet over several generations exhibit a progressive loss in distinct taxa and microbial diversity (Cotillard et al., 2013; David et al., 2014; Sonnenburg et al., 2016). However, microbial changes caused by a lack of fiber occur rapidly (Turnbaugh et al., 2009) and we accordingly observed significantly decreased diversity and reduced abundance of Bacteroidetes and Actinobacteria when we switched mice to low-fiber WSD. Importantly, the gut microbiome encodes a large variety of carbohydrate-active enzymes (Kaoutari et al., 2013) and in the absence of dietary fiber distinct microbial taxa can switch to host glycans of the intestinal mucus layer (Desai et al., 2016; Earle et al., 2015; Martens et al., 2008). We found that microbiota alterations and loss of diversity paralleled or even preceded the increase in mucus penetrability after changing from chow diet to WSD. While further studies are required to formally demonstrate microbial mucus degradation in a complex WSD-fed gut microbial community, it is likely that the increased penetrability is a consequence of the dietary shift of the microbial ecology and the subsequent altered microbial metabolism.
Previous studies (Desai et al., 2016; Earle et al., 2015; Everard et al., 2013) that evaluated mucus thickness in fixed tissue sections described thinner colonic mucus in mice that were fed low-fiber diets for short periods of time (10 – 40 days). Despite different methods we also observed thinner mucus after 28 days of WSD feeding in our time course experiment. However, when feeding WSD for 8 weeks no difference in mucus thickness was observed when compared to chow-fed mice. It is thus possible that long-term WSD feeding leads to adaptational host processes that correct the initially reduced mucus thickness by a yet unknown mechanism.
Evaluation of mucus properties is challenging due to its composition and the factors that influence the mucus layer. This does not only include environmental factors as pH, water content and ion composition but also amount and frequency of stool passages, food consistency and motility of the gut. Moreover, tissue fixation by all fixatives causes significant mucus shrinkage due to its high water content, which may affect thickness measurements in fixed tissue sections (Desai et al., 2016; Earle et al., 2015; Everard et al., 2013). In contrast, ex vivo analyses as described herein provide important clues to mucus kinetics and quality, although some environmental cues may be different compared with the in vivo situation.
As a WSD-associated microbiota seemed responsible for our observed mucus defects, we reasoned that a fiber-associated community might be protective. Indeed, we found that microbiota transfer from chow fed mice could correct the WSD-induced impairment of mucus physiology, yet without affecting host metabolic parameters. To examine which microbial taxa may confer the protective mucus effects we mined our microbiota data and observed that one of the most affected genera upon WSD was Bifidobacterium. Thus, we investigated whether bifidobacteria has a protective effect by treating mice with Bifidobacterium longum and/or the fiber inulin. We observed that while B. longum administration corrected mucus growth, only inulin corrected mucus penetrability, suggesting that other inulin-responsive bacteria might be involved in this effect. Surprisingly, the synbiotic combination of B. longum and inulin did not significantly prevent penetrability of the inner mucus layer, even though inulin alone had a protective effect. We hypothesize that the supplemented B. longum community metabolizes parts of the provided inulin in the mouse gut, thus reducing the effective inulin concentration required to prevent mucus penetrability.
Bifidobacterium strains have long been used as probiotics (Picard et al., 2005) and have several beneficial effects, including preventing translocation of enteropathogenic E. coli O157 in mice (Fukuda et al., 2011) and strengthening epithelial barrier function in human ulcerative colitis patients (Duranti et al., 2016). Moreover, some Bifidobacterium strains can bind to mucus proteins in vitro (He et al., 2001). It is thus possible that Bifidobacterium species exert part of their probiotic action by stimulating colonic mucus growth. Importantly, prebiotic treatment with fiber does not only alter the abundance of Bifidobacterium, but more than 100 other bacterial taxa (Everard et al., 2011). Thus, the inulin-mediated effects may also be Bifidobacterium independent.
A recent study has found that a fiber-deprived synthetic microbiota comprised of 14 human gut bacterial species started to degrade host mucin glycans upon removal of fiber from the host diet, resulting in a thinner mucus layer (Desai et al., 2016). Supplementation of the fiber-free diet with purified soluble glycans - resembling prebiotic formulations - did not prevent the mucus alterations. A possible explanation is that the synthetic community, which is an excellent tool to study metabolic alterations of distinct sequenced community members (Desai et al., 2016; Martens et al., 2008; Sonnenburg et al., 2005), lacks important fiber-dependent bacteria that are beneficial for mucus function. Moreover, a synthetic community of human-adapted bacterial strains in mouse models may be insufficient to provoke an adequate immune response in the mouse gut (Chung et al., 2012). By using a natural and more complex mouse bacterial community we found that the defective mucus barrier causes a host defense response after long-term WSD feeding. This included increased cellular mucus production, mucus secretion into the crypts and higher levels of Dmbt1. Such a compensatory response was absent in the synthetic community using a fiber-free diet (Desai et al., 2016), likely due to the reasons described above. However, since our diet included high amounts of fat and sucrose, a potential effect of these dietary compounds on the host tissue cannot be fully excluded.
In conclusion, we found that diet-mediated alteration of the gut microbiota led to rapid deterioration of the inner colonic mucus layer. As supplementation with probiotic bifidobacteria or prebiotic fiber prevented mucus defects, we hypothesize that the presence of distinct bacteria is crucial for proper mucus function. Modern diets such as WSD increase the risk for developing inflammatory bowel diseases in humans (Gentschew and Ferguson, 2012) and providing the existence of a similar diet-microbiota-mucus axis, it may be possible to design improved probiotic and prebiotic options for treating conditions that involve defects in the colonic mucus layer.
STAR METHODS
CONTACT FOR REAGENT AND RESOURCE SHARING
Further information and requests for resources and reagents should be directed to and will be fulfilled by the Lead Contact, Fredrik Bäckhed (Fredrik.Backhed@wlab.gu.se).
EXPERIMENTAL MODEL AND SUBJECT DETAILS
Mice
Male wild-type C57BL/6J mice were co-housed with 5 mice/cage under specific pathogen free (SPF) conditions at a 12 hour light/dark cycle, had unlimited access to water and food and were either bred in-house or, when obtained from Charles River, Germany, acclimatised to the facility for three weeks in cages with bedding that has previously been exposed to facility-resident mice. Leptin deficient Ob/Ob−/− mice on a C57Bl/6J background were originally obtained as heterozygous pairs from Charles River, Italy, bred in-house and co-housed with their lean littermates. 6 obese male and female Ob/Ob mice are compared against 6 lean (1 heterozygous Ob/Wt and 5 Wt/Wt) mice. For details see Table 1. All mice used were age matched (15–17 weeks old; 13–15 weeks for Bifidobacterium longum/inulin treatment) and fed a standard chow diet (5021 LabDiet: 4.62 kcal/g; 23.7% kcal from fat (31% saturated, 33% mono-unsaturated, 36% polyunsaturated fatty acid), 53.2% from carbohydrates (sucrose 0.71% (w/v), starch 31.0% (w/v) glucose 0.21% (w/v), neutral detergent fiber 15.2% (w/v)) or a Western style diet (TD.96132 Envigo: 4.5 kcal/g; 40.6% kcal from fat (41% saturated, 52% mono-unsaturated, 7% polyunsaturated fatty acids), 40.7% from carbohydrates (sucrose 18.2% (w/v), corn starch 16.0% (w/v), maltodextrin 12.0% (w/v), cellulose 4.0% (w/v)). Animals were anesthetized using isofluorane and killed by cervical dislocation prior to sample collection. Sampling time during the day was matched between dietary/genetic groups and all experiments were performed using protocols approved by the University of Gothenburg Animal Studies Committee.
Table 1.
Source, housing conditions and experimental setup of mice
| Figure | Breeding | Facility acclimatisation | Littermates | Male | Female | Western diet | |
|---|---|---|---|---|---|---|---|
| Mucus measurements WSD | 1, 2, 3 | in-house | X | X | 8 weeks | ||
| Mucus measurements Ob/Ob | S1 | in-house | X | X | X | -- | |
| Microbiota analyses WSD | 3 | Charles River | X | X | 8 weeks | ||
| Mucus phenotype time course | 2, 4 | Charles River | X | X | 1–28 days | ||
| Mucus phenotype prevention | 2, 5, S2 | Charles River | X | X | 6 weeks | ||
| Bifidobacterium/inulin treatment | 6 | Charles River | X | X | 4 weeks |
Microbial strains
Bifidobacterium (B.) longum NCC2705 was kindly provided by Nestec Ltd., Nestlé Research Center (Lausanne, Switzerland). Culture was maintained on Reinforced Clostridial Medium (RCM, BD Difco, CA) agar plates in a Coy Anaerobic Chamber (Coy, MI) with a gas mix containing 5% hydrogen, 10% carbon dioxide and 85% nitrogen. Purity of the culture was monitored by Gram-staining and plating of serial dilutions.
B. longum culture was inoculated into fresh liquid RCM and incubated anaerobically for 24 hours, mixed with autoclaved glycerol (20% final) and stored at −80°C ( about 2 × 10⁸ colony forming units/ml) until further usage.
METHOD DETAILS
Metabolic measurements
Mice were fasted for 4 hours and glucose concentration was measured in tail vein whole blood with commercial blood glucose strips (Contour Next, Bayer, Germany). Insulin concentration was determined in serum by Ultra Sensitive Mouse Insulin ELISA kit (Crystal Chem Inc., IL). Body fat was determined by whole-body magnetic resonance imaging (EchoMRI, Echo Medical Systems, TX).
Explant ex vivo mucus thickness measurements
Thickness of the inner mucus layer was measured on alive tissue as described (Birchenough et al., 2016; Gustafsson et al., 2012). Briefly, intestinal tissue was flushed with cold Krebs buffer to remove luminal content and unattached mucus (“outer layer”). The muscle layer was removed by microdissection and the distal colon was mounted in a horizontal chamber system and maintained at 37°C with basolateral Krebs-glucose buffer perfusion and apical Krebs-mannitol buffer. For visualization of the mucus surface black 10 μm polystyrene Polybead microspheres (Polysciences, Germany) were added apically. The surface was observed by a stereomicroscope and mucus thickness measured using a glass micropipette connected to a micrometer. Mucus thickness was measured every 15 min at five different locations for up to 45 minutes.
Confocal analysis of mucus layer properties
Colonic inner mucus layer barrier function was assessed by quantifying penetrability to 1 μm bacteria sized microbeads by use of confocal microscopy. Flushed distal colonic tissue was prepared and mounted in a horizontal perfusion chamber as previously described (Gustafsson et al., 2012). The tissue was stained by adding Calcein violet AM (Thermo Fisher Scientific, MA; 1 μg/ml) to the basolateral Krebs-glucose buffer and the apical mucosal surface was overlaid with 1 μm diameter Fluosphere crimson microbeads (Thermo-Fisher, 1:10) diluted in 10 μl Krebs-mannitol buffer. Microbeads were allowed to sediment onto the mucus surface for 5 min and the mucosal surface was gently washed with 0.5 ml Krebs-mannitol to remove excess microbeads. The apical perfusion chamber compartment was then filled with 2 ml Krebs mannitol and the perfusion chamber was transferred to an LSM700 confocal imaging system (Carl Zeiss, Germany). Tissue and microbeads were visualized by acquiring confocal z-stacks using a ×20 water immersion objective lens, 405/639 nm lasers and Zen acquisition software (Carl Zeiss). Zen files were imported into Imaris software (Bitplane) and isosurfaces were mapped to Calcein violet (tissue) and Fluosphere (microbeads) fluorescent signals. Data describing the z-axis position of the tissue and individual microbeads was extracted and the mucus layer thickness was quantified by calculating the average tissue-microbead z-axis distance. Mucus penetrability was quantified by analysis of microbead distribution within the mucus layer. Initially, a frequency distribution curve of tissue-microbead z-axis distance data was generated for each z-stack using Prism 6 software (Graphpad). To allow comparison of distribution curves acquired from different z-stacks, curves were first normalized to maximum frequency values in order to correct for differences in the absolute number of microbeads detected in each z-stack. Subsequently curves were normalized to the position of the mucus surface (the z-axis position with the maximum microbead frequency) in order to correct for variable mucus layer thickness, and were cropped to exclude data from microbeads above the mucus surface. Area under the curve (AUC) data was generated for each normalized distribution curve and expressed as ‘normalised penetrability’ in order to allow quantitative comparison of microbead penetration into the mucus layers of different samples.
Mucus proteome analyses
After ex vivo mucus measurements mucus was collected, 2X cOmplete Protease Inhibitor Cocktail (Merck) was added and samples were stored at −80ºC until further processing. For proteome analyses isolated mucus samples were incubated overnight at 37°C in reduction buffer (6M guanidini um hydrochloride (GuHCl), 0.1M Tris/HCl, pH 8.5 (Merck), 5mM EDTA, 0.1 MDTT (Merck)) and all liquid added on top of a spin-filter (10 kDa, PALL, Port Washington, NY) for a filter-aided sample preparation following a previous protocol (Wiśniewski et al., 2009) where 6M GuHCl was used instead of urea. Proteins were alkylated on 10 kDa cut-off filters and subsequently digested for 4h with LysC (Wako, Richmond, VA) followed by an overnight trypsin (Promega, Fitchburg, WI) digestion. Heavy peptides (SpikeTides TQL, JPT Peptide Technologies, Berlin, Germany) for Muc2 absolute quantification (10 peptides, 100 fmol each; Supplemental Table S2) were added before trypsin digestion.
Peptides released from the filter after centrifugation were cleaned with StageTip C18 columns (Rappsilber et al., 2007). NanoLC–MS/MS was performed on an EASY-nLC 1000 system (Thermo Fisher Scientific, Odense, Denmark), connected to a QExactive Hybrid Quadrupole-Orbitrap Mass Spectrometer (Thermo Fisher Scientific) through a nanoelectrospray ion source. Peptides were separated with an in-house packed reverse-phase column (150 × 0.075 mm inner diameter, C18-AQ 3 μm) by a 60-min gradient from 5 to 40% of buffer B (A: 0.1% formic acid, B: 0.1% formic acid/80% acetonitrile) using a flow rate of 200 nl/min. Full mass spectra were acquired from 320–1,600 m/z with resolution of 70,000 (m/z 200). Up to twelve most intense peaks (charge state ≥ 2) were fragmented and tandem mass spectrum was acquired with a resolution of 35,000 and automatic dynamic exclusion. For absolute quantification a separate targeted mass spectrometry method was used where only precursors and their fragments of the heavy and corresponding light peptides were scanned with a resolution of 35,000.
Proteins were identified with the MaxQuant program (version 1.5.7.4 (Cox and Mann, 2008)) by searching against the mouse UniProt protein database (downloaded 23.07.2015) supplemented with an in-house database containing all the mouse mucin sequences (http://www.medkem.gu.se/mucinbiology/databases/). Searches were performed with full tryptic specificity, maximum 2 missed cleavages, precursor tolerance of 20 ppm in the first search used for recalibration, followed by 7 ppm for the main search and 0.5 Da for fragment ions. Carbamidomethylation of cysteine was set as a fixed modification and methionine oxidation and protein N-terminal acetylation were set as variable modification. The required false discovery rate (FDR) was set to 1% both for peptide and protein levels and the minimum required peptide length was set to six amino acids. Proteins were quantified based on MaxQuant label-free quantification (LFQ) option using a minimum of two peptides for quantification. Data filtering, clustering and principal clustering analysis (PCA) was performed with Perseus software (version 1.4.1.3). The data was filtered based on the presence of a protein group in at least three out of five biological replicated. Missing values were replaced from normal distribution using default values (Tyanova et al., 2016). Clustering and heatmap were performed using Euclidean distance, average linkage, preprocessing with k-means for rows and columns. For principal component analysis default parameters were used (Tyanova et al., 2016). The mass spectrometry proteomics data were deposited to the Proteome Xchange Consortium (http://proteomecentral.proteomexchange.org) via the PRIDE partner repository (Vizcaíno et al., 2016) with the dataset identifier PXD006129.
RNA extraction from colonic tissue
Intestinal mouse tissue was homogenized by using a TissueLyser II (Qiagen, Germany) and RNA was extracted with RNeasy Mini kit (Qiagen) using the Qiacube system (Qiagen) following the manufactures protocol. RNA quantity and quality were examined with a NanoDrop ND-1000 spectrophotometer (NanoDrop Technologies, Thermo Fisher Scientific). 500 ng of total RNA were transcribed into cDNA (High Capacity cDNA Reverse Transcription Kit, Thermo Fisher Scientific) and diluted 1:6 in dH2O.
Absolute transcript quantification by qPCR
Mouse cDNA was amplified with gene-specific primers (Sigma, Key Resources Table) and HotStarTaq Master Mix Kit (Qiagen). Amplicons were cloned into pGEM-T vector (Promega, WI) and transformed into One Shot MAX Efficiency DH10B T1 cells (Invitrogen, CA). Plasmids were isolated (Qiagen Plasmid Mini Kit), sequenced (eurofins Genomics, Ebersberg, Germany), quantified and diluted in series of 10. Mouse samples were analyzed in a 12.5-μl reaction mix consisting of 1× SYBR Green Master Mix buffer (Thermo Fisher Scientific), 0.2 μM of custom-made primers (Sigma, Key Resources Table) and 2.5 μl of template cDNA on a CFX96 Real-Time System (Bio-Rad). Transcript copy numbers were quantified by standard curves derived from the 10-fold plasmid dilutions described above.
Histology
Fresh intestinal mouse tissue was fixed in water-free Methacarn solution (Carnoy, 60% dry methanol, 30% chloroform, 10% glacial acetic acid) for at least 24 hours and processed into paraffin-embedded tissue sections by the Skandinaviskt Centrum för Histoteknik in Gothenburg, Sweden. One section per samples was stained with Alcian-Blue/Periodic acid–Schiff (AB/PAS) to evaluate polysaccharide structures.
Immunohistochemistry
Paraffin-embedded tissue slides were de-waxed and antigen retrieval was carried out in 10 mM citrate buffer, pH 6.0. Tissue was blocked in 5% fetal calf serum (FCS), washed in PBS and incubated with primary antibodies (αMuc2(mature): Rabbit Muc2-C3, αMuc2(non-O-glycosylated): Rabbit Muc2-PH497), diluted in FCS over night. After another washing step tissue sections were incubated with a fluorophore-conjugated secondary antibody (Donkey α-Rabbit AF 488, Thermo Fisher Scientific) diluted in block solution for 2 hours. DNA was stained with Hoechst-34580 (Sigma-Aldrich; 5 μg/ml) in PBS for 5 min, slides were washed in dH2O, dried and mounted in a small volume of Prolong-Gold Antifade mounting medium (ThermoFisher Scientific).
Goblet cell count
Goblet cell number was independently investigated in Carnoy-fixed colonic tissue sections by two blinded scientists. Only crypts that were cut longitudinally from crypt opening to bottom of the crypt were considered.
DNA extraction and 16S rRNA gene sequencing
Genomic DNA from mucosal tissue, content and feces was extracted by repeated bead-beating using a Fast-Prep System with Lysing Matrix E (MPBio, CA) as described previously (Salonen et al., 2010). Bacterial DNA present in luminal content and intestinal tissue was profiled by sequencing of the V4 region of the 16S rRNA gene on an Illumina MiSeq (llumina RTA v1.17.28; MCS v2.5) using 515F and 806R primers designed for dual indexing (Kozich et al., 2013) and the V2 kit (2×250 bp paired-end reads). Intestinal content samples were amplified in duplicates whereas mucosa-associated bacteria (MAB) samples were amplified in triplicates in reaction volumes of 25 μl containing 1× Five Prime Hot Master Mix (Quantabio, MA), 200 nM of each primer, 0.4 mg/ml BSA, 5% DMSO and 20 ng (content samples) or 100 ng (MAB) of genomic DNA. PCR was carried out under the following conditions: initial denaturation for 3 min at 94°C, followed by 25 cycl es (content samples) or 28 cycles (MAB samples) of denaturation for 45 sec at 94°C, a nnealing for 60 sec at 52°C and elongation for 90 sec at 72°C, and a final elongati on step for 10 min at 72°C. Replicates were combined, purified with the NucleoSpin Gel and PCR Clean-up kit (Macherey-Nagel, Germany) and quantified using the Quant-iT PicoGreen dsDNA kit (Thermo Fisher Scientific). Equal amounts of purified PCR products were pooled and the pooled PCR products were purified again using Ampure magnetic purification beads (Agencourt, Danvers, MA) to remove short amplification products.
Illumina paired-end reads were merged using PEAR (Zhang et al., 2014), and quality filtered to remove reads that had at least one base with a q-score lower than 20 and that were shorter than 220 nucleotides or longer than 350 nucleotides. Quality filtered reads were analyzed with the software package QIIME (Caporaso et al., 2010a) (version 1.9.1). Sequences were clustered into operational taxonomic units (OTUs) at a 97% identity threshold using an open-reference OTU picking approach with UCLUST (Edgar, 2010) against the Greengenes reference database (DeSantis et al., 2006) (13_8 release). All sequences that failed to cluster when tested against the Greengenes database were used as input for picking OTUs de novo. Representative sequences for the OTUs were Greengenes reference sequences or cluster seeds, and were taxonomically assigned using the Greengenes taxonomy and the Ribosomal Database Project Classifier (Wang et al., 2007). Representative OTUs were aligned using PyNAST (Caporaso et al., 2010b) and used to build a phylogenetic tree with FastTree (Price et al., 2010), which was used to calculate α- and β-diversity of samples using Phylogenetic Diversity (Faith, 1992). Chimeric sequences were identified with ChimeraSlayer (Haas et al., 2011) and excluded from all downstream analyses. Similarly, sequences that could not be aligned with PyNAST, singletons and very low abundant sequences (relative abundance <0.005%) were also excluded.
To correct for differences in sequencing depth, the same amount of sequences was randomly sub-sampled for each group of samples (rarefaction; maximum depth depending on sample group). A bootstrap version of Mann-Whitney-U test was used to compare the diet-dependent or genotype-dependent abundance of OTUs at different taxonomical levels; significant differences were identified after correction for false discovery rate. Abundances higher than 1% are displayed on the genus level. QIIME was used to compute alpha diversity from rarefied OTU tables and to determine statistical significance at maximum rarefaction level by using a two-sample t-test and 999 Monte-Carlo permutations. Beta-diversity and weighted unifrac distance matrix of dietary groups were computed with QIIME and statistical significance of sample groupings was determined by adonis method and 999 permutations.
Quantification of fermentation products
Caecal short-chain fatty acids were measured using gas chromatography coupled to mass spectrometry detection (GC-MS) as described previously (Wichmann et al., 2013). Briefly, approximately 20–100 mg of caecal content were mixed with internal standards (Key Resources Table), added to glass vials and freeze dried. All samples were then acidified with HCl, and SCFAs were extracted with two rounds of diethyl ether extraction. The organic supernatant was collected, the derivatization agent N-tert-butyldimethylsilyl-N-methyltrifluoroacetamide (Sigma-Aldrich) was added and samples were incubated at room temperature overnight. SCFAs were quantified with a gas chromatograph (Agilent Technologies 7890A) coupled to a mass spectrometer (Agilent Technologies 5975C).
Western style diet feeding for 0 – 28 days
11 – 12 weeks old mice fed a chow diet were switched to a Western style diet for 0–28 days. Mucus properties were examined at the respective days and colonic content was snap-frozen at −80ºC for 16S rDNA microbiota analyses as described.
Caecal microbiota transplantation
After 10 weeks fed a chow diet mice were gavaged with 200 μl of an antibiotic cocktail once a day for three consecutive days (ampicillin 1 g/l, metronidazole 1 g/l, vancomycin 0. 5g/l, neomycin 0.5 g/l, Sigma-Aldrich). Subsequently mice were switched to a Western style diet and gavaged weekly with caecal content from age- and gender matched mice fed either a chow diet or a Western style diet. Body weight gain was controlled weekly while metabolic parameters (body fat, fasting glucose, fasting insulin) as well as mucus properties were examined after 6 weeks at the end of the experiment. Colonic content was snap-frozen at −80ºC for 16S rDNA microbiota analyses.
B. longum and inulin supplementation
Mice were maintained on a chow diet and switched to a Western style diet at the age of 9 – 11 weeks. Mucus properties were analyzed in a subset of mice (n = 4) to confirm correct physiology of the inner colonic mucus layer before the dietary switch. The remaining mice were divided into 4 groups and fed a WSD for 4 weeks. Autoclaved drinking water was supplemented with 1% oligofructose-enriched inulin (w/v, Orafti Synergi 1, Beneo, Tienen, Belgium), Bifidobacterium longum NCC2705 from glycerol stock (about 2 × 10⁶ colony forming units/ml final) or a combination of both and replaced daily. The control group (WSD) received Reinforced Clostridial Medium (Difco) with 20% glycerol but without bacterial cells. Of note, addition of 1% inulin did not alter the amount of viable Bifidobacterium longum in the water bottle as compared to control and on average each mouse obtained at least 1.2 × 10⁷ colony forming units per day. Metabolic parameters were analyzed 3 weeks after the dietary switch and mucus measurements were performed after 4 weeks.
QUANTIFICATION AND STATISTICAL ANALYSIS
Statistical analyses have been carried out with GraphPad Prism (version 7.0b) if not stated otherwise in the methods section. For comparisons between two groups an unpaired t-test has been used when samples were distributed normally. For not-normally distributed samples Mann-Whitney U test has been used. In all figures data are presented as mean ± SEM, except for alpha-diversity (Figures 3B, 3E, 4F, 5J) where ±SD is shown. For correlation analysis Pearson correlation coefficients were calculated for normally distributed data while nonparametric Spearman correlations were used for not-normally distributed data. A linear regression line in the figure indicates a significant correlation. For the time course experiment (Figure 4) a linear regression model over time has been used to calculate statistical significance. When comparing 4–5 groups (Figure 6) statistical significance against WSD fed mice (vehicle control) was determined by Kruskal-Wallis test and corrected by Dunn’s multiple comparisons test.
All statistical analyses for 16S rDNA sequencing data have been performed with QIIME (Caporaso et al., 2010a) (version 1.9.1). The script group_significance.py with a bootstrap version of Mann-Whitney U test with Bonferroni correction has been used to determine statistically significant differences between two groups. For more than two groups (Timepoint experiment, Figure 4) Kruskal-Wallis test has been used. Statistical significance in alpha diversity was determined with the script compare_alpha_diversity.py and the default settings (two-sample t-test and 999 Monte-Carlo permutations). Statistical significance in beta-diversity was determined with the script compare_categories.py and the adonis statistical method and 999 permutations. Results are presented in Table S1.
DATA AND SOFTWARE AVAILABILITY
The mass spectrometry proteomics data were deposited to the Proteome Xchange Consortium (http://proteomecentral.proteomexchange.org) with the dataset identifier PXD006129.
Microbiota 16S rDNA gene sequencing results have been deposited in the ENA sequence read archive with accession number PRJEB20367 (http://www.ebi.ac.uk/ena/data/view).
KEY RESOURCES TABLE
KEY RESOURCES TABLE.
| REAGENT or RESOURCE | SOURCE | IDENTIFIER |
|---|---|---|
| Antibodies | ||
| Rabbit polyclonal anti-Muc2 (Muc2C3) | Johansson et al, 2008 | N/A |
| Rabbit polyclonal anti-apo-Muc2 (PH497) | Hansson et al., 1994 | N/A |
| Bacterial and Virus Strains | ||
| Bifidobcterium longum NCC2705 | Nestlé | N/A |
| Chemicals, Peptides, and Recombinant Proteins | ||
| GuHCl 8M | Thermo Scientific | 24115 |
| DTT | Sigma-Aldrich | D9163 |
| Iodoacetamide | Sigma-Aldrich | I6125 |
| LysC | Wako | 125-05061 |
| Trypsin | Promega | V5111 |
| Mouse Muc2 SpikeTides™_L Proteotypic Peptides | JPT | N/A |
| Fat adjusted diet | Envigo | TD.96132 |
| Autoclavable Mouse Breeder Diet | LabDiet | 5021 |
| Isoflurane | Kronans apotek | N01AB06 |
| 2X cOmplete Protease Inhibitor Cocktail | Roche | 11873580001 |
| Lysing matrix E | MPBio | 116914100 |
| Sodium isovalerate-1-13C | Sigma-Aldrich | 487643 |
| Isobutyric acid-1-13C | Sigma-Aldrich | 606138 |
| Sodium butyrate-13C4 | Sigma-Aldrich | 488380 |
| Propionic acid-d6 | Sigma-Aldrich | 490644 |
| Sodium acetate-1-13C,d3 | Sigma-Aldrich | 298042 |
| Succinic acid 13C4 | Cambride Isotope Laboratories | CLM-1571 |
| Sodium lactate 13C3 | Cambride Isotope Laboratories | CLM-1579 |
| N-tert-butyldimethylsilyl-N-methyltrifluoroacetamide | Sigma-Aldrich | 394882 |
| Ampicillin | Sigma-Aldrich | A9518-100G |
| Metronidazole | Sigma-Aldrich | M3761-5G |
| Vancomycin | Sigma-Aldrich | V2002-5G |
| Neomycin | Sigma-Aldrich | |
| N6386-100G | ||
| Black 10μm polystyrene Polybead microspheres | Polysciences | 24294 |
| Crimson 1μm Fluospheres | Thermo Fisher Scientific | F8816 |
| Calcein violet AM | Thermo Fisher Scientific | C34858 |
| Hoechst-34580 | Sigma-Aldrich | 63493 |
| Oligofructose-enriched inulin (Orafti Synergy 1) | Alsiano/Beneo | http://www.beneo.com |
| Difco Reinforced Clostridial Medium | BD | 218081 |
| Critical Commercial Assays | ||
| Bayer Contour Next blood glucose strips | Kronans apotek | 732781 |
| Ultra Sensitive Mouse Insulin ELISA kit | Crystal Chem Inc. | 90080 |
| RNeasy Mini kit | Qiagen | 74106 |
| High Capacity cDNA Reverse Transcription Kit | Thermo Fisher Scientific | 4368814 |
| HotStarTaq Master mix Kit | Qiagen | 203445 |
| pGEM®-T Vector Systems | Promega | A3600 |
| One Shot MAX Efficiency DH10B T1 cells | Invitrogen | 12331-013 |
| QIAprep Spin Miniprep Kit | Qiagen | 27106 |
| 1x SYBR Green Master Mix | Thermo Fisher Scientific | 4309155 |
| 5PRIME HotMasterMix | Quantabio | 733-2474 |
| NucleoSpin Gel and PCR Clean-up kit | Macherey-Nagel | 740609 |
| Quant-iT PicoGreen dsDNA Assay kit | Thermo Fisher Scientific | P11496 |
| Agencourt AMPure XP | Beckman Coulter | A63880 |
| Deposited Data | ||
| Proteomics data raw data | This paper | ProteomeXchange PXD006129 |
| Microbiota 16S rDNA gene sequences | This paper | ENA archivePRJEB20367 |
| Greengenes reference database | DeSantis et al., 2006 | http://greengenes.lbl.gov |
| Experimental Models: Organisms/Strains | ||
| Male C57BL/6J mice | Charles River Germany | 000664 |Black 6 |
| Male heterozygous Ob/WT mice B6.Cg-Lepob/J | Charles River Italy | 000632 | B6 ob |
| Female heterozygous Ob/WT mice B6.Cg-Lepob/J | Charles River Italy | 000632 | B6 ob |
| Male C57BL/6J mice | own breeding | N/A |
| Oligonucleotides | ||
| V4 region 515F and 806R primers | Kozich et al., 2013 | N/A |
| Dmbt1 F 5′-GGGGATCTCCACTGTTATCTTTGA-3′ | Sigma-Aldrich | N/A |
| Dmbt1 R 5′-AGAATCTGTTCCATCTGTGGGA-3′ | Sigma-Aldrich | N/A |
| Recombinant DNA | ||
| pGEM-T-Dmbt1 | This paper | N/A |
| Software and Algorithms | ||
| MaxQuant | Cox, et al 2008 | http://www.biochem.mpg.de/5111795/maxquant |
| Perseus | Tyanova, et al 2016 | http://www.biochem.mpg.de/5111810/perseus |
| Prism (version 7.0b) | GraphPad | https://www.graphpad.com/scientific-software/prism/ |
| QIIME (version 1.9.1). | Caporaso et al., 2010a | http://qiime.org |
| Mouse mucin sequence database | in-house database | http://www.medkem.gu.se/mucinbiology/databases/ |
| PEAR | Zhang et al., 2014 | http://www.exelixis-lab.org/web/software/pear |
| UCLUST | Edgar, 2010 | http://www.drive5.com/usearch/ |
| Imaris (version 7.6.3) | Bitplane | http://www.bitplane.com |
| Zen (version 2.3) | Carl Zeiss | http://www.zeiss.com |
| PyNAST | Caporaso et al., 2010b | http://pynast.sourceforge.net |
| FastTree | Price et al., 2010 | http://www.microbesonline.org/fasttree |
| ChimeraSlayer | Haas et al., 2010 | http://microbiomeutil.sourceforge.net/#A_CS |
| Other | ||
| Nanosep 10K Omega | Pall, Life Sciences | OD010C35 |
| EchoMRI Body Composition Analyzers for Live Small Animals | Echo Medical Systems | http://www.echomri.com |
| EASY-nLC system 1000 | Thermo Scientific | LC120 |
| reverse-phase column (150 × 0.075 mm inner diameter, C18-AQ 3 μm | in-house packed | N/A |
| QExactive Hybrid Quadrupole-Orbitrap Mass Spectrometer | Thermo Scientific | IQLAAEGAAPFALGMAZR |
| StageTip C18 columns | Rappsilber et al., 2007 | N/A |
| TissueLyser II | Qiagen | 85300 |
| QiaCube | Qiagen | 9001885 |
| NanoDrop ND-1000 spectrophotometer | Thermo Scientific | http://www.nanodrop.com/Products.aspx |
| CFX96 Real-Time PCR Detection System | Bio-Rad | C1000 |
| Illumina MiSeq | Illumina | https://www.illumina.com/systems/sequencing-platforms/miseq.html |
| Fast-Prep-24 Classic | MPBio | 116004500 |
| Gas Chromatograph-Mass Spectrometer | Agilent Technologies | 7890A + 5975C series |
| Anaerobic COY chamber | COY Laboratory Products | http://coylab.com/products/anaerobic-chambers/vinyl-anaerobic-chambers/ |
| Horizontal perfusion chamber | Gustafsson et al., 2012 | N/A |
| Perfusion chamber heating blocks | Gustafsson et al., 2012 | N/A |
| Dual automatic temperature controller | Warner instruments | TC-344B |
| DDS syringe pump | Harvard apparatus | 70-3333 |
| LED light source | Photonic optics | F3000 |
| Stereo-microscope | Lecia | MZ75 |
| Digimatic micrometer | Mitutoyo | 350-261-30 |
| Digimatic interface | Mitutoyo | 264-014-10 |
| Borosilicate glass capillaries | Sutter instrument | BF120-60-10 |
| Flaming/Brown Micropipette Puller | Sutter instrument | P-97 |
| Laser scanning confocal imaging system | Carl Zeiss | LSM700 |
Supplementary Material
Relative abundance data and detailed statistical analysis of 16S rDNA microbiota analyses. Related to Figure 3, Figure 4 and Figure 5.
SpikeTide TQL isotopically labelled peptides used for absolute quantification of Muc2. Related to Figure 2.
HIGHLIGHTS.
Western style diet (WSD) impairs key functions of the colonic mucus layer in mice
Microbiota transplant from chow-fed mice prevents mucus aberrations in mice fed a WSD
Mucus aberrations can be prevented by Bifidobacterium longum and inulin treatment
Acknowledgments
We would like to thank Valentina Tremaroli and Rozita Akrami (University of Gothenburg) for bioinformatics assistance. Furthermore, we thank Zakarias Gulic and Caroline Wennberg for excellent animal husbandry, the Centre for Cellular Imaging at the University of Gothenburg, Alsiano/Beneo for kindly providing inulin and Nestlé for providing the Bifidobacterium longum NCC2705 strain. The computations for microbiota composition analyses were performed on resources provided by the Swedish National Infrastructure for Computing (SNIC) through Uppsala Multidisciplinary Center for Advanced Computational Science (UPPMAX). Work in the authors laboratories are supported by the Swedish Research Council, the NovoNordisk foundation, Swedish Heart Lung Foundation, Göran Gustafsson’s foundation, IngaBritt och Arne Lundbergs foundation, Knut and Alice Wallenberg foundation, National Institute of Allergy and Infectious Diseases (U01AI095473, the content is solely the responsibility of the authors and does not necessarily represent the official views of the NIH), Hasselblad foundation, the FP7 sponsored program METACARDIS, and the regional agreement on medical training and clinical research (ALF) between Region Västra Götaland and Sahlgrenska University Hospital. FB is Torsten Söderberg professor in medicine and recipient of a European Research Council Consolidator Grant (615362 - METABASE), GCH is a recipient of a European Research Council Advanced Grant (694181 – MUC2GO) and BOS is supported by a Marie Curie Intra European Fellowship (622909 - MUCUS AND METABOLISM) and a Human Frontier Science Program Long-Term Fellowship.
Footnotes
AUTHOR CONTRIBUTIONS
Conceptualization, B.O.S, G.M.H.B., G.C.H., and F.B.; Methodology, B.O.S., G.M.B.H., M.S., L.A., M.E.V.J., G.C.H., F.B.; Investigation, B.O.S, G.M.H.B., M.S., L.A.; Writing – Original Draft, B.O.S. and F.B.; Writing – Review & Editing, all authors; Funding Acquisition, G.C.H. and F.B.; Resources, G.C.H. and F.B.; Supervision, F.B.
Publisher's Disclaimer: This is a PDF file of an unedited manuscript that has been accepted for publication. As a service to our customers we are providing this early version of the manuscript. The manuscript will undergo copyediting, typesetting, and review of the resulting proof before it is published in its final citable form. Please note that during the production process errors may be discovered which could affect the content, and all legal disclaimers that apply to the journal pertain.
References
- Ambort D, Johansson MEV, Gustafsson JK, Nilsson HE, Ermund A, Johansson BR, Koeck PJB, Hebert H, Hansson GC. Calcium and pH-dependent packing and release of the gel-forming MUC2 mucin. Proc Natl Acad Sci. 2012;109:5645–5650. doi: 10.1073/pnas.1120269109. [DOI] [PMC free article] [PubMed] [Google Scholar]
- Birchenough GMH, Nyström EEL, Johansson MEV, Hansson GC. A sentinel goblet cell guards the colonic crypt by triggering Nlrp6-dependent Muc2 secretion. Science. 2016;352:1535–1542. doi: 10.1126/science.aaf7419. [DOI] [PMC free article] [PubMed] [Google Scholar]
- Bishara J, Farah R, Mograbi J, Khalaila W, Abu-Elheja O, Mahamid M, Nseir W. Obesity as a Risk Factor for Clostridium difficile Infection. Clin Infect Dis. 2013;57:489–493. doi: 10.1093/cid/cit280. [DOI] [PubMed] [Google Scholar]
- Burcelin R, Serino M, Chabo C, Garidou L, Pomié C, Courtney M, Amar J, Bouloumié A. Metagenome and metabolism: the tissue microbiota hypothesis. Diabetes Obes Metab. 2013;15:61–70. doi: 10.1111/dom.12157. [DOI] [PubMed] [Google Scholar]
- Caesar R, Reigstad CS, Bäckhed HK, Reinhardt C, Ketonen M, Lundén GÖ, Cani PD, Bäckhed F. Gut-derived lipopolysaccharide augments adipose macrophage accumulation but is not essential for impaired glucose or insulin tolerance in mice. Gut. 2012;61:1701–1707. doi: 10.1136/gutjnl-2011-301689. [DOI] [PMC free article] [PubMed] [Google Scholar]
- Cani PD, Amar J, Iglesias MA, Poggi M, Knauf C, Bastelica D, Neyrinck AM, Fava F, Tuohy KM, Chabo C, et al. Metabolic endotoxemia initiates obesity and insulin resistance. Diabetes. 2007;56:1761–1772. doi: 10.2337/db06-1491. [DOI] [PubMed] [Google Scholar]
- Caporaso JG, Kuczynski J, Stombaugh J, Bittinger K, Bushman FD, Costello EK, Fierer N, Peña AG, Goodrich JK, Gordon JI, et al. QIIME allows analysis of high-throughput community sequencing data. Nat Methods. 2010a;7:335–336. doi: 10.1038/nmeth.f.303. [DOI] [PMC free article] [PubMed] [Google Scholar]
- Caporaso JG, Bittinger K, Bushman FD, DeSantis TZ, Andersen GL, Knight R. PyNAST: a flexible tool for aligning sequences to a template alignment. Bioinformatics. 2010b;26:266–267. doi: 10.1093/bioinformatics/btp636. [DOI] [PMC free article] [PubMed] [Google Scholar]
- Chassaing B, Raja SM, Lewis JD, Srinivasan S, Gewirtz AT. Colonic Microbiota Encroachment Correlates With Dysglycemia in Humans. Cell Mol Gastroenterol Hepatol. 2017;4:205–221. doi: 10.1016/j.jcmgh.2017.04.001. [DOI] [PMC free article] [PubMed] [Google Scholar]
- Chung H, Pamp SJ, Hill JA, Surana NK, Edelman SM, Troy EB, Reading NC, Villablanca EJ, Wang S, Mora JR, et al. Gut Immune Maturation Depends on Colonization with a Host-Specific Microbiota. Cell. 2012;149:1578–1593. doi: 10.1016/j.cell.2012.04.037. [DOI] [PMC free article] [PubMed] [Google Scholar]
- Cotillard A, Kennedy SP, Kong LC, Prifti E, Pons N, Le Chatelier E, Almeida M, Quinquis B, Levenez F, Galleron N, et al. Dietary intervention impact on gut microbial gene richness. Nature. 2013;500:585–588. doi: 10.1038/nature12480. [DOI] [PubMed] [Google Scholar]
- Cox J, Mann M. MaxQuant enables high peptide identification rates, individualized p.p.b.-range mass accuracies and proteome-wide protein quantification. Nat Biotechnol. 2008;26:1367–1439. doi: 10.1038/nbt.1511. [DOI] [PubMed] [Google Scholar]
- David LA, Maurice CF, Carmody RN, Gootenberg DB, Button JE, Wolfe BE, Ling AV, Devlin AS, Varma Y, Fischbach MA, et al. Diet rapidly and reproducibly alters the human gut microbiome. Nature. 2014;505:559–563. doi: 10.1038/nature12820. [DOI] [PMC free article] [PubMed] [Google Scholar]
- Desai MS, Seekatz AM, Koropatkin NM, Kamada N, Hickey CA, Wolter M, Pudlo NA, Kitamoto S, Terrapon N, Muller A, et al. A Dietary Fiber-Deprived Gut Microbiota Degrades the Colonic Mucus Barrier and Enhances Pathogen Susceptibility. Cell. 2016;167:1339–1353. e21. doi: 10.1016/j.cell.2016.10.043. [DOI] [PMC free article] [PubMed] [Google Scholar]
- DeSantis TZ, Hugenholtz P, Larsen N, Rojas M, Brodie EL, Keller K, Huber T, Dalevi D, Hu P, Andersen GL. Greengenes, a Chimera-Checked 16S rRNA Gene Database and Workbench Compatible with ARB. Appl Environ Microbiol. 2006;72:5069–5072. doi: 10.1128/AEM.03006-05. [DOI] [PMC free article] [PubMed] [Google Scholar]
- Dewulf EM, Cani PD, Neyrinck AM, Possemiers S, Holle AV, Muccioli GG, Deldicque L, Bindels LB, Pachikian BD, Sohet FM, et al. Inulin-type fructans with prebiotic properties counteract GPR43 overexpression and PPARγ-related adipogenesis in the white adipose tissue of high-fat diet-fed mice. J Nutr Biochem. 2011;22:712–722. doi: 10.1016/j.jnutbio.2010.05.009. [DOI] [PubMed] [Google Scholar]
- Duranti S, Gaiani F, Mancabelli L, Milani C, Grandi A, Bolchi A, Santoni A, Lugli GA, Ferrario C, Mangifesta M, et al. Elucidating the gut microbiome of ulcerative colitis: bifidobacteria as novel microbial biomarkers. FEMS Microbiol Ecol. 2016:92. doi: 10.1093/femsec/fiw191. [DOI] [PubMed] [Google Scholar]
- Earle KA, Billings G, Sigal M, Lichtman JS, Hansson GC, Elias JE, Amieva MR, Huang KC, Sonnenburg JL. Quantitative Imaging of Gut Microbiota Spatial Organization. Cell Host Microbe. 2015;18:478–488. doi: 10.1016/j.chom.2015.09.002. [DOI] [PMC free article] [PubMed] [Google Scholar]
- Edgar RC. Search and clustering orders of magnitude faster than BLAST. Bioinformatics. 2010;26:2460–2461. doi: 10.1093/bioinformatics/btq461. [DOI] [PubMed] [Google Scholar]
- Everard A, Lazarevic V, Derrien M, Girard M, Muccioli GG, Neyrinck AM, Possemiers S, Holle AV, François P, de Vos WM, et al. Responses of Gut Microbiota and Glucose and Lipid Metabolism to Prebiotics in Genetic Obese and Diet-Induced Leptin-Resistant Mice. Diabetes. 2011;60:2775–2786. doi: 10.2337/db11-0227. [DOI] [PMC free article] [PubMed] [Google Scholar]
- Everard A, Belzer C, Geurts L, Ouwerkerk JP, Druart C, Bindels LB, Guiot Y, Derrien M, Muccioli GG, Delzenne NM, et al. Cross-talk between Akkermansia muciniphila and intestinal epithelium controls diet-induced obesity. Proc Natl Acad Sci. 2013;110:9066–9071. doi: 10.1073/pnas.1219451110. [DOI] [PMC free article] [PubMed] [Google Scholar]
- Faith DP. Conservation evaluation and phylogenetic diversity. Biol Conserv. 1992;61:1–10. [Google Scholar]
- Filippo CD, Cavalieri D, Paola MD, Ramazzotti M, Poullet JB, Massart S, Collini S, Pieraccini G, Lionetti P. Impact of diet in shaping gut microbiota revealed by a comparative study in children from Europe and rural Africa. Proc Natl Acad Sci. 2010;107:14691–14696. doi: 10.1073/pnas.1005963107. [DOI] [PMC free article] [PubMed] [Google Scholar]
- Fu J, Wei B, Wen T, Johansson M, Liu X, Bradford E, Thomsson K, McGee S, Mansour L, Tong M, et al. Loss of intestinal core 1-derived O-glycans causes spontaneous colitis in mice. J Clin Invest. 2011;121:1657–1723. doi: 10.1172/JCI45538. [DOI] [PMC free article] [PubMed] [Google Scholar]
- Fukuda S, Toh H, Hase K, Oshima K, Nakanishi Y, Yoshimura K, Tobe T, Clarke J, Topping D, Suzuki T, et al. Bifidobacteria can protect from enteropathogenic infection through production of acetate. Nature. 2011;469:543–550. doi: 10.1038/nature09646. [DOI] [PubMed] [Google Scholar]
- Gentschew L, Ferguson LR. Role of nutrition and microbiota in susceptibility to inflammatory bowel diseases. Mol Nutr Food Res. 2012;56:524–535. doi: 10.1002/mnfr.201100630. [DOI] [PubMed] [Google Scholar]
- Gibson GR, Beatty ER, Wang X, Cummings JH. Selective stimulation of bifidobacteria in the human colon by oligofructose and inulin. Gastroenterology. 1995;108:975–982. doi: 10.1016/0016-5085(95)90192-2. [DOI] [PubMed] [Google Scholar]
- Gustafsson JK, Ermund A, Johansson MEV, Schütte A, Hansson GC, Sjövall H. An ex vivo method for studying mucus formation, properties, and thickness in human colonic biopsies and mouse small and large intestinal explants. Am J Physiol Gastrointest Liver Physiol. 2012;302:G430–438. doi: 10.1152/ajpgi.00405.2011. [DOI] [PMC free article] [PubMed] [Google Scholar]
- Haas BJ, Gevers D, Earl AM, Feldgarden M, Ward DV, Giannoukos G, Ciulla D, Tabbaa D, Highlander SK, Sodergren E, et al. Chimeric 16S rRNA sequence formation and detection in Sanger and 454-pyrosequenced PCR amplicons. Genome Res. 2011;21:494–504. doi: 10.1101/gr.112730.110. [DOI] [PMC free article] [PubMed] [Google Scholar]
- He F, Ouwehand AC, Hashimoto H, Isolauri E, Benno Y, Salminen S. Adhesion of Bifidobacterium Spp. to Human Intestinal Mucus. Microbiol Immunol. 2001;45:259–262. doi: 10.1111/j.1348-0421.2001.tb02615.x. [DOI] [PubMed] [Google Scholar]
- Heazlewood CK, Cook MC, Eri R, Price GR, Tauro SB, Taupin D, Thornton DJ, Png CW, Crockford TL, Cornall RJ, et al. Aberrant Mucin Assembly in Mice Causes Endoplasmic Reticulum Stress and Spontaneous Inflammation Resembling Ulcerative Colitis. PLOS Med. 2008;5:e54. doi: 10.1371/journal.pmed.0050054. [DOI] [PMC free article] [PubMed] [Google Scholar]
- Hildebrandt MA, Hoffmann C, Sherrill–Mix SA, Keilbaugh SA, Hamady M, Chen Y, Knight R, Ahima RS, Bushman F, Wu GD. High-Fat Diet Determines the Composition of the Murine Gut Microbiome Independently of Obesity. Gastroenterology. 2009;137:1716–1724. e2. doi: 10.1053/j.gastro.2009.08.042. [DOI] [PMC free article] [PubMed] [Google Scholar]
- Jakobsson HE, Rodríguez-Piñeiro AM, Schütte A, Ermund A, Boysen P, Bemark M, Sommer F, Bäckhed F, Hansson GC, Johansson ME. The composition of the gut microbiota shapes the colon mucus barrier. EMBO Rep. 2015;16:164–177. doi: 10.15252/embr.201439263. [DOI] [PMC free article] [PubMed] [Google Scholar]
- Johansson MEV. Fast Renewal of the Distal Colonic Mucus Layers by the Surface Goblet Cells as Measured by In Vivo Labeling of Mucin Glycoproteins. PLOS ONE. 2012;7:e41009. doi: 10.1371/journal.pone.0041009. [DOI] [PMC free article] [PubMed] [Google Scholar]
- Johansson MEV, Phillipson M, Petersson J, Velcich A, Holm L, Hansson GC. The inner of the two Muc2 mucin-dependent mucus layers in colon is devoid of bacteria. Proc Natl Acad Sci. 2008;105:15064–15069. doi: 10.1073/pnas.0803124105. [DOI] [PMC free article] [PubMed] [Google Scholar]
- Johansson MEV, Gustafsson JK, Holmén-Larsson J, Jabbar KS, Xia L, Xu H, Ghishan FK, Carvalho FA, Gewirtz AT, Sjövall H, et al. Bacteria penetrate the normally impenetrable inner colon mucus layer in both murine colitis models and patients with ulcerative colitis. Gut. 2014;63:281–291. doi: 10.1136/gutjnl-2012-303207. [DOI] [PMC free article] [PubMed] [Google Scholar]
- Kaoutari AE, Armougom F, Gordon JI, Raoult D, Henrissat B. The abundance and variety of carbohydrate-active enzymes in the human gut microbiota. Nat Rev Microbiol. 2013;11:497–504. doi: 10.1038/nrmicro3050. [DOI] [PubMed] [Google Scholar]
- Koh A, De Vadder F, Kovatcheva-Datchary P, Bäckhed F. From Dietary Fiber to Host Physiology: Short-Chain Fatty Acids as Key Bacterial Metabolites. Cell. 2016;165:1332–1345. doi: 10.1016/j.cell.2016.05.041. [DOI] [PubMed] [Google Scholar]
- Kozich JJ, Westcott SL, Baxter NT, Highlander SK, Schloss PD. Development of a Dual-Index Sequencing Strategy and Curation Pipeline for Analyzing Amplicon Sequence Data on the MiSeq Illumina Sequencing Platform. Appl Environ Microbiol. 2013;79:5112–5120. doi: 10.1128/AEM.01043-13. [DOI] [PMC free article] [PubMed] [Google Scholar]
- Kumar SA, Ward LC, Brown L. Inulin oligofructose attenuates metabolic syndrome in high-carbohydrate, high-fat diet-fed rats. Br J Nutr. 2016;116:1502–1511. doi: 10.1017/S0007114516003627. [DOI] [PubMed] [Google Scholar]
- Madsen J, Mollenhauer J, Holmskov U. Review: Gp-340/DMBT1 in mucosal innate immunity. Innate Immun. 2010;16:160–167. doi: 10.1177/1753425910368447. [DOI] [PubMed] [Google Scholar]
- Martens EC, Chiang HC, Gordon JI. Mucosal Glycan Foraging Enhances Fitness and Transmission of a Saccharolytic Human Gut Bacterial Symbiont. Cell Host Microbe. 2008;4:447–457. doi: 10.1016/j.chom.2008.09.007. [DOI] [PMC free article] [PubMed] [Google Scholar]
- Ormerod KL, Wood DLA, Lachner N, Gellatly SL, Daly JN, Parsons JD, Dal’Molin CGO, Palfreyman RW, Nielsen LK, Cooper MA, et al. Genomic characterization of the uncultured Bacteroidales family S24-7 inhabiting the guts of homeothermic animals. Microbiome. 2016;4:36. doi: 10.1186/s40168-016-0181-2. [DOI] [PMC free article] [PubMed] [Google Scholar]
- Picard C, Fioramonti J, Francois A, Robinson T, Neant F, Matuchansky C. Review article: bifidobacteria as probiotic agents – physiological effects and clinical benefits. Aliment Pharmacol Ther. 2005;22:495–512. doi: 10.1111/j.1365-2036.2005.02615.x. [DOI] [PubMed] [Google Scholar]
- Price MN, Dehal PS, Arkin AP. FastTree 2 – Approximately Maximum-Likelihood Trees for Large Alignments. PLOS ONE. 2010;5:e9490. doi: 10.1371/journal.pone.0009490. [DOI] [PMC free article] [PubMed] [Google Scholar]
- Rappsilber J, Mann M, Ishihama Y. Protocol for micro-purification, enrichment, pre-fractionation and storage of peptides for proteomics using StageTips. Nat Protoc. 2007;2:1896–1906. doi: 10.1038/nprot.2007.261. [DOI] [PubMed] [Google Scholar]
- Rossi M, Corradini C, Amaretti A, Nicolini M, Pompei A, Zanoni S, Matteuzzi D. Fermentation of Fructooligosaccharides and Inulin by Bifidobacteria: a Comparative Study of Pure and Fecal Cultures. Appl Environ Microbiol. 2005;71:6150–6158. doi: 10.1128/AEM.71.10.6150-6158.2005. [DOI] [PMC free article] [PubMed] [Google Scholar]
- Salonen A, Nikkilä J, Jalanka-Tuovinen J, Immonen O, Rajilić-Stojanović M, Kekkonen RA, Palva A, de Vos WM. Comparative analysis of fecal DNA extraction methods with phylogenetic microarray: Effective recovery of bacterial and archaeal DNA using mechanical cell lysis. J Microbiol Methods. 2010;81:127–134. doi: 10.1016/j.mimet.2010.02.007. [DOI] [PubMed] [Google Scholar]
- Schnorr SL, Candela M, Rampelli S, Centanni M, Consolandi C, Basaglia G, Turroni S, Biagi E, Peano C, Severgnini M, et al. Gut microbiome of the Hadza hunter-gatherers. Nat Commun. 2014;5:3654. doi: 10.1038/ncomms4654. [DOI] [PMC free article] [PubMed] [Google Scholar]
- Schroeder BO, Bäckhed F. Signals from the gut microbiota to distant organs in physiology and disease. Nat Med. 2016;22:1079–1089. doi: 10.1038/nm.4185. [DOI] [PubMed] [Google Scholar]
- Sonnenburg ED, Smits SA, Tikhonov M, Higginbottom SK, Wingreen NS, Sonnenburg JL. Diet-induced extinctions in the gut microbiota compound over generations. Nature. 2016;529:212–215. doi: 10.1038/nature16504. [DOI] [PMC free article] [PubMed] [Google Scholar]
- Sonnenburg JL, Xu J, Leip DD, Chen CH, Westover BP, Weatherford J, Buhler JD, Gordon JI. Glycan foraging in vivo by an intestine-adapted bacterial symbiont. Science. 2005;307:1955–1959. doi: 10.1126/science.1109051. [DOI] [PubMed] [Google Scholar]
- Teixeira TFS, Souza NCS, Chiarello PG, Franceschini SCC, Bressan J, Ferreira CLLF, do Peluzio MCG. Intestinal permeability parameters in obese patients are correlated with metabolic syndrome risk factors. Clin Nutr. 2012;31:735–740. doi: 10.1016/j.clnu.2012.02.009. [DOI] [PubMed] [Google Scholar]
- Turnbaugh PJ, Bäckhed F, Fulton L, Gordon JI. Diet-Induced Obesity Is Linked to Marked but Reversible Alterations in the Mouse Distal Gut Microbiome. Cell Host Microbe. 2008;3:213–223. doi: 10.1016/j.chom.2008.02.015. [DOI] [PMC free article] [PubMed] [Google Scholar]
- Turnbaugh PJ, Ridaura VK, Faith JJ, Rey FE, Knight R, Gordon JI. The Effect of Diet on the Human Gut Microbiome: A Metagenomic Analysis in Humanized Gnotobiotic Mice. Sci Transl Med. 2009;1:6ra14–6ra14. doi: 10.1126/scitranslmed.3000322. [DOI] [PMC free article] [PubMed] [Google Scholar]
- Tyanova S, Temu T, Sinitcyn P, Carlson A, Hein MY, Geiger T, Mann M, Cox J. The Perseus computational platform for comprehensive analysis of (prote)omics data. Nat Methods. 2016;13:731–740. doi: 10.1038/nmeth.3901. [DOI] [PubMed] [Google Scholar]
- Vandeputte D, Falony G, Vieira-Silva S, Wang J, Sailer M, Theis S, Verbeke K, Raes J. Prebiotic inulin-type fructans induce specific changes in the human gut microbiota. Gut. 2017 doi: 10.1136/gutjnl-2016-313271. gutjnl-2016–313271. [DOI] [PMC free article] [PubMed] [Google Scholar]
- Vizcaíno JA, Csordas A, del-Toro N, Dianes JA, Griss J, Lavidas I, Mayer G, Perez-Riverol Y, Reisinger F, Ternent T, et al. 2016 update of the PRIDE database and its related tools. Nucleic Acids Res. 2016;44:D447–D456. doi: 10.1093/nar/gkv1145. [DOI] [PMC free article] [PubMed] [Google Scholar]
- Wang Q, Garrity GM, Tiedje JM, Cole JR. Naïve Bayesian Classifier for Rapid Assignment of rRNA Sequences into the New Bacterial Taxonomy. Appl Environ Microbiol. 2007;73:5261–5267. doi: 10.1128/AEM.00062-07. [DOI] [PMC free article] [PubMed] [Google Scholar]
- Wichmann A, Allahyar A, Greiner TU, Plovier H, Lundén GÖ, Larsson T, Drucker DJ, Delzenne NM, Cani PD, Bäckhed F. Microbial modulation of energy availability in the colon regulates intestinal transit. Cell Host Microbe. 2013;14:582–590. doi: 10.1016/j.chom.2013.09.012. [DOI] [PubMed] [Google Scholar]
- Wiśniewski JR, Zougman A, Nagaraj N, Mann M. Universal sample preparation method for proteome analysis. Nat Methods. 2009;6:359–362. doi: 10.1038/nmeth.1322. [DOI] [PubMed] [Google Scholar]
- Yatsunenko T, Rey FE, Manary MJ, Trehan I, Dominguez-Bello MG, Contreras M, Magris M, Hidalgo G, Baldassano RN, Anokhin AP, et al. Human gut microbiome viewed across age and geography. Nature. 2012;486:222–227. doi: 10.1038/nature11053. [DOI] [PMC free article] [PubMed] [Google Scholar]
- Zhang J, Kobert K, Flouri T, Stamatakis A. PEAR: a fast and accurate Illumina Paired-End reAd mergeR. Bioinformatics. 2014;30:614–620. doi: 10.1093/bioinformatics/btt593. [DOI] [PMC free article] [PubMed] [Google Scholar]
Associated Data
This section collects any data citations, data availability statements, or supplementary materials included in this article.
Supplementary Materials
Relative abundance data and detailed statistical analysis of 16S rDNA microbiota analyses. Related to Figure 3, Figure 4 and Figure 5.
SpikeTide TQL isotopically labelled peptides used for absolute quantification of Muc2. Related to Figure 2.