

Abstract
Accumulation of paired helical filament tau contributes to neurodegeneration in Alzheimer's disease (AD). 18F‐flortaucipir is a positron emission tomography (PET) radioligand sensitive to tau in AD, but its clinical utility will depend in part on its ability to predict cognitive symptoms in diverse dementia phenotypes associated with selective, regional uptake. We examined associations between 18F‐flortaucipir and cognition in 14 mildly‐impaired patients (12 with cerebrospinal fluid analytes consistent with AD pathology) who had amnestic (n = 5) and non‐amnestic AD syndromes, including posterior cortical atrophy (PCA, n = 5) and logopenic‐variant primary progressive aphasia (lvPPA, n = 4). Amnestic AD patients had deficits in memory; lvPPA in language; and both amnestic AD and PCA patients in visuospatial function. Associations with cognition were tested using sparse regression and compared to associations in anatomical regions‐of‐interest (ROIs). 18F‐flortaucipir uptake was expected to show regionally‐specific correlations with each domain. In multivariate analyses, uptake was elevated in neocortical areas specifically associated with amnestic and non‐amnestic syndromes. Uptake in left anterior superior temporal gyrus accounted for 67% of the variance in language performance. Uptake in right lingual gyrus predicted 85% of the variance in visuospatial performance. Memory was predicted by uptake in right fusiform gyrus and cuneus as well as a cluster comprising right anterior hippocampus and amygdala; this eigenvector explained 57% of the variance in patients' scores. These results provide converging evidence for associations between 18F‐flortaucipir uptake, tau pathology, and patients' cognitive symptoms.
Keywords: Alzheimer disease, cognition, dementia, language, memory, neurofibrillary tangles, primary progressive aphasia, positron emission tomography, posterior cortical atrophy, Tau
1. INTRODUCTION
The hallmark pathology of Alzheimer's disease (AD) involves toxic accumulations of two proteins, beta‐amyloid and tau. Since the advent of a positron emission tomography (PET) tracer for beta‐amyloid, Pittsburgh Compound‐B (Klunk et al., 2004), clinical and cognitive neuroscientists have had the capacity to relate AD diagnoses and symptom severity to quantitative measures of fibrillar beta‐amyloid throughout the brain. Until recently, AD researchers have lacked a method for analogous in vivo imaging of tau accumulation. Given associations between tau levels and the severity of patients' cognitive impairments (Arriagada, Growdon, Hedley‐Whyte, & Hyman, 1992; Dani, Edison, & Brooks, 2016; Giannakopoulos et al., 2003; Ingelsson et al., 2004, Nelson et al., 2012), the inability to measure tau has presented an impediment for studying the causes and progression of AD. Indeed, clinical‐pathologic studies suggest that an in vivo imaging measure of tau may be particularly informative because of the regional anatomic association of tau pathology with specific cognitive difficulties dependent in part on the compromised brain region (Smith et al., 2016).
New tau‐binding radioligands for positron emission tomography (PET) promise to enable in vivo imaging of tau accumulation (Dani et al., 2016; Villemagne, Fodero‐Tavoletti, Masters, & Rowe, 2015). A successful PET tau tracer holds the potential to serve as an invaluable biomarker for improving AD clinical diagnoses, evaluating response to tau‐focused treatments, and predicting disease progression. Here we focus on the compound 18F‐flortaucipir (Avid Radiopharmaceuticals), formerly 18F‐AV‐1451 and 18F‐T807 (Chien et al., 2013; Zhang et al., 2012). Autoradiography and in vitro studies have shown that 18F‐flortaucipir binds to paired helical filament forms of tau in the brains of autopsy‐confirmed AD patients (Marquié et al., 2015). Uptake is elevated in the hippocampi and medial temporal lobes of patients with amnestic AD and MCI (Chien et al., 2013), and the anatomical distribution of uptake parallels Braak's anatomical staging of AD pathology (Braak, Alafuzoff, Arzberger, Kretzschmar, & Del Tredici, 2006; Schwarz et al., 2016; Schöll et al., 2016).
As studies of 18F‐flortaucipir in typical, amnestic AD accrue, it is crucial to evaluate the tracer in less common dementia syndromes, characterized by different anatomical patterns of tau accumulation and by distinct patterns of cognitive impairment. Studies that focus on typical amnestic AD may be limited in their ability to discover neocortical correlates of patients' clinical symptoms; furthermore, PET studies of typical AD often include only assessments of global cognition and memory, thus neglecting potential neural correlates of other domain‐specific impairments commonly observed in AD. In contrast, non‐amnestic and early‐onset amnestic AD syndromes are marked by lower rates of hippocampal and medial temporal lobe atrophy than typical late‐onset amnestic AD, yet they have neocortical disease causing syndromes that may be confused with phenotypes due to non‐AD pathology (Mendez, Lee, Joshi, & Shapira, 2012; Murray et al., 2011; Whitwell et al., 2012). Furthermore, 18F‐flortaucipir binds differently to different tau isoforms (Lowe et al., 2016; Sander et al., 2016), raising the the possibility that the effectiveness of this radioligand will vary among heterogeneous atypical AD patients. The validity of 18F‐flortaucipir as an in vivo measure of tau will be supported by uptake patterns which mirror postmortem tau distributions in these phenotypes, and by statistical associations with patients' cognitive performance.
Few studies to date have included non‐amnestic AD cases in 18F‐flortaucipir imaging cohorts. Two recent studies (Ossenkoppele et al., 2016; Xia et al., 2017) have demonstrated anatomically distinct distributions of tracer uptake in amnestic and non‐amnestic AD patients. Xia et al. (2017) further demonstrated that tracer uptake was associated with cortical thickness, an established neuroimaging marker of disease. However, Xia et al. (2017) had insufficient power to examine associations with cognition. Ossenkoppele et al. (2016) addressed these associations with both voxelwise and region‐of‐interest (ROI) analyses, although their results indicated relatively modest associations with cognition: voxelwise analyses were presented at a liberal statistical threshold of p < .05 (uncorrected for multiple comparisons), and in ROI analyses of memory performance, the authors reported only a marginally‐significant association in the hippocampus. Both of these studies highlight the statistical challenges imposed by studying rare atypical AD phenotypes: the relative scarcity of such patients limits researchers' ability to detect clinically‐relevant associations between cognition and imaging markers.
Sparse and multivariate analysis methods can enhance sensitivity to imaging correlates of disease, particularly when the cognitive or clinical symptoms under investigation involve distributed brain networks (Avants et al., 2012, 2014a; Cook et al., 2014; McMillan et al., 2014). Similar methods have been applied in typical amnestic AD (Tosun et al., 2017) to detect areas of 18F‐flortaucipir uptake associated with florbetapir; to our knowledge, however, the present study is the first to apply sparse multivariate methods to the analysis of tau PET imaging in atypical AD. We used sparse regression to examine voxelwise associations between 18F‐flortaucipir uptake and cognitive performance in patients with early‐onset amnestic AD and two non‐amnestic AD syndromes: logopenic‐variant primary progressive aphasia (lvPPA) and posterior cortical atrophy (PCA). LvPPA is a neurodegenerative condition characterized by deficits in repetition and lexical access accompanied by atrophy in posterior temporal and inferior parietal cortices (Bonner, Ash, & Grossman, 2010; Gorno‐Tempini et al., 2004, 2011). Roughly 70% of lvPPA cases are attributable to an underlying AD pathology, and the remainder are associated with frontotemporal lobar degeneration (Giannini et al., 2017; Mesulam et al., 2014a, 2014b). PCA is a similarly progressive condition marked by primary deficits in vision and visuospatial processing, with an anatomical basis in occipital, occipito‐temporal, and parietal cortices (Crutch et al., 2012; Hof, Vogt, Bouras, & Morrison, 1997), most often due to AD pathology (Souza et al., 2011; Tang‐Wai et al., 2004). We predicted that 18F‐flortaucipir would bind specifically and differentially in amnestic and non‐amnestic AD phenotypes, and that tracer uptake would predict patients' cognitive symptoms in multiple domains of interest.
2. MATERIALS AND METHODS
2.1. Patient characteristics
We recruited patients with early‐onset amnestic or non‐amnestic (lvPPA or PCA) AD through the Penn Memory Center and the Cognitive Neurology Clinic at the Hospital of the University of Pennsylvania. Inclusion criteria included age of 45–70 years, a Mini‐Mental Status Exam (MMSE) score higher than 10, and the presence of a reliable informant to report on the patient's cognitive status and activities of daily living. Exclusion criteria for all patients included a history of other neurological or psychiatric conditions (including stroke and major depression), head trauma, substance abuse, pregnancy, and an abnormal EKG reading. Patients underwent medical and neurological examinations, cognitive testing, and magnetic resonance imaging (MRI), and structural MRIs were screened for evidence of significant vascular disease (e.g., stroke, other infarct or hemorrhage, or small‐vessel ischemic disease). One patient was excluded due to history of stroke, and a second was excluded due to an indeterminate clinical phenotype. A final total of 14 patients were included and classified according to their clinical presentation at the time of PET imaging. Of these, 4 lvPPA patients had hyperlipidemia, and 2 of the 4 additionally were hypertensive; 1 PCA patient had hyperlipidemia; 1 aAD patient had hypertension, and 1 aAD patient had hyperlipidemia. Geriatric Depression Scale (GDS) scores were available for 9/14 patients, collected at a median of 87.7 days (SD = 153.0 days) from the time of PET imaging, with a median total score of 2.0 (SD = 3.3). One patient reported a history of depression within the previous 2 years but was free of depression at the time of study. Informed consent was obtained from all patients or their caregivers as required by the Institutional Review Board of the University of Pennsylvania. All patients were diagnosed through clinical consensus by two or more board‐certified neurologists (including DW, DI, and MG). Additional information on patient symptoms was collected from caregivers through questionnaires and structured interviews. Total scores and performance on domain‐specific subscales of the Philadelphia Brief Assessment of Cognition (PBAC; Libon et al., 2011b) were used to inform clinical diagnoses. Two PCA patients and 1 aAD patient were left‐handed; all other patients were right‐handed.
Non‐amnestic phenotypes included logopenic‐variant primary progressive aphasia (lvPPA, n = 4, according to Gorno‐Tempini et al., 2011) and posterior cortical atrophy (PCA, n = 5; Crutch et al., 2012). LvPPA patients were evaluated for speech production deficits using the Cookie Theft description from the Boston Diagnostic Aphasia Examination (Ash et al., 2013; Goodglass & Kaplan, 1983; Goodglass, Kaplan, & Barresi, 2001); detailed results are presented in the Supporting Information. Diagnostic criteria for PCA included presence of objective deficits or subjective history of disturbances in visuospatial function, preserved language and episodic memory, and absence of other neurological or psychiatric conditions. Amnestic AD (aAD, n = 5) was diagnosed according to McKhann et al.'s (2011) criteria for probable AD. All five aAD patients had a disease onset by age 65. Two of 5 patients with aAD diagnoses at the time of this study (male, aged 62.6 years; female, aged 60.8 years) had previously presented with PCA before developing episodic memory deficits. Due to the early onset of disease and the initial appearance of non‐memory symptoms in 2 patients, the aAD group should not be considered representative of a typical AD presentation; however, we hypothesized that tau PET imaging results in cortical and subcortical areas related to episodic memory would be associated with their imaging results.
Because non‐amnestic AD can present as a result of frontotemporal lobar degeneration (FTLD) pathology, we required lvPPA and PCA patients to have a ratio of cerebrospinal fluid (CSF) T‐tau/Aβ greater than 0.34 as evidence of AD pathology; this measure effectively discriminates AD from normal cognition (area under the curve of 0.917; Shaw et al., 2009) and from FTLD (100% sensitivity and 90.9% specificity in an autopsy‐confirmed cross‐validation sample; Irwin et al., 2012). CSF results were unavailable for 2 aAD patients (female, aged 63.4 years; male, aged 69.5 years) who did not undergo lumbar punctures. Both patients had undergone 18F‐fluorodeoxyglucose PET imaging within 1 year previous to 18F‐flortaucipir imaging. Both scans were reviewed by attending radiologists and by neurologists from the Penn Memory Center (DW and Jason Karlawish, MD). Findings for the 63‐year‐old female noted decreased activity in posterior parietotemporal lobes with a leftward asymmetry; findings for the 69‐year‐old male included posterior hypometabolism with a rightward asymmetry. Both of these patients presented initially with an amnestic profile, and in both cases the clinical diagnosis of aAD was confirmed in a clinic visit approximately 4 months after PET imaging. One additional patient had a T‐tau/A‐beta ratio < 0.34, based on a lumbar puncture performed approximately 3 years prior to PET imaging. However, this patient had a CSF amyloid‐beta level of 115 pg/mL, which is well below the accepted threshold of 192 pg/mL for discriminating AD cases from controls (Shaw et al., 2009). In a follow‐up visit 26 months following PET imaging, this patient demonstrated impairment in episodic memory (delayed recall of 0/9 words on the PBAC) as well as impairment in language and visuospatial function, upholding the initial clinical diagnosis of an atypical AD presentation with multi‐domain impairment including episodic memory. Thus, all patients have a high probability of underlying AD pathology. See Table 1 and CSF biomarker methods for details.
Table 1.
Patient characteristics
| ID | Phenotype | Sex | Age | Disease duration | Education | MMSE | A‐beta | T‐tau/A‐beta |
|---|---|---|---|---|---|---|---|---|
| 1 | lvPPA | Female | 55.7 | 4.7 | 20 | 28 | 152 | 0.45 |
| 2 | lvPPA | Female | 63.9 | 8.0 | 18 | 26 | 152 | 0.40 |
| 3 | lvPPA | Male | 64.6 | 5.6 | 20 | 29 | 172 | 1.57 |
| 4 | lvPPA | Female | 69.5 | 2.5 | 13 | 24 | 118 | 1.61 |
| 63.4 (5.7) | 5.2 (2.3) | 17.8 (3.3) | 26.8 (2.2) | 148.5 (22.4) | 1.0 (0.7) | |||
| 5 | PCA | Male | 55.7 | 2.7 | 12 | 24 | 149 | 0.69 |
| 6 | PCA | Female | 57.2 | 5.2 | 17 | 25 | 183 | 0.53 |
| 7 | PCA | Female | 58.4 | 4.4 | 20 | 27 | 66 | 0.47 |
| 8 | PCA | Male | 58.7 | 5.7 | 16 | 14 | 204 | 0.44 |
| 9 | PCA | Female | 59.0 | 2.0 | 16 | 26 | 104 | 1.05 |
| 57.8 (1.4) | 4.0 (1.6) | 16.2 (2.9) | 23.2 (5.3) | 141.2 (56.5) | 0.6 (0.3) | |||
| 10 | aAD | Male | 53.7 | 2.7 | 18 | 22 | 113 | 0.35 |
| 11 | aAD | Female | 60.8 | 4.8 | 18 | 24 | 128 | 1.45 |
| 12 | aAD | Male | 62.6 | 3.6 | 18 | 21 | 115 | 0.20 |
| 13 | aAD | Female | 63.4 | 4.4 | 10 | 25 | — | — |
| 14 | aAD | Male | 69.5 | 4.5 | 16 | 24 | — | — |
| 62.0 (5.7) | 4.0 (0.8) | 16.0 (3.5) | 23.2 (1.6) | 118.7 (8.1) | 0.7 (0.7) |
Age, disease duration, and education are expressed in years. LvPPA: logopenic‐variant primary progressive aphasia; PCA: posterior cortical atrophy; aAD: amnestic AD; MMSE: Mini‐Mental Status Exam; A‐beta: CSF amyloid‐beta concentration (pg/mL); T‐tau/A‐beta: ratio of total tau and amyloid‐beta concentrations. Means and standard deviations for each phenotype are in bold face.
The three phenotypic groups (aAD, PCA, and lvPPA) did not differ in omnibus tests of age, disease duration, or education (all F < 1.9, p > .2). A Shapiro‐Wilk test of MMSE scores indicated a non‐normal distribution (W = 0.81, p < .01); accordingly, we used a non‐parametric Kruskal‐Wallis rank sum test to assess group differences in MMSE, which were non‐significant [H(2) = 2.6, p > .2]. Male/female ratios did not differ by group in a Pearson's chi‐squared frequency test [χ2(2) = 1.1, p > .7]. Overall, the patient sample was relatively highly educated and with relatively preserved performance on the MMSE; these characteristics of the cohort should be considered when generalizing to other samples.
2.2. Neuropsychological testing methods
Patients underwent a battery of cognitive assessments administered at a mean interval of 8 days (range 0–32) from the PET imaging session. Episodic memory was assessed by delayed recall and recognition discrimination on the Philadelphia Verbal Learning Test (Libon et al, 2011a), as well as total delayed recall of a modified version of the Rey Complex Figure obtained 90 s following presentation (Libon et al., 2011b). Language was assessed by patients' performance on a sentence repetition task, confrontation naming on a 30‐item version of the Boston Naming Test (BNT), semantic category fluency (animals), repetition from the MMSE (“no ifs, ands, or buts”), and forward digit span. Visuospatial function was assessed by copying of the Rey Complex Figure (total correct), as well as the object decision test of the Visual Object and Space Perception (VOSP) battery. Neuropsychological measures were converted to demographically‐adjusted z‐scores using published norms (Herrera‐Guzmán, Peña‐Casanova, Lara, Gudayol‐Ferré, & Böhm, 2004; Shirk et al., 2011) or cohorts from the Integrative Neurodegenerative Disease Database at the University of Pennsylvania (see Supporting Information). Adjusted scores were averaged within domain to create composite measures of language, memory, and visuospatial function.
2.3. CSF biomarker methods
Lumbar punctures were performed by board‐certified neurologists (MG and DI). Samples were processed in the University of Pennsylvania's Center for Neurodegenerative Disease Research (CNDR) using the Luminex xMAP system to produce measurements of total tau (T‐tau), phosphorylated tau181 (p‐tau181), and amyloid‐beta 1–42 (A‐beta).
2.4. Neuroimaging methods
Anatomical MRI data was collected for all patients at a mean interval of 76 days from the PET imaging session (range from 0 to 308 days; all but 2 patients were scanned within 6 months of PET imaging). MRI scans were collected on a 3‐Tesla Siemens TIM Trio scanner using an 8‐channel head coil, with a T1‐weighted anatomical imaging protocol with a repetition time of 1620 ms, echo time of 3.09 ms, inversion time of 950 ms, axial in‐plane resolution of 0.98 mm × 0.98 mm, and 1 mm slice thickness in a matrix of 192 × 256 × 160 voxels. Images were visually inspected for artifacts, then processed with an automated MRI processing pipeline based on Advanced Normalization Tools (ANTS, http://www.picsl.upenn.edu/ANTS/; Avants et al., 2011b, 2014b; Tustison et al., 2014). Images were corrected for intensity inhomogeneities using a version of the N3 algorithm (Sled, Zijdenbos, & Evans, 1998) with a modified optimization scheme and fast B‐spline approximation (Tustison et al., 2010). Next, a symmetric diffeomorphic algorithm (Avants et al., 2011a; Klein et al., 2009) was used to spatially align images to a local neurodegenerative disease template constructed from healthy and diseased elderly brains imaged with the same scanner and acquisition parameters as the current dataset. This template was constructed from T1‐weighted MRIs from 113 elderly controls and 94 neurodegenerative disease patients (AD, n = 23; amyotrophic lateral sclerosis, n = 14; corticobasal degeneration, n = 10; frontotemporal dementia, n = 25; Parkinson's disease, n = 14; and progressive supranuclear palsy, n = 8). Avants et al. (2011a) describes the template generation process. Images in the native acquisition space were automatically segmented into 6 tissue classes (cortical and subcortical gray matter, brainstem, cerebellum, white matter, and cerebrospinal fluid) informed by probability maps derived from the template brain (Avants et al., 2011a, 2011b; Pustina et al., 2016). Group analysis was performed by aligning patients' PET data and gray matter probability maps to the template space. A gray matter mask was created by thresholding cortical and subcortical gray matter probability maps in template space to exclude voxels with less than 0.3 probability of containing gray matter. This gray matter mask defined the set of voxels used both in sparse regression and ROI‐based analyses of PET data.
PET imaging was performed on a Philips Ingenuity TF PET/CT scanner at the PET Center in the Department of Radiology of the University of Pennsylvania. An intravenous injection of 370 mBq (10 mCi ± 10%) of 18F‐flortaucipir was administered to all patients, and they were imaged in 6 frames of 5 minutes each from the period 75–105 minutes post‐injection with 2 mm isotropic voxels in a 128 × 128 × 90 voxel matrix. PET data were corrected for signal attenuation, scatter, and patient head motion, then summed across the 6 acquisition frames. A rigid‐body alignment was computed to register native‐space PET images to each patient's accompanying T1 image. Partial volume correction was performed using the structural/functional synergy resolution recovery (SFS‐RR) method of Shidahara et al. (2009), which replaces high spatial frequencies in a static PET image with the corresponding frequencies in a high‐resolution structural brain image, with supervision from a probabilistic brain atlas and appropriate scaling to adjust for differences in signal magnitude between PET and structural imaging data. Two additional voxelwise partial‐volume correction methods, the reblurred Van‐Cittert and discrete iterative Yang approaches (Thomas et al., 2016; Tohka & Reilhac, 2008; Yang et al., 1996) implemented in the PETPVC package (https://github.com/UCL/PETPVC) yielded highly similar results to the SFS‐RR method (Supporting Information Figures S4–S8).
A reference region was defined by warping Diedrichsen et al.'s 2009, 2011) cerebellum atlas from Montreal Neurological Institute (MNI) space to each patient's native PET acquisition space. The tau signal was averaged over all cerebellar gray matter, except for the deep gray nuclei, to establish a patient‐specific uptake reference value; every voxel in the motion‐corrected, summed images was divided by this reference value to create a standardized uptake value ratio (SUVR) map for each patient. SUVR maps were aligned with each patient's T1 image and the template image by applying the previously computed image registrations; they were then spatially smoothed with an 8 mm full‐width‐half‐max Gaussian kernel. Regional SUVR values were obtained by computing average SUVR for each of 115 anatomical ROIs from the Mindboggle atlas (Klein & Tourville, 2012). Group analysis was performed by applying the previously‐computed spatial transformations to warp each patient's smoothed SUVR map to the local template space. Between‐group uptake differences were investigated using voxelwise 2‐sample t‐tests; due to the small sample sizes available for each phenotype, we used a liberal statistical threshold of p < .01, uncorrected for multiple comparisons, and a voxel clustering threshold of 100 μL. This cluster size corresponds to 100 voxels in the template space and 12.5 voxels in the PET acquisition space. All results were subsequently warped to the MNI152 template space (Jenkinson, Beckmann, Behrens, Woolrich, & Smith, 2012) for visualization, and stereotactic coordinates are reported in this space throughout the manuscript.
Associations between cognition and tracer uptake were assessed with sparse regression, using the algorithm described by Kandel, Wolk, Gee, and Avants, (2013). Sparse analysis methods are effective for datasets in which the number of predictor variables (i.e., voxels) greatly exceeds the number of observations (i.e., patients), making it challenging to determine a unique set of predictors, and increasing the risk of overfitting a statistical model. Sparse methods apply a penalty (in this case, an ℓ1 parameter) to exclude predictors that have only weak associations with the outcome variable; the final model solution consists of one or more eigenvectors, or sets of covarying voxels which optimally predict the outcome variable. In the approach of Kandel et al. (2013), the eigenvector solution is subject to a minimum cluster size threshold, which helps to ensure that voxels in the solution are clustered in an anatomically‐plausible manner; as well as a sparsity parameter, which determines the maximum proportion of voxels with non‐zero coefficients (and thus prevents the algorithm from using all available voxels to overfit a model). Sparsity and cluster size parameters were chosen by determining which combination of values produced the lowest prediction error for modeling patients' age, which was uncorrelated with the cognitive predictors of interest. On this basis, a sparsity of 0.001 and cluster threshold of 100 μL were chosen for modeling patients' language, visuospatial, and memory performance.
Input data for each model consisted of whole‐brain SUVR values converted to an n × m data matrix, where n = the number of participants and m = the number of voxels in the gray matter mask, as well as the n × 1 vector of cognitive scores. The sparse decomposition was initialized by conducting a voxelwise correlation of SUVR data with the cognitive variable of interest, then separating this correlation map into positive and negative components. The solution for each model thus consisted of two m × 1 eigenvectors, respectively comprising voxels that were positively or negatively associated with the predictor variable. Because we hypothesized an inverse association between cognition and 18F‐flortaucipir uptake, only the negatively‐weighted eigenvectors were analyzed. Results for positively‐weighted eigenvectors are presented in the Supporting Information. Significance of the eigenvector solution at a threshold of p < .05 was empirically determined by permuting case labels 25 times per model; at each stage of permutation, we allowed 10 iterations for the decomposition algorithm to converge. The SUVR data matrix was then multiplied by each eigenvector to yield a prediction of patient's cognitive performance, and we calculated a Pearson's correlation coefficient between this prediction and the observed cognitive score. These sparse regression models were compared to cognitive predictions based on anatomical ROIs by ranking R2 values. ROI‐based models used an unweighted average of SUVR values over the voxels in each ROI in order to predict cognitive outcomes. Eigenvectors were compared to ROIs with both positive and negative associations between SUVR and cognition; positively‐associated ROIs were included to allow the possibility that these regions might more accurately predict cognition than eigenvector‐based models, even if the direction of association between uptake and cognition was contrary to the hypothesized direction.
2.5. Hypotheses and predictions
On episodic memory tasks, aAD patients were expected to perform worse than both PCA and lvPPA patients. LvPPA patients were expected to demonstrate worse language performance than the other two patient groups. Similarly, we predicted PCA patients would perform worse on visuospatial tasks than lvPPA patients and aAD patients. Based on published criteria for imaging‐assisted diagnosis of lvPPA (Gorno‐Tempini et al., 2004, 2011), we predicted that lvPPA patients would have elevated tau uptake in language areas, including left‐hemisphere posterior temporal, inferior parietal, and inferior frontal cortices; furthermore, we predicted that language task performance across all phenotypes would be negatively associated with SUVR in these regions. Additionally, we predicted that PCA patients would have elevated SUVR in visual association cortices including posterior parietal and ventral visual cortices, and that visuospatial task performance would be negatively associated with SUVR in these areas. We predicted that aAD patients would have peak SUVR in the hippocampus, medial temporal lobes, and precuneus; and that SUVR in these regions would be negatively associated with episodic memory measures across patient groups. Finally, we predicted that predictions based on sparse decomposition of 18F‐flortaucipir uptake would be comparable to or superior than those based on anatomical ROIs for modeling patients' cognitive performance.
3. RESULTS
3.1. Domain‐specific cognitive differences
Patients' cognition was marked by domain‐specific cognitive deficits associated with their clinical phenotypes (Table 2). As predicted, lvPPA patients had the lowest mean language score, followed by PCA and aAD patients. The mean visuospatial score was lowest for PCA patients, followed by aAD and lvPPA patients. Memory scores were lowest for the aAD group, followed by PCA and lvPPA patients. Memory and visuospatial scores were positively correlated (R = 0.64; 95% confidence interval = 0.16–0.87; p < .05). Language scores were not significantly associated with either memory (R = −0.47; 95% c.i. = −0.80–0.08; p < .1) or visuospatial function (R = −0.45; 95% c.i. = −0.79–0.10; p < .11).
Table 2.
Cognitive performance by phenotype
| Phenotype | Memory | Language | Visuospatial Function |
|---|---|---|---|
| lvPPA | 2.8 (1.4) | −1.8 (0.1) | 0.3 (0.7) |
| PCA | 0.3 (1.5) | −0.4 (0.8) | −2.6 (1.5) |
| aAD | −1.5 (0.7) | −0.2 (0.5) | −2.0 (1.3) |
Numbers indicate means for each domain‐specific composite score; standard deviations are given in parentheses. aAD: amnestic AD; lvPPA: logopenic‐variant primary progressive aphasia; PCA: posterior cortical atrophy.
3.2. Regional tau accumulation by phenotype
Group‐average SUVR maps (Figure 1) revealed differential uptake of 18F‐flortaucipir in brain areas associated with each group's distinct phenotype and profile of cognitive impairment. In the lvPPA group uptake was heavily left lateralized, with foci in the left superior and middle temporal gyri, left precuneus, and bilateral supramarginal gyri (Table 3). The PCA group exhibited the most extensive pattern of uptake among the three groups, with peaks throughout bilateral medial parietal and posterior occipito‐temporal areas. Uptake in the aAD group was similar to that of the PCA group, with peak uptake in left precuneus and posterior cingulate; right posterior superior temporal and inferior parietal areas; and bilateral middle temporal areas. The results of voxelwise between‐group t‐tests are shown in Figure 2. LvPPA patients had greater uptake than aAD patients in the left middle, inferior, and anterior superior temporal gyri. The greatest uptake difference between lvPPA and aAD was observed at x = −47, y = −47, z = −28 (Table 4); a secondary peak was observed in the anterior portion of the left superior temporal gyrus at x = −54, y = 8, z = −1. Relative to lvPPA patients, aAD patients had greater uptake in the right fusiform, parahippocampal, and postcentral gyri as well as the right inferior parietal lobule and precuneus. LvPPA patients had higher SUVRs than PCA patients in anterior temporal areas (e.g., x = −57, y = 7, z = −22), as well as in several foci throughout anterior inferior, middle, and superior temporal gyri. PCA patients had greater uptake than lvPPA patients in the right precuneus; superior frontal, middle frontal, precentral, and middle temporal gyri; and inferior parietal lobule. Differences between aAD and PCA patients' uptake included the left postcentral and middle frontal gyri; several foci in left posterior temporal/inferior parietal cortex; and right precentral gyrus, where PCA patients exhibited greater mean uptake. No areas in which aAD patients had greater uptake than PCA patients were detected. Because two aAD patients had previously presented with a PCA syndrome, we performed an alternative group contrast (not shown) in which these patients were grouped with the PCA patients. The results of this contrast did not qualitatively differ from those shown in Figure 2, with greater tracer uptake for the PCA patients in the left inferior parietal lobule and angular gyrus.
Figure 1.
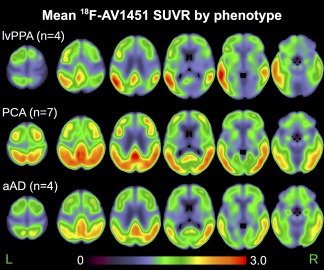
Average 18F‐flortaucipir standardized uptake value ratio (SUVR) for each phenotype. Uptake is expressed as a ratio of each voxel relative to average cerebellar gray matter uptake. aAD: amnestic AD; lvPPA: logopenic‐variant primary progressive aphasia; PCA: posterior cortical atrophy [Color figure can be viewed at http://wileyonlinelibrary.com]
Table 3.
Coordinates of local maxima for the group‐average standardized uptake volume ratio (SUVR) maps in Figure 1
| Phenotype | Label | X | Y | Z | SUVR |
|---|---|---|---|---|---|
| lvPPA | L middle temporal (BA 21) | −59 | −42 | −2 | 3.05 |
| L superior temporal (BA 39) | −50 | −61 | 22 | 3.05 | |
| L supramarginal (BA 40) | −55 | −53 | 28 | 2.96 | |
| L middle temporal (BA 21) | −61 | −29 | −12 | 2.85 | |
| L middle temporal (BA 37) | −52 | −64 | 1 | 2.66 | |
| L middle temporal (BA 37) | −48 | −68 | 10 | 2.60 | |
| L precuneus (BA 31) | −2 | −47 | 35 | 2.60 | |
| L middle temporal (BA 37) | −52 | −61 | −8 | 2.58 | |
| L superior temporal (BA 21) | −58 | −14 | −7 | 2.57 | |
| R supramarginal (BA 40) | 56 | −50 | 22 | 2.46 | |
| PCA | L cingulate (BA 31) | −1 | −48 | 32 | 3.06 |
| R supramarginal (BA 40) | 56 | −50 | 24 | 2.81 | |
| R inferior temporal (BA 37) | 48 | −66 | −1 | 2.77 | |
| R middle temporal (BA 37) | 48 | −66 | 13 | 2.73 | |
| R precuneus (BA 19) | 34 | −64 | 43 | 2.72 | |
| R middle occipital (BA 19) | 37 | −83 | 7 | 2.69 | |
| L precuneus (BA 7) | −10 | −69 | 48 | 2.69 | |
| R precuneus (BA 39) | 42 | −69 | 37 | 2.69 | |
| L cingulate (BA 31) | −1 | −28 | 38 | 2.69 | |
| L superior temporal (BA 39) | −52 | −56 | 12 | 2.68 | |
| aAD | L cingulate (BA 31) | 0 | −40 | 36 | 2.62 |
| R supramarginal (BA 40) | 55 | −52 | 30 | 2.61 | |
| R superior temporal (BA 22) | 51 | −59 | 17 | 2.56 | |
| L precuneus (BA 31) | −5 | −49 | 35 | 2.55 | |
| L cingulate (BA 31) | −1 | −28 | 38 | 2.48 | |
| R middle occipital (BA 19) | 39 | −76 | 23 | 2.45 | |
| L posterior cingulate (BA 23) | −4 | −58 | 24 | 2.43 | |
| R angular (BA 39) | 40 | −61 | 41 | 2.38 | |
| R middle temporal (BA 22) | 60 | −47 | 2 | 2.35 | |
| L middle temporal (BA 39) | −50 | −57 | 14 | 2.34 |
Up to the top 10 coordinates are displayed for each phenotype. All coordinates are in Montreal Neurological Institute (MNI) template space.
Figure 2.
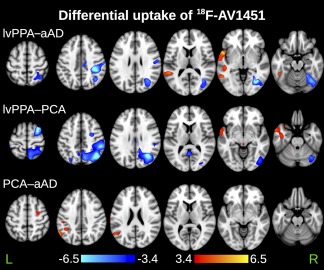
Between‐group differences in 18F‐flortaucipir standardized uptake value ratio (SUVR). Maps represent the results of voxelwise two‐sample t‐tests unadjusted for demographic factors. All maps are thresholded at p < .01 (uncorrected for multiple comparisons) with a cluster volume threshold of 100 μL. Orange‐to‐yellow values indicate higher SUVRs for the first group than the second; dark‐to‐light‐blue values indicate higher SUVRs for the second group than the first [Color figure can be viewed at http://wileyonlinelibrary.com]
Table 4.
Peak t‐statistics (local maxima and minima) from voxelwise contrasts of SUVR maps in Figure 2
| Contrast | Label | X | Y | Z | T‐statistic |
|---|---|---|---|---|---|
| lvPPA > aAD | L inferior temporal | −47 | −47 | −28 | 7.5 |
| L superior temporal (BA 22) | −54 | 8 | −1 | 6.5 | |
| L middle temporal (BA 22) | −52 | −43 | 7 | 5.1 | |
| L middle temporal (BA 37) | −54 | −53 | −4 | 4.8 | |
| L superior temporal (BA 13) | −54 | −41 | 18 | 4.7 | |
| L middle temporal (BA 21) | −48 | −31 | −1 | 4.5 | |
| L inferior temporal (BA 37) | −48 | −46 | −17 | 4.5 | |
| L superior temporal (BA 22) | −59 | −5 | −5 | 4.3 | |
| L superior temporal (BA 22) | −67 | −46 | 17 | 4.3 | |
| L superior temporal (BA 22) | −66 | −11 | 2 | 4.0 | |
| aAD > lvPPA | R inferior parietal lobule (BA 40) | 42 | −37 | 46 | −8.6 |
| R fusiform (BA 37) | 37 | −67 | −9 | −8.4 | |
| R postcentral (BA 2) | 34 | −31 | 43 | −7.8 | |
| R angular (BA 39) | 34 | −63 | 35 | −6.2 | |
| R parahippocampal (BA 19) | 33 | −55 | −7 | −6.1 | |
| R paracentral lobule (BA 6) | 8 | −24 | 54 | −5.9 | |
| R postcentral (BA 2) | 58 | −19 | 36 | −5.4 | |
| R fusiform (BA 37) | 27 | −51 | −19 | −5.3 | |
| R cingulate (BA 24) | 7 | −20 | 38 | −5.2 | |
| R middle occipital (BA 37) | 40 | −64 | 1 | −5.2 | |
| lvPPA > PCA | L middle temporal (BA 21) | −57 | 7 | −22 | −5.0 |
| L superior temporal (BA 22) | −59 | 6 | −2 | −4.7 | |
| L middle temporal (BA 21) | −42 | −8 | −38 | −4.5 | |
| L inferior frontal (BA 47) | −32 | 15 | −23 | −4.1 | |
| L superior temporal (BA 38) | −47 | 6 | −17 | −3.3 | |
| L middle temporal (BA 21) | −67 | −11 | −17 | −2.9 | |
| PCA > lvPPA | R middle temporal (BA 39) | 35 | −63 | 31 | 11.0 |
| R precuneus (BA 39) | 38 | −62 | 41 | 10.9 | |
| R inferior parietal lobule (BA 40) | 53 | −37 | 41 | 8.0 | |
| R superior frontal (BA 6) | 28 | 5 | 67 | 8.0 | |
| R precuneus (BA 7) | 9 | −71 | 56 | 6.5 | |
| R middle temporal (BA 39) | 42 | −72 | 34 | 5.6 | |
| R middle frontal (BA 6) | 40 | 3 | 61 | 5.5 | |
| R precentral (BA 6) | 31 | −7 | 53 | 5.2 | |
| L inferior temporal | −2 | −57 | 5 | 5.1 | |
| R precuneus (BA 7) | 19 | −68 | 37 | 5.0 | |
| PCA > aAD | L supramarginal (BA 40) | −61 | −55 | 37 | 6.2 |
| L superior temporal (BA 39) | −60 | −62 | 27 | 4.7 | |
| L supramarginal (BA 40) | −41 | −48 | 37 | 4.4 | |
| L postcentral (BA 43) | −67 | −17 | 21 | 4.1 | |
| R precentral (BA 6) | 30 | −4 | 53 | 3.9 | |
| L middle frontal (BA 6) | −33 | 6 | 65 | 3.9 | |
| L middle temporal (BA 39) | −47 | −66 | 26 | 3.8 | |
| L inferior parietal lobule (BA 40) | −53 | −30 | 41 | 3.6 | |
| L inferior parietal lobule (BA 40) | −58 | −32 | 51 | 3.5 | |
| L inferior parietal lobule (BA 40) | −49 | −35 | 59 | 3.1 |
Up to the top 10 coordinates are shown for each directional contrast. All coordinates are in Montreal Neurological Institute (MNI) template space.
Mean SUVR in the hippocampus, averaged across hemispheres, was 1.38 (0.16) for lvPPA patients, 1.32 (0.07) for PCA patients, and 1.41 (0.14) for aAD patients. In entorhinal cortex, mean SUVRs were 1.23 (0.22) for lvPPA patients, 1.19 (0.09) for PCA patients, and 1.26 (0.10) for aAD patients. One‐way analyses of variance on these data suggested no group differences in uptake for these regions [both F(2,11) < 0.6, p > .5]. To address concerns that hippocampal signal might be confounded with proximal areas of off‐target binding, we compared the correlation of hippocampal SUVR with SUVR in both putative off‐target (caudate nucleus, pallidum, putamen, thalamus, and brainstem) and on‐target regions. Significant correlations for both proximal and distal regions were expected from this series of tests, due to common inter‐subject effects throughout the brain; accordingly, correlations were corrected for multiple comparisons using Holm's procedure (Hochberg & Benjamini, 1990). Choroid plexus and substantia nigra labels were not present in the Mindboggle label atlas employed here. No off‐target regions were significantly associated with the left hippocampus: the highest such correlation was for left putamen (R = 0.72, p > .8). In contrast, left hippocampal SUVRs were most highly correlated with the left basal forebrain (R = 0.88, p < .01). Similarly, the strongest off‐target correlation with the right hippocampus, the right globus pallidus, was non‐significant after multiple comparisons correction (R = .79, p > .1); and the right hippocampus was most highly correlated with right basal forebrain (R = 0.90, p < .01). Although the size of the current dataset limited us from validating these results in an independent patient cohort, we compared regional SUVR values to gray matter atrophy estimated from structural MRIs in a non‐overlapping sample of atypical AD patients (Supporting Information, section 7, “Correspondence between 18F‐flortaucipir uptake and gray matter atrophy”). These results indicated that in each phenotype, elevated regional SUVR predicted reduced gray matter volume in an independent patient cohort of the same phenotype (Supporting Information Figure S11).
3.3. Sparse regression results
Sparse regression models yielded 3 spatial components (eigenvectors) associated with patients' language, visuospatial, and memory performance (Figure 3). Language performance was associated with voxels in the anterior portion of the left superior temporal gyrus; the coordinates of peak loadings on this eigenvector are given in Table 5. Visuospatial performance was associated with a cluster in the right lingual gyrus. In the memory domain, the associated eigenvector included portions of right inferior temporal gyrus, cuneus, hippocampus, and amygdala. Mean SUVRs by phenotype are shown for each of these 3 eigenvectors in Figure 4. An analysis of variance (ANOVA) with factors of cognitive domain and phenotype as well as their interaction was performed on patients' mean SUVRs across voxels in each sparse eigenvector. This test yielded marginally significant main effects of domain [F(2,33) = 2.7, p < .08] and phenotype [F(2,33) = 2.7, p < .09] and a significant interaction [F(4,33) = 6.6, p < .001]. We thus assessed between‐group differences for each cognitive domain. To maximize statistical power in the small patient sample, each group was contrasted with the combined means of the other two groups. All tests assumed unequal variance between groups; degrees of freedom were accordingly adjusted for heteroscedasticity. For the language‐related eigenvector, aAD patients had marginally lower uptake than other patients [t(12) = −2.0, p < .08], and lvPPA patients had significantly higher uptake [t(4) = 3.6, p < .050]. For the visuospatial‐related eigenvector, lvPPA patients had lower SUVRs than the aAD and PCA patients combined [t(10) = −4.0, p < .005). For the memory‐related eigenvector, aAD patients' SUVRs were significantly higher than the combined lvPPA and PCA group [t(10) = 2.6, p < .05].
Figure 3.
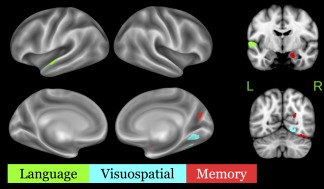
Sparse eigenvector loadings for regressions of gray‐matter SUVR on memory (red), language (green), and visuospatial (cyan) scores. All loadings are negative, corresponding to the hypothesized inverse relationship between SUVR and cognitive performance [Color figure can be viewed at http://wileyonlinelibrary.com]
Table 5.
Coordinates of peak eigenvector loadings (local minima) for sparse regression models of language, visuospatial, and memory performance
| Domain | Label | X | Y | Z | Loading |
|---|---|---|---|---|---|
| Language | L superior temporal (BA 22) | −56 | −5 | 2 | −0.002 |
| L superior temporal (BA 22) | −58 | −15 | 3 | −0.001 | |
| Visuospatial | R lingual (BA 19) | 22 | −55 | −9 | −0.001 |
| Memory | R hippocampus/amygdala | 20 | −5 | −20 | −0.005 |
| R fusiform (BA 37) | 37 | −63 | −19 | −0.003 | |
| R cuneus (BA 18) | 24 | −64 | 20 | −0.001 |
All coordinates are in Montreal Neurological Institute (MNI) template space.
Figure 4.
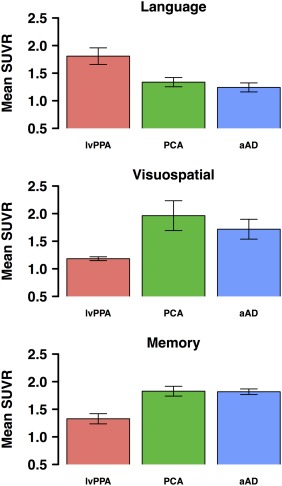
Mean SUVR values within each eigenvector. Higher values correspond to higher 18F‐flortaucipir SUVRs and lower estimated cognitive scores, i.e., a hypothesized inverse association between SUVR and cognition. Error bars indicate standard error of the mean for aAD (n = 5), lvPPA (n = 4), and PCA (n = 5) patients [Color figure can be viewed at http://wileyonlinelibrary.com]
SUVR data projected onto these three eigenvectors provided more accurate models of patients' cognitive scores than predictions based on anatomical ROIs (Figures 5 & 6). Projections on the language eigenvector were significantly correlated with language scores (R = 0.82; 95% c.i.: 0.50–0.94; p < .001); by comparison, the best ROI‐based prediction (Table 6) was produced by the left superior temporal gyrus, with a correlation of R = 0.75 (p < .005); this region was thus highly overlapping with the sparse regression solution. Of the three domains, visuospatial model projections were most closely associated with observed scores (R = 0.92; 95% c.i.=0.76–0.97; p < .001). The best ROI‐based prediction of visuospatial performance was based on another right‐hemisphere visual region, the calcarine cortex (R = 0.92, p < .001). The second‐best ROI‐based predictor of visuospatial performance overlapped with the sparse eigenvector: the right lingual gyrus had a correlation of R = 0.88, p < .001. Observed memory scores had a correlation with sparse regression‐based predictions of R = 0.75 (95% confidence interval: 0.37–0.92; p < .01). In contrast, predictions based on mean uptake in hippocampus and entorhinal cortex were both non‐significant (R = −0.08 and R = −0.15, respectively, both p > .5). The best ROI‐based prediction was from the left caudate nucleus, where SUVR was positively associated with cognition, contrary to hypotheses (R = 0.63, p < .05). The left caudate nucleus was also included in the positively‐weighted memory eigenvector (Supporting Information Figure S7); however, as striatal binding of 18F‐flortaucipir is thought to represent off‐target binding possibly related to mineralization or pigmentation effects (Lowe et al., 2016), this result is not likely to reflect a true association between regional tau and cognitive function. Memory‐ and language‐related associations with brainstem SUVR (Table 6) are also likely to reflect such off‐target binding effects. The best prediction of memory scores from ROIs where SUVR showed a hypothesized negative association with cognition came from the right amygdala, although this association was only marginally significant (R = 0.52, p < .06). Across cognitive domains, sparse regression solutions thus consistently exceeded ROI‐based predictions. Patient age was not associated with any of the three eigenvectors (all p > .3).
Figure 5.
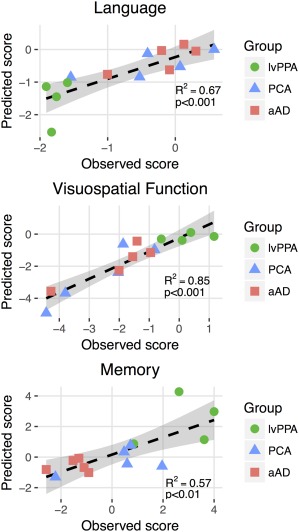
Prediction of domain‐specific cognitive performance from PET‐tau imaging data. For each cognitive domain, observed scores are plotted on the x‐axis. The y‐axis represents cognitive score predictions, calculated by projecting SUVR data onto the sparse eigenvector for each domain [Color figure can be viewed at http://wileyonlinelibrary.com]
Figure 6.
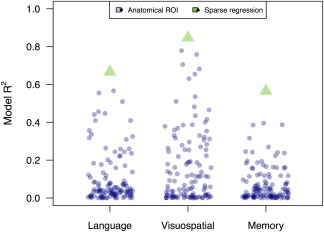
Comparing regression results from sparse decomposition and anatomical ROI‐based analyses of tau PET data. Each blue circle represents an R 2 value for the regression of SUVR in an anatomical ROI on patients' cognitive scores. Each green triangle represents the R 2 value for the corresponding sparse regression model [Color figure can be viewed at http://wileyonlinelibrary.com]
Table 6.
Anatomical ROIs that best model cognition in each domain
| Domain | ROI | R 2 |
|---|---|---|
| Language | Left inferior temporal gyrus | 0.32 |
| Brain stem | 0.33 | |
| Right superior parietal lobule | 0.34 | |
| Left transverse temporal gyrus | 0.36 | |
| Left planum temporale | 0.41 | |
| Right precuneus | 0.41 | |
| Right supramarginal gyrus | 0.44 | |
| Right middle occipital gyrus | 0.45 | |
| Left middle temporal gyrus | 0.46 | |
| Right angular gyrus | 0.51 | |
| Left planum polare | 0.56 | |
| Left superior temporal gyrus | 0.57 | |
| Visuospatial | Right postcentral gyrus | 0.42 |
| Right precuneus | 0.44 | |
| Right inferior occipital gyrus | 0.47 | |
| Right occipital pole | 0.48 | |
| Left occipital pole | 0.51 | |
| Left lingual gyrus | 0.54 | |
| Left cuneus | 0.63 | |
| Right occipital fusiform gyrus | 0.65 | |
| Left calcarine cortex | 0.68 | |
| Right cuneus | 0.71 | |
| Right lingual gyrus | 0.76 | |
| Right calcarine cortex | 0.78 | |
| Memory | Right cuneus | 0.19 |
| Right calcarine cortex | 0.20 | |
| Right lingual gyrus | 0.22 | |
| Left inferior temporal gyrus | 0.24 | |
| Right occipital fusiform gyrus | 0.24 | |
| Brain stem | 0.24 | |
| Left angular gyrus | 0.25 | |
| Right amygdala | 0.27 | |
| Left planum polare | 0.32 | |
| Left middle temporal gyrus | 0.39 | |
| Left superior temporal gyrus | 0.39 | |
| Left caudate | 0.40 |
In each domain, ROIs corresponding to the top‐performing decile of regression models are shown, based on model R 2.
4. DISCUSSION
In the current study, we assessed 18F‐flortaucipir uptake in AD‐related phenotypes with distinct anatomical disease distributions, as well as the tracer's ability to predict patients' cognitive performance. Patterns of uptake differed between lvPPA, PCA, and amnestic AD. Furthermore, sparse regression of PET data revealed distinct cortical areas where uptake patterns predicted patients' language, visuospatial, and memory performance, demonstrating that 18F‐flortaucipir predicts the functional consequences of each disease phenotype. The sparse decomposition approach provided comparable or superior modeling of cognition to anatomically‐defined ROIs, which are commonly employed as units of analysis in research and clinical settings. These initial results support the promise of 18F‐flortaucipir as an in vivo measure of tau accumulation for both amnestic and non‐amnestic variants of AD and suggest that sparse decomposition of 18F‐flortaucipir data is useful for modeling patients' cognition.
4.1. Spatial distribution of 18F‐flortaucipir uptake
SUVR maps showed differences in uptake in amnestic AD and two non‐amnestic phenotypes, lvPPA and PCA (Figures 1 & 2). LvPPA patients had left‐lateralized uptake focused in the posterior temporal and inferior parietal lobes, precuneus, and prefrontal cortex. These findings mirror the results of postmortem studies of lvPPA due to AD, which have reported focal neuronal loss in Brodmann areas 22 and 40 (Leyton, Britton, Hodges, Halliday, & Kril, 2016); as well as neurofibrillary tau in the left superior temporal, middle temporal, inferior frontal, and middle frontal gyri (Mesulam et al., 2014b). LvPPA due to AD is characterized by greater accumulation of pathology in superior temporal cortex than in lvPPA cases with non‐AD pathology (Giannini et al., 2017). The superior and middle temporal gyri have been proposed as components of a ventral language pathway involved in a number of speech‐related functions (Friederici & Gierhan, 2013), including repetition (Dehaene‐Lambertz et al., 2006), which is significantly impaired in lvPPA (Gorno‐Tempini et al., 2008, 2011). This behavioral association has been validated outside the context of AD: Leff et al. (2009) found that in stroke patients, a broad extent of superior temporal cortex was associated with forward digit span, which is more severely impaired in patients with lvPPA due to AD than lvPPA due to FTLD pathology. Furthermore, in a longitudinal study of lvPPA patients, atrophy in the left posterior temporal and parietal cortices was accompanied by decrements not only in the repetition and comprehension of whole sentences, but also of single words (Rohrer et al., 2013). Published criteria for imaging‐assisted diagnosis of lvPPA thus highlight atrophy in posterior temporal and inferior parietal cortices as the anatomical signature of lvPPA (Gorno‐Tempini et al., 2011). In right hemisphere parietal, occipital, and posterior temporal areas, lvPPA patients had less uptake than PCA and aAD patients, consistent with the left‐hemisphere lateralization of disease in this syndrome. LvPPA patients also had notably low uptake in early visual areas, combined with normal performance on visuospatial tasks.
Of the three phenotypes, PCA patients appeared to have the highest and most widespread uptake throughout the neocortex. This pattern was centered around posterior lateral and medial parietal and occipital cortices. These findings are thus consistent with postmortem examinations of patients with PCA due to AD, which reveal dense neurofibrillary tangles (Tang‐Wai et al., 2004) and gliosis (Tom, Cummings, & Pollak, 1998) in occipital cortex. These same areas demonstrate hypoperfusion (Kas et al., 2011) and atrophy in neuroimaging studies (Whitwell et al., 2007). Tracer uptake was elevated in portions of both the ventral and dorsal visual streams, which are both affected in PCA (McMonagle et al., 2006), leading to symptoms that can involve both basic and complex visuospatial function (Crutch et al., 2012).
In aAD cases, the anatomical distribution of uptake was similar to that reported by Schwarz et al. (2016), with peak uptake in the precuneus, lateral parietal cortices, and occipito‐temporal cortex. In contrast to the older AD patients studied by Schwarz and colleagues, however, aAD patients in the current study had relatively lower tracer uptake in the hippocampus and MTL. This finding is consistent with relative sparing of the hippocampus and MTL from tau pathology in early‐onset AD (Whitwell et al., 2012). In the neocortex, aAD patients' uptake patterns (Figure 1) recapitulated postmortem studies of aAD, which report that neurofibrillary tau accumulates more densely in parietal and occipito‐temporal association cortices than in primary visual, motor, and somatosensory cortices (Arnold et al., 1991; Braak et al., 2006). Disease in temporal, occipital, and parietal cortices is common in more advanced stages of amnestic AD (Braak et al., 2006, Dickerson et al., 2009), resulting in visuospatial and visuoconstructional deficits (Gross et al., 2012; Heindel, Festa, Ott, Landy, & Salmon, 2013; Libon, Swenson, Barnoski, & Sands, 1993) as well as language deficits (Ahmed, Haigh, de Jager, & Garrard, 2013; Verma & Howard, 2012). The overall similarity of tracer uptake between the PCA and aAD groups may be due in part to the fact that two aAD patients had previously presented with PCA. However, when we assigned these patients to the PCA group and re‐analyzed their SUVR data, mean uptake patterns in the PCA and aAD groups remained highly similar. The current results are consistent with previous work showing that early‐onset amnestic AD cases have elevated 18F‐flortaucipir uptake in parietal‐occipital cortex (Cho et al., 2017), one of the principal areas affected by disease in PCA.
The current results thus provide converging evidence for distinct anatomical distributions of tau across atypical AD phenotypes and are broadly similar to recent studies examining 18F‐flortaucipir uptake in atypical AD (Ossenkoppele et al., 2016; Xia et al., 2017). These results emphasize the distinct nature of non‐amnestic variants of AD, and the important role of apparent tau pathology in determining patient phenotype. Indeed, these patterns of tau uptake during life reflect the regional pathological burden of tau seen at autopsy in non‐amnestic variants of AD (Gefen et al., 2012; Giannini et al., 2017; Whitwell et al., 2012). Although we have demonstrated phenotypic differences in uptake, more research is needed to establish and confirm clinically significant uptake thresholds for this tracer. It will be particularly interesting to determine anatomical markers where tracer uptake optimally distinguishes between PCA and early‐onset amnestic AD patients.
4.2. Tau PET associations with cognition
We used sparse regression models to identify areas of uptake associated with patients' cognitive performance. The current analysis identified anatomically distinct correlates of language, visuospatial, and memory performance, and the three phenotypes demonstrated significant uptake differences within these regions. Language performance was best predicted by uptake in the anterior portion of the left superior temporal gyrus, which accounted for 67% of the variance in patients' scores. These results are consistent with previous 18F‐flortaucipir studies reporting strong laterality in uptake for lvPPA patients (Ossenkoppele et al., 2016; Pascual & Masdeu, 2016), reflecting a disease distribution that selectively affects a left‐lateralized language processing network (Price, 2010).
We note that lvPPA patients' peak uptake was not in the anterior temporal location occupied by the language‐related eigenvector. Rather, peak uptake occurred in more posterior regions of the superior and middle temporal gyri (see Figure 1 and Table 3), which are commonly reported in neuroimaging studies of lvPPA (Gorno‐Tempini et al., 2004, 2011; Grossman, 2010). Because all three phenotypes had widespread uptake in more posterior portions of temporal cortex, it is possible that this region was not an effective marker for predicting individual and phenotypic differences in patients' language performance. In contrast, lvPPA patients had elevated SUVR in the left anterior superior temporal eigenvector (Figure 4). Pathology in this area may have incrementally worsened lvPPA patients' language performance. Indeed, left anterior temporal lobe atrophy in Alzheimer's disease has been associated with deficits on the Boston Naming Test (Domoto‐Reilly, Sapolsky, Brickhouse, & Dickerson, 2012; Grossman et al., 2004), which was included in our composite language score. However, we note that the language‐related eigenvector was located posterior to regions associated with semantic memory deficits in semantic‐variant primary progressive aphasia (Patterson et al., 2007) and did not comprise ventral anterior temporal cortex, which has been associated with high‐order perceptual and conceptual processing (Harry, Umla‐Runge, Lawrence, Graham, & Downing, 2016, Wright, Randall, Clarke, & Tyler, 2015). This result differs from voxelwise regressions reported by Ossenkoppele et al. (2016), in which language performance appeared to be most strongly associated with the left temporal pole. Overall, results suggest that the precise focus of disease in the anterior temporal lobe may be useful in differentiating between lvPPA due to different underlying pathologies or discriminating different primary progressive aphasias. Such discrimination analyses may be additionally affected by 18F‐flortaucipir's differential affinity for 3‐ and 4‐repeat isoforms of tau (Marquié et al., 2015; Sander et al., 2016). We note that patients in the current study were right‐handed, with the exception of 2 PCA patients and 1 aAD patient with relatively little language impairment (scores of −0.53, −0.41, and 0.12, respectively). It is thus unlikely that inter‐subject differences in language function lateralization affected language‐related associations; however, in studies involving significant language impairment in left‐handed or ambidextrous individuals, right temporal tau accumulation should also be assessed.
Of the three cognitive domains investigated, visuospatial function was most closely associated with tracer uptake. The visuospatial eigenvector explained 85% of the variance in cognitive scores and was localized to right lingual gyrus, where both PCA and aAD patients had elevated uptake. Although this result suggests that tau accumulation in early visual areas may be a good predictor of visuospatial impairment, it does not imply that pathology in these regions alone accounts for patients' deficits; indeed, PCA patients often have impairments that suggest complex interactions of disease in the ventral and dorsal visual streams (e.g., Gillebert et al., 2015; Meek, Shelton, and Marotta, 2013), and PCA is associated with ventral and dorsal stream structural changes that can occur either in isolation or concurrently within an individual patient (Migliaccio et al., 2012). Moreover, recent consensus criteria for PCA diagnosis allow for subtypes of this syndrome that differ in the lateralization of disease (Crutch et al., 2017). Heterogeneity in the distribution of tau pathology may thus account for the fact that Ossenkoppele et al. (2016) observed bilateral occipital associations with visuospatial function (with apparent peaks in the left hemisphere), while sparse regression in the current study indicated a cluster in right lingual gyrus. It is also possible that lvPPA and aAD patients in the current study had disease in parietal and temporal association regions (see Figure 1), and that the visuospatial sparse regression selected areas that were relatively unique to PCA.
Memory performance was associated with an eigenvector that comprised clusters in right fusiform gyrus, cuneus, anterior hippocampus, and amygdala. This model predicted 57% of the variance in patients' scores. The inclusion of a voxel cluster in the cuneus may indicate that visual processing ability was predictive (although not necessarily causal) of patients' memory performance. Consistent with this interpretation, we found that patients' memory and visuospatial scores were positively correlated. This association may reflect complex clinical presentations within our sample (e.g., an initial presentation with visuospatial deficits, coupled with the later emergence of amnestic symptoms), or patients' reliance on modality‐specific strategies for encoding visual features of stimuli from the Rey Complex Figure and PVLT tasks. The appearance of the cuneus in the memory‐related eigenvector may also be due to the inclusion of two patients in the aAD group who initially presented with PCA. Finally, the memory‐related eigenvector included a cluster that spanned the border between right hippocampus and amygdala, suggesting a role for the medial temporal lobe role in patients' episodic memory deficits; such deficits were observed in aAD patients as well as one PCA patient. However, memory scores were not associated with uptake averaged across the whole hippocampus or whole entorhinal cortex, further suggesting that tau accumulation in different MTL subregions was heterogeneously related to memory performance. Overall, uptake in MTL areas was considerably lower than in the neocortex and did not differ by phenotype. We additionally note that in both the current study and that of Ossenkoppele et al. (2016), voxelwise associations between memory performance and MTL tracer uptake were observed at a statistical threshold of p < .05 but not p < .01, uncorrected for multiple comparisons. These cross‐study similarities suggest a consistent but relatively modest association of MTL tau with memory deficits in atypical AD, possibly driven by the subset of amnestic patients in both cohorts. In contrast, early‐onset and non‐amnestic AD variants have less MTL atrophy, more widespread neocortical tau accumulation, and preserved episodic memory (Mendez et al., 2012; Murray et al., 2011; Whitwell et al., 2012).
The current results demonstrate that sparse regression can effectively model phenotypic differences in domain‐specific cognitive performance. The neuroanatomical distribution of 18F‐flortaucipir uptake and its associations with cognition were broadly consistent with previous studies in typical (Schwarz et al., 2016; Schöll et al., 2016) and atypical (Ossenkoppele et al., 2016, Xia et al., 2017) AD cases. In each cognitive domain, sparse regression models outperformed ROI‐based models in their ability to explain variance in patients' cognitive scores. ROI‐based analysis is common for research and clinical applications, and it has the strength of providing an objective framework for statistical analysis. Anatomical ROIs are usually defined in a standardized analysis space (with optional remapping into individual image space) based on well‐defined landmarks; thus, they are unbiased by the methodology or sample characteristics of a particular study. However, anatomical landmarks are a poor predictor of functional or cytoarchitectonic boundaries (Glasser et al., 2016); thus, if ROIs are small in volume, comprise more than one functional area, or are in morphologically variable areas of the brain, they may not generalize to new datasets that include brains from different individuals. The approach used in the current study employs a sparsity parameter that penalizes weakly‐associated voxels, ensuring that model predictions are based on an optimal and anatomically plausible set of voxel predictors (Avants et al., 2012; Kandel et al., 2013).
4.3. Limitations
The present study provides promising initial results regarding the anatomical specificity of 18F‐flortaucipir imaging and its association with patients' cognitive symptoms. However, several factors limit the interpretation of our results and provide motivation for a larger replication effort. First, the present study examined a relatively small cohort of amnestic and non‐amnestic AD cases, and aspects of PET imaging results may be dependent on the particular individuals included. For example, the aAD patients whom we imaged had younger disease onsets (mean onset = 58 years old) than in typical amnestic AD and are thus not representative of typical late‐onset amnestic AD (Migliaccio et al., 2015). It is possible that an amnestic cohort with later disease onset would have greater tau accumulation in the hippocampus and MTL. Second, sparse spatial decomposition of 18F‐flortaucipir data may result in different eigenvectors depending on the sample size and relative frequencies of different AD phenotypes; thus, the specific eigenvectors generated in the present study should be applied to other datasets only with great caution. Third, patients were grouped according to their phenotype at the time of PET imaging; thus, patients with clinically‐observed memory impairments were classified as aAD, whether their initial presentation had been amnestic or not. This approach was chosen to highlight differences in cognitive performance and tau pathology at the time of imaging. In contrast, for analyses that focus on the evolution of clinical symptoms or anatomical progression of disease over time, it may be more appropriate to group patients according their syndrome at initial assessment: in this scenario, a patient who initially presented with PCA but later developed memory deficits would be grouped with other, non‐amnestic PCA patients. The current patient groupings thus represent one approach to phenotypic heterogeneity in AD and are not meant to imply that PCA patients who subsequently develop memory deficits follow the same disease course as purely amnestic AD patients. Fourth, the present study did not compare the ability of PET tau and amyloid imaging results to account for clinical symptoms, nor did it consider possible interactions between tau and amyloid pathology (Ittner & Götz, 2011; see also Pontecorvo et al., 2017). Fifth, tau PET imaging data from cognitively normal controls were not available. Although we report sparse eigenvectors that comprise known foci of disease in atypical AD syndromes, we were unable to assess relationships between PET data and cognition across both controls and patients. Including such a control group would allow us to confirm the absence of tracer uptake in controls and thus strengthen the case for associations between regional tracer uptake and domain‐specific cognitive impairment. Sixth, the full extent of variation in 18F‐flortaucipir's binding properties remains an area of ongoing research. Uptake is known to differ according to tau isoform (Lowe et al., 2016; Sander et al., 2016); and a diversity of post‐translational mechanisms, including not only phosphorylation but also acetylation, methylation, and other changes (Goedert, Eisenberg, & Crowther, 2017; Martin, Latypova, & Terro, 2011; Morris et al., 2015) may contribute to patient‐specific differences in uptake. Finally, definitive diagnosis of AD pathology can only be secured postmortem, and we cannot entirely rule out the possibility of co‐morbid pathologies. However, patients in the current study were screened for indications of vascular disease, and differential diagnoses (e.g., frontotemporal dementia and corticobasal syndrome) were considered in clinical consensus meetings involving multiple neurologists (DW, DI, and MG). Moreover, CSF data consistent with AD pathology for all patients with available data.
5. CONCLUSIONS
With these caveats in mind, the current study demonstrates that 18F‐flortaucipir binds specifically to neocortical areas affected in both amnestic and non‐amnestic AD phenotypes. Sparse regression analyses of PET data produced sensible spatial components in which uptake patterns were associated with patients' language, visuospatial, and memory performance. These cognitive associations support the biological validity of 18F‐flortaucipir, linking tracer uptake in vivo with postmortem findings that patients' cognitive symptoms are associated with tau pathology. The non‐amnestic patients in the current sample represent a valuable test case for 18F‐flortaucipir and support its application to phenotypes other than typical late‐onset amnestic AD. Further research with larger, phenotypically diverse samples is essential for discovering replicable, generalizable spatial components in PET tau imaging data. Moreover, as new tau‐binding radioligands become available, comparative evaluation in a variety of tau‐related neurodegenerative diseases will be essential for assessing the advantages and disadvantages of each.
CONFLICT OF INTEREST
None of the authors have any conflicts of interest to disclose.
Supporting information
Additional Supporting Information may be found online in the supporting information tab for this article.
Supporting Information
ACKNOWLEDGMENTS
The authors thank Dr. Adam Schwarz for providing detailed information on normative SUVR thresholds. This work was supported in part by grants from the National Institutes of Health (AG017586, AG010124, AG043503, and NS088341), Dana Foundation, Wyncote Foundation, Newhouse Foundation, and Arking Foundation. Dr. Phillips is the recipient of an Alzheimer's Association Research Fellowship (AARF‐16–443681). Avid Radiopharmaceuticals generously provided radioligand.
Phillips JS, Das SR, McMillan CT, et al. Tau PET imaging predicts cognition in atypical variants of Alzheimer's disease. Hum Brain Mapp. 2018;39:691–708. 10.1002/hbm.23874
Funding information National Institutes of Health, Grant/Award Numbers: AG017586, AG010124, AG043503, and NS088341, Dana Foundation, Wyncote Foundation, Newhouse Foundation, and Arking Foundation. Dr. Phillips is the recipient of an Alzheimer's Association Research Fellowship, Grant/Award Number: AARF‐16‐443681
REFERENCES
- Ahmed, S. , Haigh, A.‐M. F. , de Jager, C. A. , & Garrard, P. (2013). Connected speech as a marker of disease progression in autopsy‐proven Alzheimer's disease. Brain, 136(12), 3727–3737. https://doi.org/http://dx.doi.org/10.1093/brain/awt269 [DOI] [PMC free article] [PubMed] [Google Scholar]
- Arnold, S. E. , Hyman, B. T. , Flory, J. , Damasio, A. R. , Hoesen, V. , & W, G. (1991). The topographical and neuroanatomical distribution of neurofibrillary tangles and neuritic plaques in the cerebral cortex of patients with Alzheimer's disease. Cerebral Cortex, 1(1), 103–116. 10.1093/cercor/1.1.103 [DOI] [PubMed] [Google Scholar]
- Arriagada, P. V. , Growdon, J. H. , Hedley‐Whyte, E. T. , & Hyman, B. T. (1992). Neurofibrillary tangles but not senile plaques parallel duration and severity of Alzheimer's disease. Neurology, 42(3 Pt 1), 631–639. [DOI] [PubMed] [Google Scholar]
- Ash, S. , Evans, E. , O'shea, J. , Powers, J. , Boller, A. , Weinberg, D. , … Grossman, M. (2013). Differentiating primary progressive aphasias in a brief sample of connected speech. Neurology, 81(4), 329–336. 10.1212/WNL.0b013e31829c5d0e [DOI] [PMC free article] [PubMed] [Google Scholar]
- Avants, B. , Dhillon, P. , Kandel, B. M. , Cook, P. A. , McMillan, C. T. , Grossman, M. , & Gee, J. C. (2012). Eigenanatomy improves detection power for longitudinal cortical change In Ayache N., Delingette H., Golland P., & Mori K. (Eds.), Medical image computing and computer‐assisted intervention – MICCAI 2012 (pp. 206–213). Berlin Heidelberg: Springer; Retrieved from http://link.springer.com/chapter/10.1007/978-3-642-33454-2_26 [DOI] [PMC free article] [PubMed] [Google Scholar]
- Avants, B. B. , Libon, D. J. , Rascovsky, K. , Boller, A. , McMillan, C. T. , Massimo, L. , … Grossman, M. (2014a). Sparse canonical correlation analysis relates network‐level atrophy to multivariate cognitive measures in a neurodegenerative population. NeuroImage, 84, 698–711. 10.1016/j.neuroimage.2013.09.048 [DOI] [PMC free article] [PubMed] [Google Scholar]
- Avants, B. B. , Tustison, N. J. , Song, G. , Cook, P. A. , Klein, A. , & Gee, J. C. (2011a). A reproducible evaluation of ANTs similarity metric performance in brain image registration. NeuroImage, 54(3), 2033–2044. 10.1016/j.neuroimage.2010.09.025 [DOI] [PMC free article] [PubMed] [Google Scholar]
- Avants, B. B. , Tustison, N. J. , Stauffer, M. , Song, G. , Wu, B. , & Gee, J. C. (2014b). The Insight ToolKit image registration framework. Frontiers in Neuroinformatics, 8, 10.3389/fninf.2014.00044 [DOI] [PMC free article] [PubMed] [Google Scholar]
- Avants, B. B. , Tustison, N. J. , Wu, J. , Cook, P. A. , & Gee, J. C. (2011b). An open source multivariate framework for n‐tissue segmentation with evaluation on public data. Neuroinformatics, 9(4), 381–400. 10.1007/s12021-011-9109-y [DOI] [PMC free article] [PubMed] [Google Scholar]
- Bonner, M. F. , Ash, S. , & Grossman, M. (2010). The new classification of primary progressive aphasia into semantic, logopenic, or nonfluent/agrammatic variants. Current Neurology and Neuroscience Reports, 10(6), 484–490. 10.1007/s11910-010-0140-4 [DOI] [PMC free article] [PubMed] [Google Scholar]
- Braak, H. , Alafuzoff, I. , Arzberger, T. , Kretzschmar, H. , & Del Tredici, K. (2006). Staging of Alzheimer disease‐associated neurofibrillary pathology using paraffin sections and immunocytochemistry. Acta Neuropathologica, 112(4), 389–404. 10.1007/s00401-006-0127-z [DOI] [PMC free article] [PubMed] [Google Scholar]
- Chien, D. T. , Bahri, S. , Szardenings, A. K. , Walsh, J. C. , Mu, F. , Su, M.‐Y. , … Kolb, H. C. (2013). Early clinical PET imaging results with the novel PHF‐tau radioligand [F‐18]‐T807. Journal of Alzheimer's Disease, 34(2), 457–468. 10.3233/JAD-122059 [DOI] [PubMed] [Google Scholar]
- Cho, H. , Choi, J. Y. , Lee, S. H. , Lee, J. H. , Choi, Y.‐C. , Ryu, Y. H. , … Lyoo, C. H. (2017). Excessive tau accumulation in the parieto‐occipital cortex characterizes early‐onset Alzheimer's disease. Neurobiology of Aging, 53, 103–111. 10.1016/j.neurobiolaging.2017.01.024 [DOI] [PubMed] [Google Scholar]
- Cook, P. A. , McMillan, C. T. , Avants, B. B. , Peelle, J. E. , Gee, J. C. , & Grossman, M. (2014). Relating brain anatomy and cognitive ability using a multivariate multimodal framework. NeuroImage, 99, 477–486. 10.1016/j.neuroimage.2014.05.008 [DOI] [PMC free article] [PubMed] [Google Scholar]
- Crutch, S. J. , Lehmann, M. , Schott, J. M. , Rabinovici, G. D. , Rossor, M. N. , & Fox, N. C. (2012). Posterior cortical atrophy. The Lancet Neurology, 11(2), 170–178. 10.1016/S1474-4422(11)70289‐7 [DOI] [PMC free article] [PubMed] [Google Scholar]
- Crutch, S. J. , Schott, J. M. , & Rabinovici, G. D. , Murray, M. , Snowden, J. S. , van der Flier, W. M. , … Fox, N. C. (2017). Consensus classification of posterior cortical atrophy. Alzheimer?s & Dementia. 10.1016/j.jalz.2017.01.014 [DOI] [PMC free article] [PubMed] [Google Scholar]
- Dani, M. , Edison, P. , & Brooks, D. J. (2016). Imaging biomarkers in tauopathies. Parkinsonism & Related Disorders, 22(Supplement 1), S26–S28. 10.1016/j.parkreldis.2015.08.011 [DOI] [PubMed] [Google Scholar]
- Dehaene‐Lambertz, G. , Dehaene, S. , Anton, J.‐L. , Campagne, A. , Ciuciu, P. , Dehaene, G. P. , … Poline, J.‐B. (2006). Functional segregation of cortical language areas by sentence repetition. Human Brain Mapping, 27(5), 360–371. 10.1002/hbm.20250 [DOI] [PMC free article] [PubMed] [Google Scholar]
- Dickerson, B. C. , Bakkour, A. , Salat, D. H. , Feczko, E. , Pacheco, J. , Greve, D. N. , … Buckner, R. L. (2009). The cortical signature of Alzheimer's disease: Regionally specific cortical thinning relates to symptom severity in very mild to mild AD dementia and is detectable in asymptomatic amyloid‐positive individuals. Cerebral Cortex (Cortex), 19(3), 497–510. 10.1093/cercor/bhn113 [DOI] [PMC free article] [PubMed] [Google Scholar]
- Diedrichsen, J. , Balsters, J. H. , Flavell, J. , Cussans, E. , & Ramnani, N. (2009). A probabilistic MR atlas of the human cerebellum. NeuroImage, 46(1), 39–46. 10.1016/j.neuroimage.2009.01.045 [DOI] [PubMed] [Google Scholar]
- Diedrichsen, J. , Maderwald, S. , Küper, M. , Thürling, M. , Rabe, K. , Gizewski, E. R. , … Timmann, D. (2011). Imaging the deep cerebellar nuclei: A probabilistic atlas and normalization procedure. NeuroImage, 54(3), 1786–1794. 10.1016/j.neuroimage.2010.10.035 [DOI] [PubMed] [Google Scholar]
- Domoto‐Reilly, K. , Sapolsky, D. , Brickhouse, M. , & Dickerson, B. C. (2012). Naming impairment in Alzheimer's disease is associated with left anterior temporal lobe atrophy. NeuroImage, 63(1), 348–355. 10.1016/j.neuroimage.2012.06.018 [DOI] [PMC free article] [PubMed] [Google Scholar]
- Friederici, A. D. , & Gierhan, S. M. (2013). The language network. Current Opinion in Neurobiology, 23(2), 250–254. 10.1016/j.conb.2012.10.002 [DOI] [PubMed] [Google Scholar]
- Gefen, T. , Gasho, K. , Rademaker, A. , Lalehzari, M. , Weintraub, S. , Rogalski, E. , … Mesulam, M.‐M. (2012). Clinically concordant variations of Alzheimer pathology in aphasic versus amnestic dementia. Brain, 135(5), 1554–1565. 10.1093/brain/aws076 [DOI] [PMC free article] [PubMed] [Google Scholar]
- Giannini, L. A. A. , Irwin, D. J. , McMillan, C. T. , Ash, S. , Rascovsky, K. , Wolk, D. A. , … Grossman, M. (2017). Clinical marker for Alzheimer disease pathology in logopenic primary progressive aphasia. Neurology, 88(24), 2276–2284. 10.1212/WNL.0000000000004034 [DOI] [PMC free article] [PubMed] [Google Scholar]
- Giannakopoulos, P. , Herrmann, F. R. , Bussière, T. , Bouras, C. , Kövari, E. , Perl, D. P. , … Hof, P. R. (2003). Tangle and neuron numbers, but not amyloid load, predict cognitive status in Alzheimer's disease. Neurology, 60(9), 1495–1500. 10.1212/01.WNL.0000063311.58879.01 [DOI] [PubMed] [Google Scholar]
- Gillebert, C. R. , Schaeverbeke, J. , Bastin, C. , Neyens, V. , Bruffaerts, R. , Weer, A.‐S. D. , … Vandenberghe, R. (2015). 3D shape perception in posterior cortical atrophy: A visual neuroscience perspective. Journal of Neuroscience, 35(37), 12673–12692. 10.1523/JNEUROSCI.3651-14.2015 [DOI] [PMC free article] [PubMed] [Google Scholar]
- Glasser, M. F. , Smith, S. M. , Marcus, D. S. , Andersson, J. L. R. , Auerbach, E. J. , Behrens, T. E. J. , … Van Essen, D. C. (2016). The Human Connectome Project's neuroimaging approach. Nature Neuroscience, 19(9), 1175–1187. 10.1038/nn.4361 [DOI] [PMC free article] [PubMed] [Google Scholar]
- Goedert, M. , Eisenberg, D. S. , & Crowther, R. A. (2017). Propagation of Tau aggregates and neurodegeneration. Annual Review of Neuroscience, 40(1), 189–210. 10.1146/annurev-neuro-072116-031153 [DOI] [PubMed] [Google Scholar]
- Goodglass, H. , & Kaplan, E. (1983). Boston diagnostic aphasia examination booklet. Philadelphia: Lea & Febiger. [Google Scholar]
- Goodglass, H. , Kaplan, E. , & Barresi, B. (2001). The assessment of aphasia and related disorders. Philadelphia: Lippincott Williams & Wilkins. [Google Scholar]
- Gorno‐Tempini, M. L. , Brambati, S. M. , Ginex, V. , Ogar, J. , Dronkers, N. F. , Marcone, A. , … Miller, B. L. (2008). The logopenic/phonological variant of primary progressive aphasia. Neurology, 71(16), 1227–1234. 10.1212/01.wnl.0000320506.79811.da [DOI] [PMC free article] [PubMed] [Google Scholar]
- Gorno‐Tempini, M. L. , Dronkers, N. F. , Rankin, K. P. , Ogar, J. M. , Phengrasamy, L. , Rosen, H. J. , … Miller, B. L. (2004). Cognition and anatomy in three variants of primary progressive aphasia. Annals of Neurology, 55(3), 335–346. http://doi.org/http://dx.doi.org/10.1002/ana.10825 [DOI] [PMC free article] [PubMed] [Google Scholar]
- Gorno‐Tempini, M. L. , Hillis, A. E. , Weintraub, S. , Kertesz, A. , Mendez, M. , Cappa, S. F. , … Grossman, M. (2011). Classification of primary progressive aphasia and its variants. Neurology, 76(11), 1006–1014. 10.1212/WNL.0b013e31821103e6 [DOI] [PMC free article] [PubMed] [Google Scholar]
- Gross, A. L. , Manly, J. J. , Pa, J. , Johnson, J. K. , Park, L. Q. , Mitchell, M. B. , … McLaren, D. G. (2012). Cortical signatures of cognition and their relationship to Alzheimer's disease. Brain Imaging and Behavior, 6(4), 584–598. 10.1007/s11682-012-9180-5 [DOI] [PMC free article] [PubMed] [Google Scholar]
- Grossman, M. (2010). Primary progressive aphasia: clinicopathological correlations. Nature Reviews. Neurology, 6(2), 88–97. 10.1038/nrneurol.2009.216 [DOI] [PMC free article] [PubMed] [Google Scholar]
- Grossman, M. , McMillan, C. , Moore, P. , Ding, L. , Glosser, G. , Work, M. , & Gee, J. (2004). What's in a name: Voxel‐based morphometric analyses of MRI and naming difficulty in Alzheimer's disease, frontotemporal dementia and corticobasal degeneration. Brain, 127(3), 628–649. 10.1093/brain/awh075 [DOI] [PubMed] [Google Scholar]
- Harry, B. B. , Umla‐Runge, K. , Lawrence, A. D. , Graham, K. S. , & Downing, P. E. (2016). Evidence for integrated visual face and body representations in the anterior temporal lobes. Journal of Cognitive Neuroscience, 28(8), 1178–1193. 10.1162/jocn_a_00966 [DOI] [PubMed] [Google Scholar]
- Heindel, W. C. , Festa, E. K. , Ott, B. R. , Landy, K. M. , & Salmon, D. P. (2013). Prototype learning and dissociable categorization systems in Alzheimer's disease. Neuropsychologia, 51(9), 1699–1708. http://doi.org/http://dx.doi.org/10.1016/j.neuropsychologia.2013.06.001 [DOI] [PMC free article] [PubMed] [Google Scholar]
- Herrera‐Guzmán, I. , Peña‐Casanova, J. , Lara, J. P. , Gudayol‐Ferré, E. , & Böhm, P. (2004). Influence of age, sex, and education on the Visual Object and Space Perception Battery (VOSP) in a healthy normal elderly population. The Clinical Neuropsychologist, 18(3), 385–394. 10.1080/1385404049052421 [DOI] [PubMed] [Google Scholar]
- Hochberg, Y. , & Benjamini, Y. (1990). More powerful procedures for multiple significance testing. Statistics in Medicine, 9(7), 811–818. 10.1002/sim.4780090710 [DOI] [PubMed] [Google Scholar]
- Hof, P. R. , Vogt, B. A. , Bouras, C. , & Morrison, J. H. (1997). Atypical form of Alzheimer's disease with prominent posterior cortical atrophy: A review of lesion distribution and circuit disconnection in cortical visual pathways. Vision Research, 37(24), 3609–3625. 10.1016/S0042-6989(96)00240‐4 [DOI] [PubMed] [Google Scholar]
- Ingelsson, M. , Fukumoto, H. , Newell, K. L. , Growdon, J. H. , Hedley‐Whyte, E. T. , Frosch, M. P. , … Irizarry, M. C. (2004). Early A‐[beta] accumulation and progressive synaptic loss, gliosis, and tangle formation in AD brain. Neurology, 62(6), 925–931. 10.1212/01.WNL.0000115115.98960.37 [DOI] [PubMed] [Google Scholar]
- Irwin, D. J. , McMillan, C. T. , Toledo, J. B. , Arnold, S. E. , Shaw, L. M. , Wang, L.‐S. , … Grossman, M. (2012). Comparison of cerebrospinal fluid levels of tau and Aβ 1–42 in Alzheimer disease and frontotemporal degeneration using 2 analytical platforms. Archives of Neurology, 69(8), 1018–1025. 10.1001/archneurol.2012.26 [DOI] [PMC free article] [PubMed] [Google Scholar]
- Ittner, L. M. , & Götz, J. (2011). Amyloid‐β and tau—a toxic pas de deux in Alzheimer's disease. Nature Reviews Neuroscience, 12(2), 67–72. 10.1038/nrn2967 [DOI] [PubMed] [Google Scholar]
- Jenkinson, M. , Beckmann, C. F. , Behrens, T. E. J. , Woolrich, M. W. , & Smith, S. M. (2012). FSL. NeuroImage, 62(2), 782–790. 10.1016/j.neuroimage.2011.09.015 [DOI] [PubMed] [Google Scholar]
- Kas, A. , Souza, L. C. , de, Samri, D. , Bartolomeo, P. , Lacomblez, L. , Kalafat, M. , …, … Arazin, M. (2011). Neural correlates of cognitive impairment in posterior cortical atrophy. Brain, 134(5), 1464–1478. 10.1093/brain/awr055 [DOI] [PubMed] [Google Scholar]
- Kandel, B. M. , Wolk, D. A. , Gee, J. C. , & Avants, B. (2013). Predicting Cognitive Data from Medical Images Using Sparse Linear Regression In International Conference on Information Processing in Medical Imaging (pp. 86–97). Springer. [DOI] [PMC free article] [PubMed] [Google Scholar]
- Klein, A. , Andersson, J. , Ardekani, B. A. , Ashburner, J. , Avants, B. , Chiang, M.‐C. , … Hellier, P. (2009). Evaluation of 14 nonlinear deformation algorithms applied to human brain MRI registration. Neuroimage, 46(3), 786–802. [DOI] [PMC free article] [PubMed] [Google Scholar]
- Klein, A. , & Tourville, J. (2012). 101 labeled brain images and a consistent human cortical labeling protocol. Frontiers in Neuroscience, 6, 171 10.3389/fnins.2012.00171 [DOI] [PMC free article] [PubMed] [Google Scholar]
- Klunk, W. E. , Engler, H. , Nordberg, A. , Wang, Y. , Blomqvist, G. , Holt, D. P. , … Långström, B. (2004). Imaging brain amyloid in Alzheimer's disease with Pittsburgh Compound‐B. Annals of Neurology, 55(3), 306–319. 10.1002/ana.20009 [DOI] [PubMed] [Google Scholar]
- Leff, A. P. , Schofield, T. M. , Crinion, J. T. , Seghier, M. L. , Grogan, A. , Green, D. W. , & Price, C. J. (2009). The left superior temporal gyrus is a shared substrate for auditory short‐term memory and speech comprehension: Evidence from 210 patients with stroke. Brain, 132(12), 3401–3410. [DOI] [PMC free article] [PubMed] [Google Scholar]
- Leyton, C. E. , Britton, A. K. , Hodges, J. R. , Halliday, G. M. , & Kril, J. J. (2016). Distinctive pathological mechanisms involved in primary progressive aphasias. Neurobiology of Aging, 38, 82–92. https://doi.org/http://dx.doi.org/10.1016/j.neurobiolaging.2015.10.017 [DOI] [PubMed] [Google Scholar]
- Libon, D. J. , Bondi, M. W. , Price, C. C. , Lamar, M. , Eppig, J. , Wambach, D. M. , … Penney, D. L. (2011a). Verbal serial list learning in mild cognitive impairment: A profile analysis of interference, forgetting, and errors. Journal of the International Neuropsychological Society, 17(05), 905–914. 10.1017/S1355617711000944 [DOI] [PMC free article] [PubMed] [Google Scholar]
- Libon, D. J. , Rascovsky, K. , Gross, R. G. , White, M. T. , Xie, S. X. , Dreyfuss, M. et al. (2011b). The Philadelphia brief assessment of cognition (PBAC): A validated screening measure for dementia. The Clinical Neuropsychologist, 25(8), 1314–1330. 10.1080/13854046.2011.631585 [DOI] [PMC free article] [PubMed] [Google Scholar]
- Libon, D. J. , Swenson, R. A. , Barnoski, E. J. , & Sands, L. P. (1993). Clock drawing as an assessment tool for dementia. Archives of Clinical Neuropsychology, 8(5), 405–415. 10.1016/0887-6177(93)90004-K [DOI] [PubMed] [Google Scholar]
- Lowe, V. J. , Curran, G. , Fang, P. , Liesinger, A. M. , Josephs, K. A. , Parisi, J. E. , … Murray, M. E. (2016). An autoradiographic evaluation of AV‐1451 Tau PET in dementia. Acta Neuropathologica Communications, 4, 58 10.1186/s40478-016-0315-6 [DOI] [PMC free article] [PubMed] [Google Scholar]
- Martin, L. , Latypova, X. , & Terro, F. (2011). Post‐translational modifications of tau protein: Implications for Alzheimer's disease. Neurochemistry International, 58(4), 458–471. 10.1016/j.neuint.2010.12.023 [DOI] [PubMed] [Google Scholar]
- Marquié, M. , Normandin, M. D. , Vanderburg, C. R. , Costantino, I. M. , Bien, E. A. , Rycyna, L. G. , … Gómez‐Isla, T. (2015). Validating novel tau positron emission tomography tracer [F‐18]‐AV‐1451 (T807) on postmortem brain tissue. Annals of Neurology, 78(5), 787–800. 10.1002/ana.24517 [DOI] [PMC free article] [PubMed] [Google Scholar]
- McKhann, G. M. , Knopman, D. S. , Chertkow, H. , Hyman, B. T. , Jack, C. R., Jr. , Kawas, C. H. , … Phelps, C. H. (2011). The diagnosis of dementia due to Alzheimer's disease: Recommendations from the National Institute on Aging—Alzheimer's Association workgroups on diagnostic guidelines for Alzheimer's disease. Alzheimer's & Dementia, 7(3), 263–269. 10.1016/j.jalz.2011.03.005 [DOI] [PMC free article] [PubMed] [Google Scholar]
- McMillan, C. T. , Avants, B. B. , Cook, P. , Ungar, L. , Trojanowski, J. Q. , & Grossman, M. (2014). The power of neuroimaging biomarkers for screening frontotemporal dementia. Human Brain Mapping, 35(9), 4827–4840. 10.1002/hbm.22515 [DOI] [PMC free article] [PubMed] [Google Scholar]
- McMonagle, P. , Deering, F. , Berliner, Y. , & Kertesz, A. (2006). The cognitive profile of posterior cortical atrophy. Neurology, 66(3), 331–338. 10.1212/01.wnl.0000196477.78548.db [DOI] [PubMed] [Google Scholar]
- Meek, B. P. , Shelton, P. A. , & Marotta, J. J. (2013). Posterior cortical atrophy: Visuomotor deficits in reaching and grasping. Frontiers in Human Neuroscience, 7, 10.3389/fnhum.2013.00294 [DOI] [PMC free article] [PubMed] [Google Scholar]
- Mendez, M. F. , Lee, A. S. , Joshi, A. , & Shapira, J. S. (2012). Nonamnestic presentations of early‐onset Alzheimer's disease. American Journal of Alzheimer's Disease & Other Dementiasr, 27(6), 413–420. 10.1177/1533317512454711 [DOI] [PMC free article] [PubMed] [Google Scholar]
- Mesulam, M.‐M. , Rogalski, E. J. , Wieneke, C. , Hurley, R. S. , Geula, C. , Bigio, E. H. , … Weintraub, S. (2014a). Primary progressive aphasia and the evolving neurology of the language network. Nature Reviews Neurology, 10(10), 554–569. 10.1038/nrneurol.2014.159 [DOI] [PMC free article] [PubMed] [Google Scholar]
- Mesulam, M.‐M. , Weintraub, S. , Rogalski, E. J. , Wieneke, C. , Geula, C. , & Bigio, E. H. (2014b). Asymmetry and heterogeneity of Alzheimer's and frontotemporal pathology in primary progressive aphasia. Brain, 137(4), 1176–1192. https://doi.org/http://dx.doi.org/10.1093/brain/awu024 [DOI] [PMC free article] [PubMed] [Google Scholar]
- Migliaccio, R. , Agosta, F. , Possin, K. , Canu, E. , Filippi, M. , Rabinovici, Rabinovici , … Gorno‐Tempini, M. (2015). Mapping The Progression Of Atrophy In Early And Late Onset Alzheimer?s Disease. Journal of Alzheimer?s Disease?: JAD, 46(2), 351–364. 10.3233/JAD-142292 [DOI] [PMC free article] [PubMed] [Google Scholar]
- Migliaccio, R. , Agosta, F. , Scola, E. , Magnani, G. , Cappa, S. F. , Pagani, E. , … Filippi, M. (2012). Ventral and dorsal visual streams in posterior cortical atrophy: A DT MRI study. Neurobiology of Aging, 33(11), 2572–2584. 10.1016/j.neurobiolaging.2011.12.025 [DOI] [PMC free article] [PubMed] [Google Scholar]
- Morris, M. , Knudsen, G. M. , Maeda, S. , Trinidad, J. C. , Ioanoviciu, A. , Burlingame, A. L. , & Mucke, L. (2015). Tau post‐translational modifications in wild‐type and human amyloid precursor protein transgenic mice. Nature Neuroscience, 18(8), 1183–1189. 10.1038/nn.4067 [DOI] [PMC free article] [PubMed] [Google Scholar]
- Murray, M. E. , Graff‐Radford, N. R. , Ross, O. A. , Petersen, R. C. , Duara, R. , & Dickson, D. W. (2011). Neuropathologically defined subtypes of Alzheimer's disease with distinct clinical characteristics: A retrospective study. The Lancet. Neurology, 10(9), 785–796. 10.1016/S1474-4422(11)70156‐9 [DOI] [PMC free article] [PubMed] [Google Scholar]
- Nelson, P. T. , Alafuzoff, I. , Bigio, E. H. , Bouras, C. , Braak, H. , Cairns, N. J. , … Beach, T. G. (2012). Correlation of Alzheimer Disease Neuropathologic Changes With Cognitive Status: A Review of the Literature. Journal of Neuropathology & Experimental Neurology, 71(5), 362–381. 10.1097/NEN.0b013e31825018f7 [DOI] [PMC free article] [PubMed] [Google Scholar]
- Ossenkoppele, R. , Schonhaut, D. R. , Schöll, M. , Lockhart, S. N. , Ayakta, N. , Baker, S. L. , … Rabinovici, G. D. (2016). Tau PET patterns mirror clinical and neuroanatomical variability in Alzheimer's disease. Brain, aww027 10.1093/brain/aww027 [DOI] [PMC free article] [PubMed] [Google Scholar]
- Pascual, B. , & Masdeu, J. C. (2016). Tau, amyloid, and hypometabolism in the logopenic variant of primary progressive aphasia. Neurology, 86(5), 487–488. 10.1212/WNL.0000000000002340 [DOI] [PubMed] [Google Scholar]
- Patterson, K. , Nestor, P. J. , Rogers, T. T. (2007). Where do you know what you know? The representation of semantic knowledge in the human brain. Nature Reviews Neuroscience, 8(12), 976–987. 10.1038/nrn2277 [DOI] [PubMed] [Google Scholar]
- Pontecorvo, M. J. , Sr, D. , D, M. , Navitsky, M. , Lu, M. , Salloway, S. , … Mintun, M. A. (2017). Relationships between flortaucipir PET tau binding and amyloid burden, clinical diagnosis, age and cognition. Brain, 140(3), 748–763. 10.1093/brain/aww334 [DOI] [PMC free article] [PubMed] [Google Scholar]
- Price, C. J. (2010). The anatomy of language: A review of 100 fMRI studies published in 2009. Annals of the New York Academy of Sciences, 1191, 62–88. 10.1111/j.1749-6632.2010.05444.x [DOI] [PubMed] [Google Scholar]
- Pustina, D. , Coslett, H. B. , Turkeltaub, P. E. , Tustison, N. , Schwartz, M. F. , & Avants, B. (2016). Automated segmentation of chronic stroke lesions using LINDA: Lesion Identification with Neighborhood Data Analysis. Human Brain Mapping, 37(4), 1405–1421. 10.1002/hbm.23110 [DOI] [PMC free article] [PubMed] [Google Scholar]
- Rohrer, J. D. , Caso, F. , Mahoney, C. , Henry, M. , Rosen, H. J. , Rabinovici, G. , … Gorno‐Tempini, M. L. (2013). Patterns of longitudinal brain atrophy in the logopenic variant of primary progressive aphasia. Brain and Language, 127(2), 121–126. 10.1016/j.bandl.2012.12.008 [DOI] [PMC free article] [PubMed] [Google Scholar]
- Sander, K. , Lashley, T. , Gami, P. , Gendron, T. , Lythgoe, M. F. , Rohrer, J. D. , … Årstad, E. (2016). Characterization of tau positron emission tomography tracer [18F]AV‐1451 binding to postmortem tissue in Alzheimer's disease, primary tauopathies, and other dementias. Alzheimer's & Dementia, 12(11), 1116–1124. 10.1016/j.jalz.2016.01.003 [DOI] [PubMed] [Google Scholar]
- Schöll, M. , Lockhart, S. N. , Schonhaut, D. R. , O'neil, J. P. , Janabi, M. , Ossenkoppele, R. , … Jagust, W. J. (2016). PET imaging of tau deposition in the aging human brain. Neuron, 89(5), 971–982. 10.1016/j.neuron.2016.01.028 [DOI] [PMC free article] [PubMed] [Google Scholar]
- Schwarz, A. J. , Yu, P. , Miller, B. B. , Shcherbinin, S. , Dickson, J. , Navitsky, M. , … Mintun, M. S. (2016). Regional profiles of the candidate tau PET ligand 18F‐AV‐1451 recapitulate key features of Braak histopathological stages. Brain, 139(5), 1539–1550. 10.1093/brain/aww023 [DOI] [PubMed] [Google Scholar]
- Shaw, L. M. , Vanderstichele, H. , Knapik‐Czajka, M. , Clark, C. M. , Aisen, P. S. , Petersen, R. C. , … Trojanowski, J. Q. (2009). Cerebrospinal fluid biomarker signature in Alzheimer's disease neuroimaging initiative subjects. Annals of Neurology, 65(4), 403–413. 10.1002/ana.21610 [DOI] [PMC free article] [PubMed] [Google Scholar]
- Shidahara, M. , Tsoumpas, C. , Hammers, A. , Boussion, N. , Visvikis, D. , Suhara, T. , … Turkheimer, F. E. (2009). Functional and structural synergy for resolution recovery and partial volume correction in brain PET. NeuroImage, 44(2), 340–348. 10.1016/j.neuroimage.2008.09.012 [DOI] [PubMed] [Google Scholar]
- Shirk, S. D. , Mitchell, M. B. , Shaughnessy, L. W. , Sherman, J. C. , Locascio, J. J. , Weintraub, S. , & Atri, A. (2011). A web‐based normative calculator for the uniform data set (UDS) neuropsychological test battery. Alzheimer's Research & Therapy, 3(6), 32 10.1186/alzrt94 [DOI] [PMC free article] [PubMed] [Google Scholar]
- Sled, J. G. , Zijdenbos, A. P. , & Evans, A. C. (1998). A nonparametric method for automatic correction of intensity nonuniformity in MRI data. IEEE Transactions on Medical Imaging, 17(1), 87–97. 10.1109/42.668698 [DOI] [PubMed] [Google Scholar]
- Smith, R. , Puschmann, A. , Schöll, M. , Ohlsson, T. , van Swieten, J. , Honer, M. , … Hansson, O. (2016). 18F‐AV‐1451 tau PET imaging correlates strongly with tau neuropathology in MAPT mutation carriers. Brain: A Journal of Neurology, 139(9), 2372–2379. https://doi.org/http://dx.doi.org/10.1093/brain/aww163 [DOI] [PMC free article] [PubMed] [Google Scholar]
- Souza, L. C. , de, Corlier, F. , Habert, M.‐O. , Uspenskaya, O. , Maroy, R. , Lamari, F. , …, … Arazin, M. (2011). Similar amyloid‐β burden in posterior cortical atrophy and Alzheimer's disease. Brain, 134(7), 2036–2043. 10.1093/brain/awr130 [DOI] [PubMed] [Google Scholar]
- Tang‐Wai, D. F. , Graff‐Radford, N. R. , Boeve, B. F. , Dickson, D. W. , Parisi, J. E. , Crook, R. , … Petersen, R. C. (2004). Clinical, genetic, and neuropathologic characteristics of posterior cortical atrophy. Neurology, 63(7), 1168–1174. 10.1212/01.WNL.0000140289.18472.15 [DOI] [PubMed] [Google Scholar]
- Thomas, B. A. , Cuplov, V. , Bousse, A. , Mendes, A. , Thielemans, K. , Hutton, B. F. , & Erlandsson, K. (2016). PETPVC: A toolbox for performing partial volume correction techniques in positron emission tomography. Physics in Medicine and Biology, 61(22), 7975 10.1088/0031-9155/61/22/7975 [DOI] [PubMed] [Google Scholar]
- Tohka, J. , & Reilhac, A. (2008). Deconvolution‐based partial volume correction in Raclopride‐PET and Monte Carlo comparison to MR‐based method. NeuroImage, 39(4), 1570–1584. 10.1016/j.neuroimage.2007.10.038 [DOI] [PubMed] [Google Scholar]
- Tom, T. , Cummings, J. L. , & Pollak, J. (1998). Posterior cortical atrophy: Unique features. Neurocase, 4(1), 15–20. 10.1080/13554799808410603 [DOI] [PMC free article] [PubMed] [Google Scholar]
- Tosun, D. , Landau, S. , Aisen, P. S. , Petersen, R. C. , Mintun, M. , Jagust, W. … Alzheimer's Disease Neuroimaging Initiative . (2017). Association between tau deposition and antecedent amyloid‐β accumulation rates in normal and early symptomatic individuals. Brain: A Journal of Neurology, 10.1093/brain/awx046 [DOI] [PubMed] [Google Scholar]
- Tustison, N. J. , Avants, B. B. , Cook, P. A. , Zheng, Y. , Egan, A. , Yushkevich, P. A. , & Gee, J. C. (2010). N4ITK: Improved N3 bias correction. IEEE Transactions on Medical Imaging, 29(6), 1310–1320. 10.1109/TMI.2010.2046908 [DOI] [PMC free article] [PubMed] [Google Scholar]
- Tustison, N. J. , Cook, P. A. , Klein, A. , Song, G. , Das, S. R. , Duda, J. T. , … Avants, B. B. (2014). Large‐scale evaluation of ANTs and FreeSurfer cortical thickness measurements. NeuroImage, 99, 166–179. 10.1016/j.neuroimage.2014.05.044 [DOI] [PubMed] [Google Scholar]
- Verma, M. , & Howard, R. J. (2012). Semantic memory and language dysfunction in early Alzheimer's disease: A review. International Journal of Geriatric Psychiatry, 27(12), 1209–1217. https://doi.org/http://dx.doi.org/10.1002/gps.3766 [DOI] [PubMed] [Google Scholar]
- Villemagne, V. L. , Fodero‐Tavoletti, M. T. , Masters, C. L. , & Rowe, C. C. (2015). Tau imaging: Early progress and future directions. The Lancet. Neurology, 14(1), 114–124. 10.1016/S1474-4422(14)70252‐2 [DOI] [PubMed] [Google Scholar]
- Whitwell, J. L. , Dickson, D. W. , Murray, M. E. , Weigand, S. D. , Tosakulwong, N. , Senjem, M. L. , … Josephs, K. A. (2012). Neuroimaging correlates of pathologically defined subtypes of Alzheimer's disease: A case‐control study. The Lancet Neurology, 11(10), 868–877. 10.1016/S1474-4422(12)70200‐4 [DOI] [PMC free article] [PubMed] [Google Scholar]
- Whitwell, J. L. , Jack, C. R. , Kantarci, K. , Weigand, S. D. , Boeve, B. F. , Knopman, D. S. , … Josephs, K. A. (2007). Imaging Correlates of Posterior Cortical Atrophy. Neurobiology of Aging, 28(7), 1051–1061. 10.1016/j.neurobiolaging.2006.05.026 [DOI] [PMC free article] [PubMed] [Google Scholar]
- Wright, P. , Randall, B. , Clarke, A. , & Tyler, L. K. (2015). The perirhinal cortex and conceptual processing: Effects of feature‐based statistics following damage to the anterior temporal lobes. Neuropsychologia, 76, 192–207. 10.1016/j.neuropsychologia.2015.01.041 [DOI] [PMC free article] [PubMed] [Google Scholar]
- Xia, C. , Makaretz, S. J. , Caso, C. , McGinnis, S. , Gomperts, S. N. , Sepulcre, J. , … Dickerson, B. C. (2017). Association of in vivo [18F]AV‐1451 Tau PET imaging results with cortical atrophy and symptoms in typical and atypical Alzheimer disease. JAMA Neurology, 10.1001/jamaneurol.2016.5755 [DOI] [PMC free article] [PubMed] [Google Scholar]
- Yang, J. , Huang, S. C. , Mega, M. , Lin, K. P. , Toga, A. W. , Small, G. W. , & Phelps, M. E. (1996). Investigation of partial volume correction methods for brain FDG PET studies. IEEE Transactions on Nuclear Science, 43(6), 3322–3327. 10.1109/23.552745 [DOI] [Google Scholar]
- Zhang, W. , Arteaga, J. , Cashion, D. K. , Chen, G. , Gangadharmath, U. , Gomez, L. F. , … Kolb, H. C. (2012). A highly selective and specific PET tracer for imaging of tau pathologies. Journal of Alzheimer's Disease, 31(3), 601–612. 10.3233/JAD-2012-120712 [DOI] [PubMed] [Google Scholar]
Associated Data
This section collects any data citations, data availability statements, or supplementary materials included in this article.
Supplementary Materials
Additional Supporting Information may be found online in the supporting information tab for this article.
Supporting Information