

Abstract
The histologic spectrum of nonalcoholic fatty liver disease (NAFLD) includes fatty liver (NAFL) and steatohepatitis (NASH), which can progress to cirrhosis in up to 20% NASH patients. Bile acids (BA) are linked to pathogenesis and therapy of NASH. We (a) characterized plasma BA profile in biopsy proven NAFL and NASH, and compared to controls, and (b) related plasma BA profile to liver histologic features, disease activity and fibrosis. Liquid chromatography/mass spectrometry quantified BAs. Descriptive statistics, paired and multiple group comparisons, and regression analyses were performed. Eighty six patients (24 controls, 25 NAFL and 37 NASH, mean age 51.8 years and BMI 31.9 kg/m2), 66% were women. Increased total primary BAs and decreased secondary BAs (both p<0.05) characterized NASH. Total conjugated primary BAs were significantly higher in NASH vs. NAFL (p=0.047) and vs. controls (p<0.0001). NASH had higher conjugated to unconjugated chenodeoxycholate (p=0.04), cholate (p=0.0004), and total primary BAs (p<0.0001). Total cholate to chenodeoxycholate ratio was significantly higher in NAFLD without (p=0.005) and with diabetes (p=0.02). Increased key BAs were associated with higher grades of steatosis (taurocholate), lobular (glycocholate) and portal inflammation (taurolithocholate), and hepatocyte ballooning (taurocholate). Conjugated cholate and taurocholate directly and secondary to primary BA ratio inversely correlated to NAFLD Activity Score. A higher ratio of total secondary to primary BA decreased (OR 0.57, p=0.004) and higher conjugated cholate increased the likelihood of significant fibrosis (F≥2) (p=0.007).
Conclusions
NAFLD is associated with significantly altered circulating bile acids composition, likely unaffected by type 2 diabetes, and correlated with histological features of NASH. These observations provide the foundation for future hypothesis-driven studies of specific effects of bile acids on specific aspects of NASH. (Current count = 275)
Keywords: Nonalcoholic steatohepatitis, Nonalcoholic fatty liver disease, Type 2 Diabetes, Bile acids, Farsenoid X receptor, NAFLD activity score, Cyp 7α hydroxylase, Cyp 27α hydroxylase, Insulin resistance, liver fibrosis, hepatic steatosis
INTRODUCTION
Nonalcoholic fatty liver disease (NAFLD) is a common cause of chronic liver disease and is closely associated with insulin resistance and type 2 diabetes mellitus (1). The histological spectrum of NAFLD extends from a fatty liver to steatohepatitis. Nonalcoholic steatohepatitis (NASH) progresses to cirrhosis in 15–20% of subjects over a 15–20 year time frame (2). NASH is projected to become the leading etiology of both hepatocellular cancer and end-stage liver disease requiring liver transplantation (3, 4). The pathogenesis of NASH is incompletely understood and there are currently no approved therapies for NASH.
In recent years, there has been considerable interest in the potential role of bile acids in the development of NASH. Bile acids are derived from cholesterol via a classical cytochrome 7α hydroxylase (Cyp7A) pathway and a mitochondrial cytochrome 27α hydroxylase (Cyp27A) in the liver and secreted in to bile. Upon entry in to the intestine, they assist in lipid emulsification and absorption. Bile acids are also modified by intestinal bacteria and actively reabsorbed from the ileum and undergo several cycles of enterohepatic circulation daily (5). They are further modified after first pass metabolism, largely as conjugates of glycine. Bile acid synthesis from cholesterol is stimulated by activation of the orphan nuclear receptor Liver-X receptor (LXR) and inhibited by their interaction with Farsenoid-X receptor (FXR). Hydrophobic dihydroxylic and monohydroxylic bile acids e.g. chenodeoxycholate and lithocholate respectively are potent activators of FXR and display more active FXR agonistic effects compared to trihydroxylic bile acids such as taurocholate (6, 7).
Over the last decade, bile acids have been shown to play a central role in metabolic homeostasis and affect insulin sensitivity (8, 9). The insulin sensitizing effects of bile acids are mediated via interaction with their receptor FXR. Insulin resistance, the principal risk factor for NAFLD (10), is associated with a shift in the circulating bile acid profile towards a more trihydroxylic one which has weaker FXR agonist effects compared to more hydrophobic bile acids (11, 12). Obeticholic acid (6α ethyl chenodeoxycholic acid) (OCA) is a synthetic bile acid and a potent FXR agonist (13). OCA improves glucose disposal in subjects with type 2 diabetes and the key histological features of NASH (14). These provide a rationale to evaluate the role of bile acids in NAFLD and have been reviewed in depth (15, 16).
Initial studies in subjects with NAFLD provided discrepant results on the total bile acid levels in these subjects; one of these was in subjects undergoing bariatric surgery (17). In the latter study, total bile acids were not increased and no relationship with NAFLD histology was found. This is however discrepant with the larger body of literature in metabolic syndrome (18, 19). There is therefore a need to better characterize the pattern of bile acids, bile acid conjugation and metabolism in various phenotypes of NAFLD and the relationship of these changes to the severity of the liver disease in order to generate hypotheses to better understand the potential role of bile acids in the genesis and progression of NASH, the phenotype that is most likely to progress to cirrhosis.
The objective of this study was therefore to (a) compare and characterize plasma BA profile in NAFL and NASH to controls with no known liver disease, and (b) relate plasma BA profile to liver histology (steatosis, inflammation, hepatocellular ballooning, fibrosis) and disease activity and stage, and (c) evaluate the status of FXR signaling pathway in NAFL and NASH.
MATERIALS AND METHODS
This was a prospective cross-sectional study of the bile acid profile in NAFLD. Subjects with NAFLD were recruited from fatty liver disease and primary care clinics at the author’s institution. All subjects provided informed consent and the study was approved by the Virginia Commonwealth University (VCU) institutional review board (VCU 1960). All of the data were analyzed by the authors who have fully reviewed the data and approve the manuscript.
Two groups of subjects were recruited for these studies. They included subjects with NAFLD and controls without evidence of NAFLD. NAFLD was diagnosed by a liver biopsy in all instances and further categorized as nonalcoholic fatty liver (NAFL) and nonalcoholic steatohepatitis (NASH) based on NASH Clinical Research Network Criteria (20). The plasma samples were obtained in fasted state in the morning within 90 days of the liver biopsy in all cases. Controls had no clinical, biochemical or imaging evidence of fatty liver disease.
High throughput profiling of bile acids was performed using liquid chromatography/mass spectrometry (LC/MS). Bile acid metabolite data in original scale in terms of raw area counts was normalized by median centering. Missing values were imputed with the lower limit of detection for a given metabolite. When ≥30% of values were missing, data were excluded from analyses. The peak and area under the curve for individual analytes were related to validated library standards to compute bile acid levels which are read out as related to these library standards. Proportion of individual bile acids as a function of total bile acids were calculated using total measured scaled imputed values and ratios. Additional details regarding study participants, procedures, liver histologic and fibrosis assessment, bile acid profiling studies, bioinformatics and statistical analyses are provided under supplementary material.
RESULTS
Characteristics of the Study population
Eighty six patients including controls (n=24), NAFL (n=25), and NASH (n=37) were studied. Participants had a mean age of 51.8 years and were predominantly women (66.3%) and obese (mean BMI = 31.9 kg/m2). Patients with NAFL and NASH were older and heavier compared to the controls. A step wise increase in amino alanine transaminase levels was noted from controls to NAFL to NASH (p<0.0001). Also, as expected, subjects with NAFL or NASH had a higher prevalence of metabolic comorbidities (i.e., hypertension, hyperlipidemia and diabetes). The clinical, demographic and histologic details are summarized in Supplemental Table 1 A and B.
The plasma bile acid profile is significantly altered in NASH
Total plasma primary BAs (mean abundance relative to fixed library standard) increased in step wise manner from control to NAFL to NASH (p< 0.04 NASH vs controls) (Fig. 1A). Conversely, a step wise reciprocal decrease in total secondary BAs was observed from controls to NAFL to NASH (Fig. 1A). A heat map display (Fig. 1B) shows the means for each measured plasma BAs in the respective study groups. The plasma 7 α-hydroxy-3-oxo-4-cholestenoic acid (C4) levels were comparable without significant changes among the 3 study groups (supplemental Fig. 1A). The patients with NASH had significantly increased plasma glyco- and taurocholate (GCA and TCA, p<0.05), glyco- and taurochenodeoxycholate (GCDCA and TCDCA, p<0.05), and glyco- and tauroursodeoxycholate (GUDCA and TUDCA, p<0.05). The latter is noteworthy because none of the subjects were taking UDCA as pharmacological therapy. Although 33 subjects were taking a statin; the data for those on statins were qualitatively similar to those not on statins. Further, the results were similar when the group without statins was compared to the whole group including those on statins. The results are therefore shown for the entire group. None of the subjects were taking GLP-1 agonists.
Figure 1. Plasma bile acid profile is significantly altered in NASH.
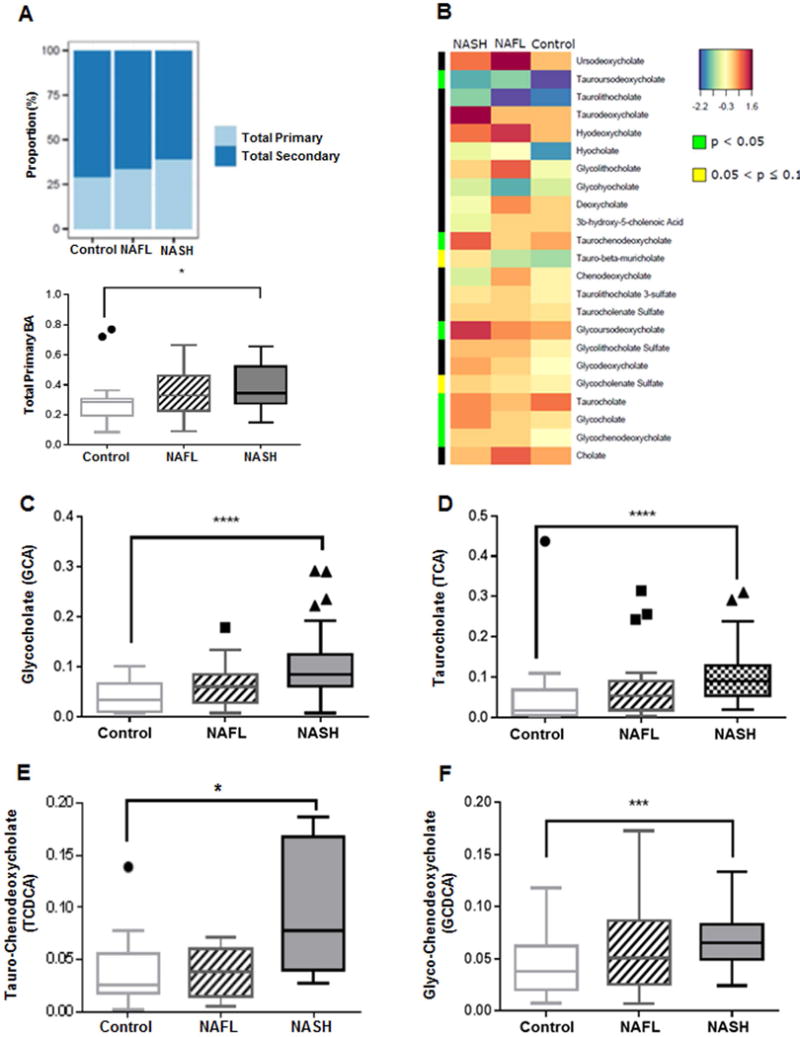
Data represented as box and whiskers Tukey plot with median and staggered outliers. (A) Stack bar plot representing proportion of total primary and secondary BAs, and box and whisker plot for total primary BAs. (B) Heat map display of the spectrum of BA profile across 3 study groups with orange/reds as larger and blue/greens as smaller measurements. The green color on side bar along the left side of the heat map indicates p<0.05. (C–F) Glycine and taurine conjugates of cholate and chenodeoxycholate. BA, bile acid; *p<0.05, ***p<0.001, ****p<0.0001
Plasma Primary Bile Acids Profile in NAFL and NASH
The abundance of cholate (CA) and chenodeoxycholate (CDCA), both measured as relative to a library standard, were not significantly different across the groups although there was a trend for decreased CDCA in NASH (supplemental figure 1B–C). Together, the total primary unconjugated bile acids (CA + CDCA) was not different across the study groups (supplemental Fig. 1D).
Plasma glycocholate (GCA) and taurocholate (TCA) increased in a step wise manner from controls to NAFL to NASH with marked increase in NASH vs. controls (p<0.0001 for both, Fig. 1C and Fig. 1D). Similarly, patients with NASH had significantly higher plasma TCDCA (p=0.05) and GCDCA (p<0.0006) (Fig. 1E and Fig. 1F). While there was only an apparent trend for a stepwise increment in total conjugated CDCA (GCDCA +TCDCA) from controls to NASH (supplemental Fig. 1E), the total conjugated CA was significantly higher in NASH compared to both controls (p< 0.0001) and NAFL (p<0.01) (Fig. 2A). Taken together, the total conjugated primary bile acids (GCA + TCA + GCDCA + TCDCA) was significantly higher in those with NASH compared to NAFL (p<0.047) and controls (p< 0.0001) (Fig. 2B).
Figure 2. Plasma BAs along Primary BA pathway.
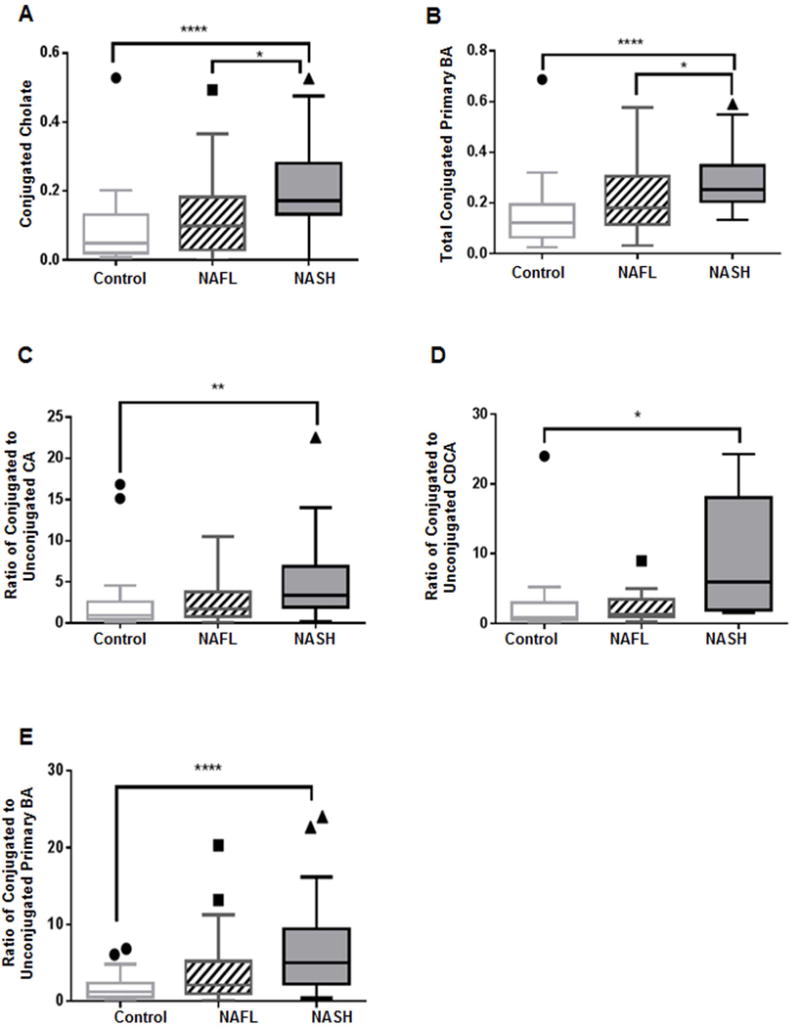
Patients with NASH demonstrate significantly increased (A) conjugated cholate and (B) total conjugated primary BAs. Patients with NASH also demonstrate significantly increased proportions of conjugated to unconjugated (C) cholate (CA), (D) chenodeoxycholate (CDCA), and (E) primary BAs. The BA levels were measured against known internal standards in global metabolomics profile and provides a relative quantitative measure of the BAs relative to the library standards across samples. *p<0.05, **p<0.01, ****p<0.0001; BA, bile acid
Interestingly, there was a step wise increase in the median ratios (0.97 in controls vs. 1.72 in NAFL vs. 3.41 in NASH) of conjugated to unconjugated CA with a marked difference in NASH vs. controls (p=0.0004) (Fig. 2C). Similarly, compared to controls, subjects with NASH had a significantly higher (p=0.04) median ratio (0.88 in controls vs. 1.27 in NAFL vs. 5.95 in NASH) for conjugated to unconjugated CDCA (Fig. 2D). Moreover, the median ratios of total conjugated to unconjugated primary BAs were 1.21 in controls vs. 2.12 in NAFL vs. 5.02 in NASH, which was highly significant for NASH vs. controls (p<0.0001, Fig. 2E).
The median ratios of the total cholate (CA+GCA+TCA) to total chenodeoxycholate (CDCA+GCDCA+TCDCA) were 0.99 in controls vs. 2.63 in NAFL vs. 4.10 in NASH (Fig. 3A) with a statistically significant increase in NASH compared to the controls (p=0.003). Notably, when NAFLD (all subjects with NAFL or NASH) was stratified as with and without diabetes, the median ratios of total cholate to chenodeoxycholate were higher for NAFLD for both without (p=0.005) and with diabetes (p=0.02) compared to the controls (median ratio 0.91 in controls vs. 3.40 in NAFLD without diabetes vs. 3.38 in NAFLD with diabetes, Fig. 3B). These data indicate that the observed changes in NASH cannot be attributed to the underlying diabetes.
Figure 3. Distinct primary and secondary plasma bile acid changes in NAFLD and NASH.
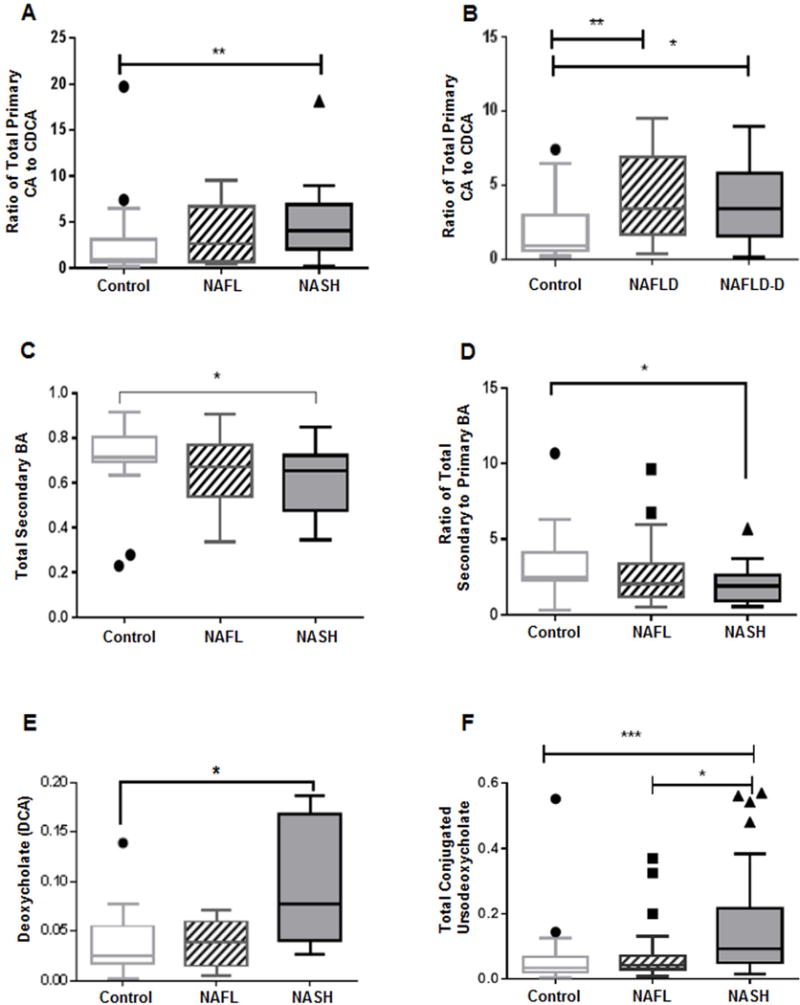
Significantly increased ratio of total primary cholate (CA) to chenodeoxycholate (CDCA) (A) in NASH compared to controls, and (B) in both NAFLD without diabetes and with diabetes vs. controls. (C) secondary BA significantly decreased in NASH. (D) Ratio of secondary to primary BA is significantly lower in NASH. (E) Significantly increased deoxycholate (DCA) in NASH. (F) Patients with NASH had significantly increased conjugated ursodeoxycholate compared to both NAFL and controls. Data represented in box and whisker Tukey plots with medians and staggered outliers. The BA levels were measured against known internal standards in global metabolomics profile and provides a relative quantitative measure of the BAs relative to the library standards across samples. NAFLD-D, NAFLD with diabetes; *p≤0.05, **p<0.01, ***p<0.001
Plasma Secondary Bile Acids Profile in NAFL and NASH
Patients with NASH when compared to controls, had significantly lower total plasma secondary BAs (Fig. 3C, p=0.035) and a resultant significantly lower total secondary to primary BA ratio (Fig. 3D, p=0.03). However, unconjugated deoxycholate (DCA), a secondary BA derived from CA, was higher and approached significance in patients with NASH vs. controls (Fig. 3E, p=0.05). The secondary conjugated BAs glyco- and tauro-deoxycholate (GDCA and TDCA), as well as glyco- and tauro-lithocholate (GLCA and TLCA) were comparable across the three study groups (Supplementary Fig. 2A–D). Similarly, no significant differences were observed for conjugated DCA, conjugated lithocholate (LCA, data not shown) and overall total conjugated secondary BAs among the study groups (Supplementary Fig. 2E–F). The plasma ursodeoxycholate was not significantly different among study groups. In contrast, subjects with NASH had significantly higher conjugated ursodeoxycholate vs. NAFL (p=0.01) and controls (p=0.0005) (Fig. 3F).
Changes in Plasma Bile Acids in NAFLD versus Controls
Taken together, subjects with NAFLD (NAFL or NASH) recapitulated the same trends seen with NASH versus controls noted above. Specifically, the total plasma primary BAs was significantly increased in subjects with NAFLD vs. the controls (p=0.024). A mirror image decrease in the total plasma secondary BAs was present in NAFLD compared to controls (p= 0.024). As a result, the ratio of total plasma secondary BA to primary BA was significantly lower (p=0.024, NAFLD vs. control).
The GCA and TCA levels were significantly higher in patients with NAFLD vs. controls (both p<0.0001). NAFLD was also associated with a significantly increased GCDCA (p=0.0006). The conjugated cholate and total conjugated BAs were also significantly increased in NAFLD (p<0.0001 and p=0.003 respectively). Subjects with NAFLD had a significantly higher hydrophilic trihydroxy-BAs (p=0.01 vs. controls) and lower hydrophobic to hydrophilic ratio (p=0.003 vs. controls).
Plasma Bile Acid Profile is associated with severity of NAFLD
Increase in Trihydroxy-BA are Associated with Severity of Steatosis
Hepatic steatosis was dichotomized as ≤66% (less severe, NASH CRN grades 0–2, n=45) or >66% (severe, n=17, NASH CRN grade 3). The proportion of primary and secondary BAs as represented in stacked bar plot and heat map display comparing the mean log-transformed measurements of BAs in patients with ≤66% vs. >66% steatosis are shown in Fig. 4A–B. The plasma taurocholate was significantly higher in grade 3 vs. lower grades of steatosis (Fig. 4C, p=0.007 on Wilcoxon/Kruskal-Wallis Rank Sums test). On logistic regression analysis, increasing plasma taurocholate increased the likelihood of severe steatosis (range OR for grade 3 steatosis 17.7, CI 1.8–228, FDR p-value=0.01, Fig 4d). In contrast, plasma CDCA was significantly lower in grade 3 vs. lower grades of steatosis (Fig. 4E. P=0.04). Higher grade of steatosis also was associated with significantly increased ratio of conjugated to unconjugated cholate (Fig. 4F, p=0.048)
Figure 4. Plasma bile acid associations with hepatic steatosis in NAFLD.
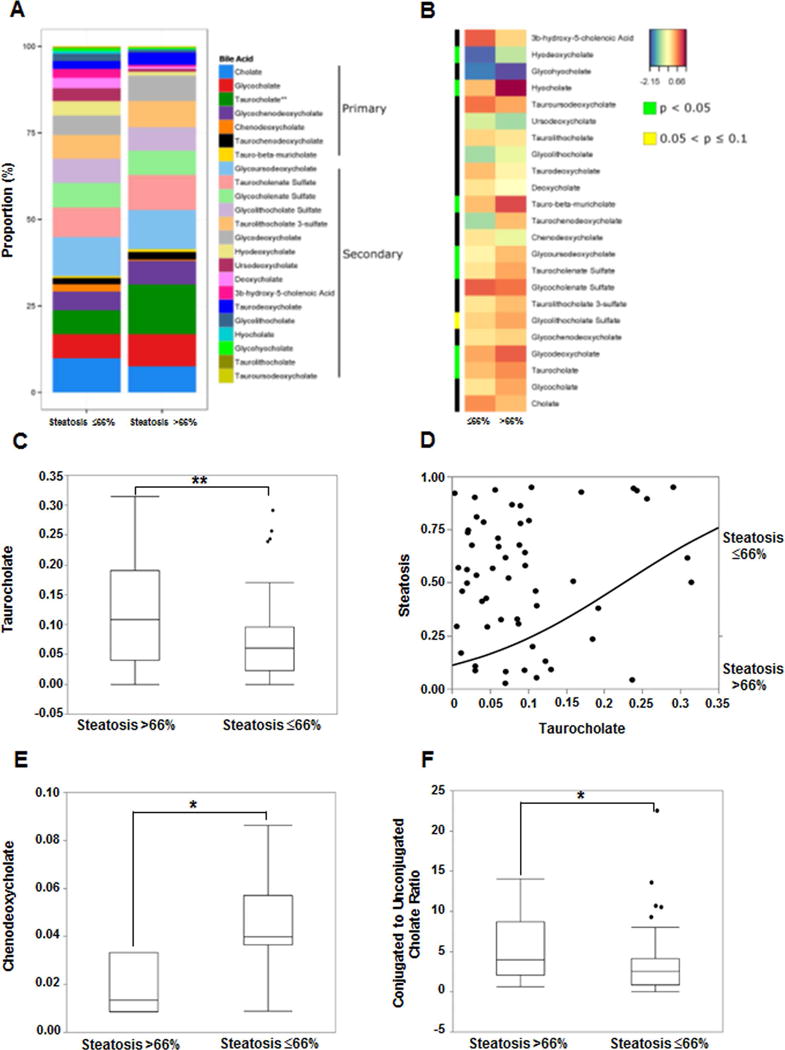
Data for hepatic steatosis on liver histology dichotomized to ≤66% and >66%. (A) The stacked bar plots reflect mean measured bile acids with significant increase in taurocholate in steatosis>66%. (B) Heat map display of BA profile for steatosis ≤66% vs. >66% with orange/reds indicating larger and blue/greens as smaller measurements. The green color on side bar along the left side of the heat map indicates p<0.05. (C) Subjects with steatosis >66% had significantly higher taurocholate. (D) Increasing taurocholate increased the probability of >66% steatosis on nominal logistic regression. (E) Decreased chenodeoxycholate was associated with steatosis >66%. (F) Subjects with steatosis >66% had higher ratio of conjugated to unconjugated cholate. The BA levels were measured against known internal standards in global metabolomics profile and provides a relative quantitative measure of the BAs relative to the library standards across samples.
There is a Differential Effect of Primary versus Secondary Bile Acids on Severity of Lobular and Portal Inflammation (Fig. 5)
Figure 5. Plasma bile acid associations with lobular inflammation and hepatocyte ballooning in NAFLD.
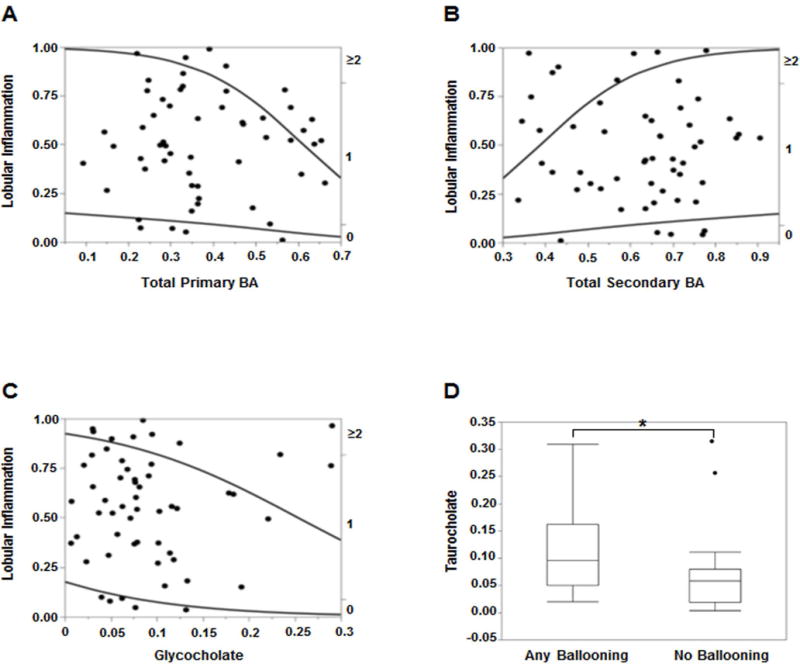
Higher degree of lobular inflammation (≥2) was more likely with increasing (A) total primary BAs and (C) glycocholate, and (B) less likely with secondary BAs on nominal logistic regression. (D) Presence of hepatocyte ballooning was associated with significantly higher levels of taurocholate. The BA levels were measured against known internal standards in global metabolomics profile and provides a relative quantitative measure of the BAs relative to the library standards across samples.
Lobular inflammation (LI) was graded from 0 to 3 using the NASH CRN protocol (20). Increasing total primary BAs (Fig. 5A) and decreasing total secondary BAs (Fig. 5B) significantly increased the probability of LI grade ≥2 vs. lower grades of LI (R2=0.10, p=0.006) on ordinal logistic regression analysis. Increasing glycocholate (GCA) significantly increased the likelihood of LI grade ≥2 (R2=0.05, p=0.034, Fig. 5C). On ordinal multiple regression analyses with all major BAs included in the model, decreasing plasma taurodeoxycholate (TDCA) and increasing taurolithocholate (TLCA) significantly increased the likelihood (R2=0.28, p=0.015 for TDCA and p=0.046 for TLCA) of higher grades of portal inflammation.
Plasma Primary and Secondary Bile Acids are Both Related to Hepatocyte Ballooning
The hepatocyte ballooning grades 0 to 2 were dichotomized for analysis purposes into no ballooning and any grade of ballooning. A significantly higher plasma TCA was seen in patients with any grade of ballooning compared to those without hepatocyte ballooning (Fig. 5D, p=0.017). On nominal logistic multiple regression analyses several BAs showed a significantly higher likelihood of hepatocyte ballooning with FDR logworth p-values for GCA (=0.026), TCA (=0.006), GCDCA (=0.003), DCA and GLCA (=0.001 for both).
An Increase in Primary Bile Acids is Directly Related to the NAFLD Activity Score (NAS) (Fig 6)
Figure 6. Plasma bile acid associations with NAFLD Activity Score (NAS).
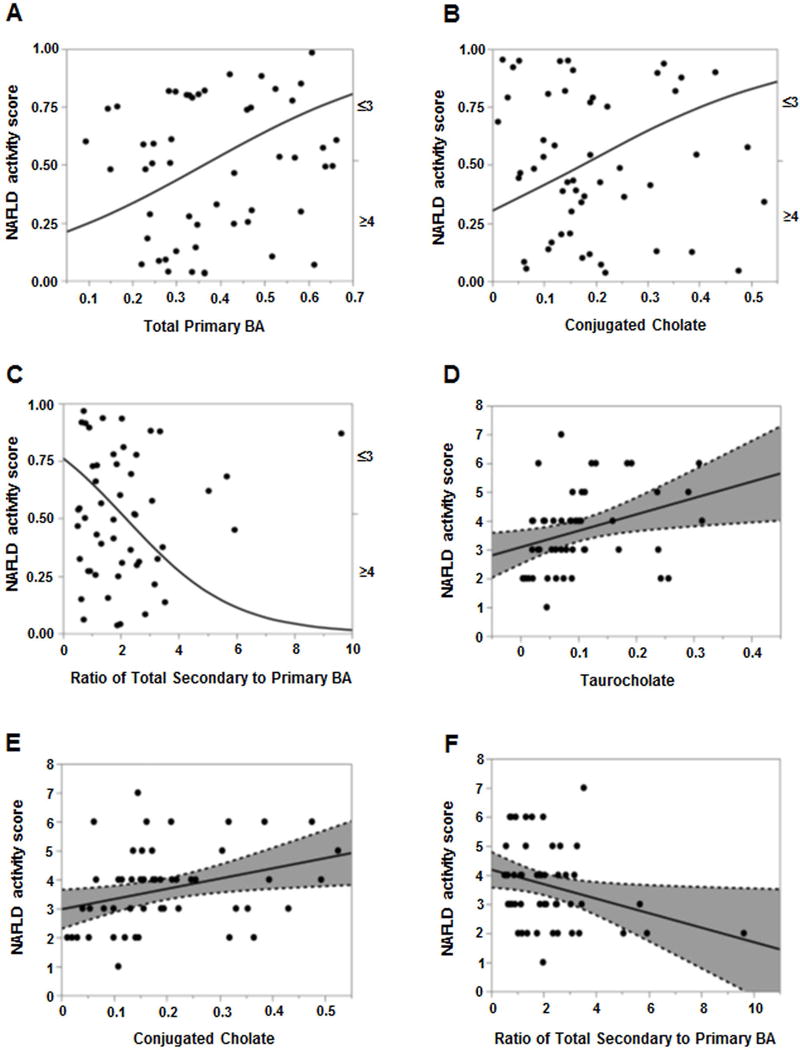
For panels A–C. The probability of NAS ≥4 was significantly higher with increasing (A) total primary BAs and (B) conjugated cholate. (C) Increasing ratio of total secondary to primary BAs significantly decreased the likelihood of NAS ≥4. For panels D–F, least square regression analyses for NAS as a continuous variable (0–8) revealed direct association with increasing NAS score and higher (D) taurocholate and (E) conjugated cholate, and (F) inverse relation to total secondary to primary BAs ratio. The BA levels were measured against known internal standards in global metabolomics profile and provides a relative quantitative measure of the BAs relative to the library standards across samples.
The NAFLD Activity Score (NAS) was analyzed first as a dichotomous (NAS ≤3 vs. ≥4) variable. Plasma taurocholate (TCA) was significantly higher in patients with NAS ≥4 vs. ≤3 (Supplemental Fig 3a, p=0.017). Increasing total primary BAs was associated with higher likelihood of NAS ≥4 (Fig. 6A, p=0.04, range OR=11, 95% CI 1.2–133). Similarly, a significantly higher probability of NAS ≥4 (R2=0.05, p=0.04) was observed with increasing total conjugated cholate (GCA+TCA) (Fig. 6B). Conversely, increasing ratio of total secondary to primary BA decreased the odds of NAS ≥4 by 42% (OR 0.58, 95% CI 0.3–0.9, p=0.01, Fig 6C).
Upon least square regression analyses for NAS as a continuous variable (0–8), increasing plasma taurocholate (TCA) and conjugated cholate (GCA+TCA) were directly related to NAS (R2=0.11, p=0.01 and R2=0.10, p=0.02, respectively, Fig. 6D–E). In contrast, the secondary to primary BA ratio was inversely related (R2=0.08, p=0.03) to the NAS (Fig 6f).
Plasma Bile Acid Profile and Relationship with Fibrosis (Fig. 7)
Figure 7. Plasma bile acid associations with fibrosis in NAFLD.
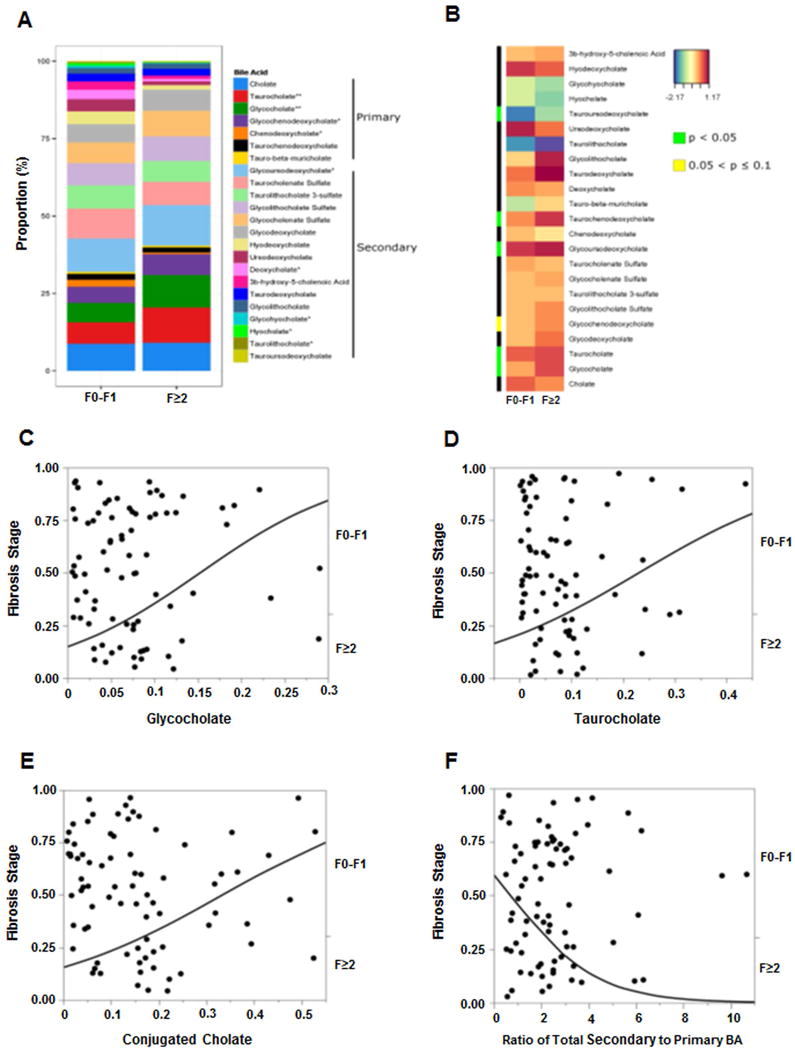
Data represented for fibrosis dichotomized as F0-F1 and F≥2. (A) The stacked bar plot reflects mean bile acids with several significant changes associated with F≥2 fibrosis stage, most notably increased taurocholate and glycocholate. (B) Heat map display of BA profile for fibrosis stage F0-F1 vs. F≥2 with orange/reds indicating larger and blue/greens as smaller measurements. The green color on side bar along the left side of the heat map indicates p<0.05. For panels C–E, the probability of F≥2 was significantly higher on nominal logistic regression with increasing (C) glycocholate, (D) taurocholate, and (E) conjugated cholate. (F) Increasing total secondary to primary BAs ratio had lower likelihood of F≥2 fibrosis. The BA levels were measured against known internal standards in global metabolomics profile and provides a relative quantitative measure of the BAs relative to the library standards across samples.
The profile of plasma bile acids in those with clinically significant fibrosis (F2 and higher) versus lower stages and heat map display are shown in Fig. 7A–B. Patients with clinically significant fibrosis (F≥2) had significantly higher plasma glycocholate (supplementary Fig. 3B, GCA, p=0.003) and taurocholate (supplementary Fig. 3C, TCA, p=0.001). Increasing GCA, TCA and total conjugated cholate (GCA+TCA) was directly associated with an increased likelihood of clinically significant fibrosis (F≥2) [Fig. 7C–E, R2=0.08, p=0.005; R2=0.04, p=0.036; and R2=0.07, p=0.007, respectively]. In contrast, the probability of clinically significant fibrosis (F≥2) was significantly lower and decreased by 43% with increasing ratio of total secondary to primary BA (Fig. 7F, R2=0.08, OR 0.57, 95%CI 0.34–0.85, p=0.004).
NAFLD is associated with decreased FXR expression and signaling
The status of FXR signaling was assessed from fasting fibroblast growth factor 19 (FGF19) levels and hepatic mRNA expression of several FXR targets such as small heterodimer partner (SHP), bile salt export pump (BSEP) and the phospholipid transport protein (PLTP), which all showed a decreasing trend, and a significantly increased Cyp7A1 (Supplementary Fig. 4). In keeping with decreased FXR signaling in the liver, fasting FGF-19 levels also tended to decrease in subjects with NASH with stage 2 fibrosis onwards.
The plasma bile acid profile in histologically defined NASH and NAFL compared to the controls are summarized in Figure 8.
Figure 8. Summary of changes in plasma bile acid profile in NASH.
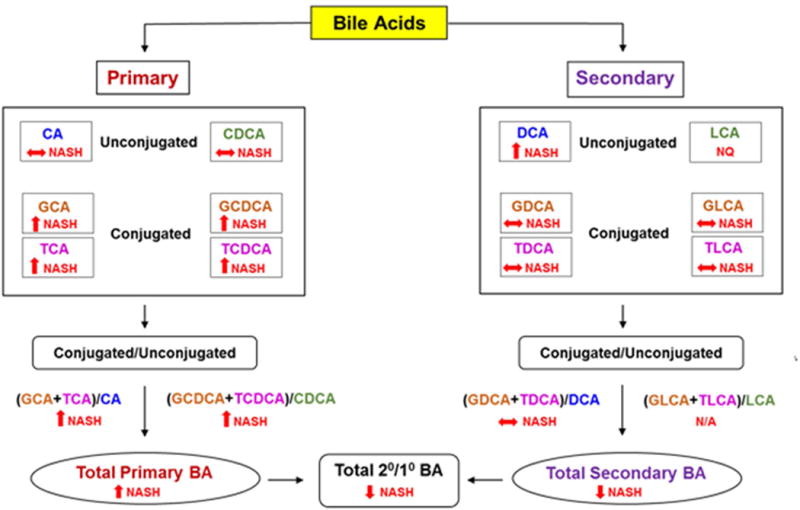
BA, Bile acid; CA, cholate; CDCA; chenodeoxycholate; DCA, deoxycholate; GCA, glycocholate; GCDCA, glycochenodeoxycholate; GDCA, glycodeoxycholate; GLCA, glycolithocholate; TCA, taurocholate; TCDCA, taurochenodeoxycholate; TDCA, taurodeoxycholate; TLCA, taurolithocholate; NASH, nonalcoholic steatohepatitis; 2°/1°, secondary to primary. ↑, significantly increased; ↓, significantly decreased; ↔ no significant change.
DISCUSSION
There is growing interest in the role of bile acids in the genesis and progression of NASH. In this study, multiple abnormalities in the profile of circulating bile acids in subjects with NAFL and NASH are described. Importantly, several associations with the histological phenotype and severity of the disease were identified. While these data do not reflect causality, these do provide the foundation for future hypothesis-driven studies of specific effects of bile acids on specific aspects of NASH.
A key finding is an increase in total primary bile acids in subjects with both NAFL and NASH with the findings in NASH reaching statistical significance. This could be due to either increased synthesis of primary bile acids and/or decreased conversion to secondary bile acids in the intestine. An elevated Cyp7A expression level along with statistically non-significantly altered C4 levels suggests that bile acid synthesis is largely intact. Furthermore, the increase in conjugated GCDCA and TCDCA indicate the mitochondrial Cyp27A pathway is still intact in NASH. A decrease in bile excretion, supported by the observation of decreased BSEP, is another potential reason for increased circulating levels of primary bile acids but do not explain why secondary bile acids are decreased.
An alternate possibility is that a decrease in intestinal dehydroxylation of primary bile acids and reduced formation of secondary bile acids results in enhanced primary bile acid synthesis. These functions are dependent on the intestinal microbiota and have been extensively characterized (21–23). Another conceivable reason for increased plasma primary conjugated bile acids in NASH may be due to decreased enterohepatic circulation and/or a decrease in small intestinal bacteria capable of deconjugating primary bile acids. While changes in the intestinal microbiome have been reported in NASH (24–27), they do not yet provide mechanistic information regarding the linkage of these changes with development of NASH. Specifically, the changes in the bile-acid metabolizing microbiome are not well described and need to be characterized as a research priority in this field. It is interesting to note the increase in conjugated UDCA even in the absence of exogenous intake that most likely reflects intestinal conversion of the excess TCDCA and GCDCA to their respective UDCA conjugates. These changes suggest that with more severe forms of fatty liver disease such as NASH, there is a shift towards more hydrophilic forms of bile acids i.e., UDCA conjugates (28) to mitigate bile acid mediated hepatotoxicity.
From a functional point of view, the increase in total CA versus CDCA is likely to be highly relevant to the development of NASH. CA and its conjugates are less potent agonists for FXR compared to CDCA and its conjugates (7). This would be expected to promote insulin resistance, a hallmark of prototypical NASH (10). CDCA and its conjugates are also more potent ligands for intestinal TGR5 receptors on L cells (29). Upon activation of TGR5 receptors, L cells release GLP-1 which has pleiotropic effects in NASH including increased insulin sensitivity and promoting beta cell function(30, 31) (32, 33). Insulin resistance and the combination of increased free fatty acid delivery to the liver and also increased de novo lipogenesis are both involved in the genesis of a fatty liver (10, 34). It is therefore not surprising that higher levels of conjugated CA are associated with greater insulin resistance and hepatic steatosis in this study.
A novel and potentially important finding is that the changes in the bile acid profile are most severe in those with NASH and regardless of the presence of diabetes in NAFLD. In prior studies of changes in bile acids in those with diabetes, there was no systematic assessment of underlying presence, phenotype or severity of NASH (11, 12, 35, 36). These observations raise the possibility that such changes occur early and reflect a maladaptive hepatic response to increased lipid and carbohydrate load to hepatocytes with further worsening insulin resistance, thereby setting the stage for eventual development of type 2 diabetes. If so, this would provide a potential explanation for the known increased risk of development of type 2 diabetes mellitus in those with NASH without diabetes (18). Formal testing of this hypothesis will require either longitudinal assessments in cohorts with well-defined clinical and hepatic phenotyping along with bile acid measurements or assessment in animal models of NASH that are relevant to human disease.
The relationship of conjugates of cholate with the NAS indicate that bile acids contribute to disease activity but the mechanisms underlying the individual disease components may or may not be identical. It is interesting to note the differential relationship between primary and secondary bile acids with respect to lobular versus portal inflammation respectively. The mechanistic basis for this is not yet known; the possibility that these reflect metabolic zonation within the liver and changes in the micro-environment with altered bile acid profile is a logical possibility worth exploration in future studies. However, in contrast to these findings, both primary and secondary bile acids were related to presence of hepatocyte ballooning a marker of cell injury (37). The low false discovery rates indicate that these are indeed robust and real findings. There is indeed a plethora of literature on the cytotoxic effects of bile acids which represent the most likely explanation for these findings.
The relationship between conjugated cholate with the fibrosis stage are also novel and very noteworthy. As previously noted, these bile acid species are not strong FXR agonists (7). However, the decrease in secondary bile acids, the natural endogenous agonists of FXR, and their inverse relationship to fibrosis stage coupled with the anti-fibrotic effects of the FXR agonist OCA suggest that decreased FXR signaling is likely to be important in disease progression in NASH. What is less clear is if this is a direct effect on hepatic stellate cells given the current controversy about the expression (or lack thereof) of FXR on these cells (38). An alternate explanation could be related to the observed relationship of CA and its conjugates on hepatocellular injury, ballooning and inflammation which are proximal drivers of stellate cell activation. In that case, an increase in secondary bile acids or use of FXR agonists could reverse this pathophysiological cascade. Together, they provide a biologically plausible model for the role of bile acids in fibrosis progression in NASH.
In summary, we have demonstrated significant changes in composition of circulating bile acids in NAFLD with the greatest changes in NASH. These changes occur even in the absence of type 2 diabetes and are associated with the histological features of NASH. While these findings are correlative, they provide the foundational basis for development of future focused mechanistic hypothesis in the future which can be further leveraged to treat the condition.
Supplementary Material
Acknowledgments
Role in study:
|
| |||||
| Name | Design | Performance | Analysis | Write up | COI |
|
| |||||
| Puneet Puri | + | + | + | + | No |
|
| |||||
| Kalyani Daita | + | + | No | ||
|
| |||||
| Andrew Joyce | + | + | + | * | |
|
| |||||
| Faridoddin Mirshahi | + | + | * | ||
|
| |||||
| Velimir Luketic | + | * | |||
|
| |||||
| Michael Idowu | + | No | |||
|
| |||||
| Melissa Contos | + | No | |||
|
| |||||
| Mohammed Siddiqui | + | * | |||
|
| |||||
| Sherry Boyett | + | No | |||
|
| |||||
| Hae-Ki Min | + | No | |||
|
| |||||
| Divya P. Kumar | + | No | |||
|
| |||||
| Sophie Cazanave | + | No | |||
|
| |||||
| Prasanna K. Santdekadur, | + | No | |||
|
| |||||
| Rohit Kohli | + | * | |||
|
| |||||
| Huiping Zhou | + | No | |||
|
| |||||
| Phillip B. Hylemon | + | No | |||
|
| |||||
| Arun J. Sanyal | + | + | + | + | * |
|
| |||||
Sources of funding support:
R01 DK 10596-01 to Dr. Arun Sanyal
K23 AA 021179 to Dr. Puneet Puri
CTSA grant UL1 TR000058
R01 DK100314 to Dr. Rohit Kohli
Abbreviations
- ANOVA
Analysis of variance
- AST
aspartate aminotransferase
- ALT
alanine aminotransferase
- BA
Bile acid
- BSEP
Bile Salt Export Pump
- CA
cholate
- CDCA
chenodeoxycholate
- Cyp7A
cytochrome 7α hydroxylase
- Cyp27A
cytochrome 27α hydroxylase
- DCA
deoxycholate
- ESI
electrospray ionization
- FDR
false discovery rate
- FGF19
Fibroblast Growth Factor 19
- FXR
Farsenoid-X receptor
- GAPDH
Glyceraldehyde 3-phosphate dehydrogenase
- GCA
glycocholate
- GCDCA
glycochenodeoxycholate
- GDCA
glycodeoxycholate
- GLCA
glycolithocholate
- GUDCA
glycoursodeoxycholate
- LI
lobular inflammation
- LIT
linear ion-trap
- LXR
Liver-X receptor
- LC/MS
liquid chromatography/mass spectrometry
- NAFLD
Nonalcoholic fatty liver disease
- NAFL
Nonalcoholic fatty liver
- NASH
nonalcoholic steatohepatitis
- NASH CRN
NASH Clinical Research Network
- NAS
NAFLD Activity Score
- OCA
Obeticholic acid (6α ethyl chenodeoxycholic acid)
- PLTP
Phospholipid transfer protein
- SHP
small heterodimer partner
- TCA
taurocholate
- TCDCA
taurochenodeoxycholate
- TDCA
taurodeoxycholate
- TLCA
taurolithocholate
- TUDCA
tauroursodeoxycholate
- UDCA
ursodeoxycholate
Footnotes
Conflicts of Interest:
None: Drs. Puri, Min, Zhou, Hylemon, Santhekadur, Cazanave, Kumar & Ms. Boyett
*Dr. Andrew Joyce: No relevant conflicts. He is Chief Scientific Officer and has an ownership interest in Venebio, based in Richmond
*Faridoddin Mirshahi: No relevant conflicts. Ownership interest in Sanyal Biotechnologies
*Dr. Velimir Luketic: No relevant conflicts. Received grant support from Intercept, Genfit.
*Dr. Mohammed Siddiqui: No relevant conflicts. He has received grant support from Nusirt, Immuron and Taiwan J Pharmaceuticals.
*Dr. Rohit Kohli: No relevant conflicts. He has received grant support/speaker fees from Intercept, Galectin, Raptor, and Shire.
*Dr. Arun Sanyal: None for this project. Dr. Sanyal is President of Sanyal Biotechnology and has stock options in Genfit. He has served as a consultant to AbbVie, Astra Zeneca, Nitto Denko, Nimbus, Salix, Tobira, Takeda, Fibrogen, Lilly, Zafgen, Novartis, Pfizer, Immuron, Exhalenz and Genfit. He has been an unpaid consultant to Intercept, Echosens, Immuron, Amarin, Ardelyx, Fractyl, Syntlogic, Nordic Bioscience and Bristol Myers Squibb. His institution has received grant support from Gilead, Salix, Tobira, Intercept, Merck, Astra Zeneca and Novartis.
References
- 1.Rinella ME. Nonalcoholic fatty liver disease: a systematic review. JAMA. 2015;313:2263–2273. doi: 10.1001/jama.2015.5370. [DOI] [PubMed] [Google Scholar]
- 2.Matteoni CA, Younossi ZM, Gramlich T, Boparai N, Liu YC, McCullough AJ. Nonalcoholic fatty liver disease: a spectrum of clinical and pathological severity. Gastroenterology. 1999;116:1413–1419. doi: 10.1016/s0016-5085(99)70506-8. [DOI] [PubMed] [Google Scholar]
- 3.Wong RJ, Aguilar M, Cheung R, Perumpail RB, Harrison SA, Younossi ZM, Ahmed A. Nonalcoholic steatohepatitis is the second leading etiology of liver disease among adults awaiting liver transplantation in the United States. Gastroenterology. 2015;148:547–555. doi: 10.1053/j.gastro.2014.11.039. [DOI] [PubMed] [Google Scholar]
- 4.White DL, Kanwal F, El-Serag HB. Association between nonalcoholic fatty liver disease and risk for hepatocellular cancer, based on systematic review. Clin Gastroenterol Hepatol. 2012;10:1342–1359 e1342. doi: 10.1016/j.cgh.2012.10.001. [DOI] [PMC free article] [PubMed] [Google Scholar]
- 5.Ridlon JM, Kang DJ, Hylemon PB. Bile salt biotransformations by human intestinal bacteria. J Lipid Res. 2006;47:241–259. doi: 10.1194/jlr.R500013-JLR200. [DOI] [PubMed] [Google Scholar]
- 6.Schaap FG, Trauner M, Jansen PL. Bile acid receptors as targets for drug development. Nat Rev Gastroenterol Hepatol. 2014;11:55–67. doi: 10.1038/nrgastro.2013.151. [DOI] [PubMed] [Google Scholar]
- 7.Makishima M, Okamoto AY, Repa JJ, Tu H, Learned RM, Luk A, Hull MV, et al. Identification of a nuclear receptor for bile acids. Science. 1999;284:1362–1365. doi: 10.1126/science.284.5418.1362. [DOI] [PubMed] [Google Scholar]
- 8.Kuipers F, Bloks VW, Groen AK. Beyond intestinal soap–bile acids in metabolic control. Nat Rev Endocrinol. 2014;10:488–498. doi: 10.1038/nrendo.2014.60. [DOI] [PubMed] [Google Scholar]
- 9.Mudaliar S, Henry RR, Sanyal AJ, Morrow L, Marschall HU, Kipnes M, Adorini L, et al. Efficacy and safety of the farnesoid X receptor agonist obeticholic acid in patients with type 2 diabetes and nonalcoholic fatty liver disease. Gastroenterology. 2013;145:574–582 e571. doi: 10.1053/j.gastro.2013.05.042. [DOI] [PubMed] [Google Scholar]
- 10.Sanyal AJ, Campbell-Sargent C, Mirshahi F, Rizzo WB, Contos MJ, Sterling RK, Luketic VA, et al. Nonalcoholic steatohepatitis: association of insulin resistance and mitochondrial abnormalities. Gastroenterology. 2001;120:1183–1192. doi: 10.1053/gast.2001.23256. [DOI] [PubMed] [Google Scholar]
- 11.Haeusler RA, Astiarraga B, Camastra S, Accili D, Ferrannini E. Human insulin resistance is associated with increased plasma levels of 12alpha-hydroxylated bile acids. Diabetes. 2013;62:4184–4191. doi: 10.2337/db13-0639. [DOI] [PMC free article] [PubMed] [Google Scholar]
- 12.Haeusler RA, Pratt-Hyatt M, Welch CL, Klaassen CD, Accili D. Impaired generation of 12-hydroxylated bile acids links hepatic insulin signaling with dyslipidemia. Cell Metab. 2012;15:65–74. doi: 10.1016/j.cmet.2011.11.010. [DOI] [PMC free article] [PubMed] [Google Scholar]
- 13.Pellicciari R, Fiorucci S, Camaioni E, Clerici C, Costantino G, Maloney PR, Morelli A, et al. 6alpha-ethyl-chenodeoxycholic acid (6-ECDCA), a potent and selective FXR agonist endowed with anticholestatic activity. J Med Chem. 2002;45:3569–3572. doi: 10.1021/jm025529g. [DOI] [PubMed] [Google Scholar]
- 14.Neuschwander-Tetri BA, Loomba R, Sanyal AJ, Lavine JE, Van Natta ML, Abdelmalek MF, Chalasani N, et al. Farnesoid X nuclear receptor ligand obeticholic acid for non-cirrhotic, non-alcoholic steatohepatitis (FLINT): a multicentre, randomised, placebo-controlled trial. Lancet. 2015;385:956–965. doi: 10.1016/S0140-6736(14)61933-4. [DOI] [PMC free article] [PubMed] [Google Scholar]
- 15.Arab JP, Karpen SJ, Dawson PA, Arrese M, Trauner M. Bile acids and nonalcoholic fatty liver disease: Molecular insights and therapeutic perspectives. Hepatology. 2017;65:350–362. doi: 10.1002/hep.28709. [DOI] [PMC free article] [PubMed] [Google Scholar]
- 16.Copple BL, Li T. Pharmacology of bile acid receptors: Evolution of bile acids from simple detergents to complex signaling molecules. Pharmacol Res. 2016;104:9–21. doi: 10.1016/j.phrs.2015.12.007. [DOI] [PMC free article] [PubMed] [Google Scholar]
- 17.Bechmann LP, Kocabayoglu P, Sowa JP, Sydor S, Best J, Schlattjan M, Beilfuss A, et al. Free fatty acids repress small heterodimer partner (SHP) activation and adiponectin counteracts bile acid-induced liver injury in superobese patients with nonalcoholic steatohepatitis. Hepatology. 2013;57:1394–1406. doi: 10.1002/hep.26225. [DOI] [PubMed] [Google Scholar]
- 18.Zeller G, Tap J, Voigt AY, Sunagawa S, Kultima JR, Costea PI, Amiot A, et al. Potential of fecal microbiota for early-stage detection of colorectal cancer. Mol Syst Biol. 2014;10:766. doi: 10.15252/msb.20145645. [DOI] [PMC free article] [PubMed] [Google Scholar]
- 19.Lefebvre P, Cariou B, Lien F, Kuipers F, Staels B. Role of bile acids and bile acid receptors in metabolic regulation. Physiol Rev. 2009;89:147–191. doi: 10.1152/physrev.00010.2008. [DOI] [PubMed] [Google Scholar]
- 20.Kleiner DE, Brunt EM, Van Natta M, Behling C, Contos MJ, Cummings OW, Ferrell LD, et al. Design and validation of a histological scoring system for nonalcoholic fatty liver disease. Hepatology. 2005;41:1313–1321. doi: 10.1002/hep.20701. [DOI] [PubMed] [Google Scholar]
- 21.Hirano S, Masuda N. Enhancement of the 7 alpha-dehydroxylase activity of a gram-positive intestinal anaerobe by Bacteroides and its significance in the 7-dehydroxylation of ursodeoxycholic acid. J Lipid Res. 1982;23:1152–1158. [PubMed] [Google Scholar]
- 22.Ridlon JM, Hylemon PB. Identification and characterization of two bile acid coenzyme A transferases from Clostridium scindens, a bile acid 7alpha-dehydroxylating intestinal bacterium. J Lipid Res. 2012;53:66–76. doi: 10.1194/jlr.M020313. [DOI] [PMC free article] [PubMed] [Google Scholar]
- 23.Bhowmik S, Chiu HP, Jones DH, Chiu HJ, Miller MD, Xu Q, Farr CL, et al. Structure and functional characterization of a bile acid 7alpha dehydratase BaiE in secondary bile acid synthesis. Proteins. 2016;84:316–331. doi: 10.1002/prot.24971. [DOI] [PMC free article] [PubMed] [Google Scholar]
- 24.Boursier J, Mueller O, Barret M, Machado M, Fizanne L, Araujo-Perez F, Guy CD, et al. The severity of nonalcoholic fatty liver disease is associated with gut dysbiosis and shift in the metabolic function of the gut microbiota. Hepatology. 2016;63:764–775. doi: 10.1002/hep.28356. [DOI] [PMC free article] [PubMed] [Google Scholar]
- 25.Raman M, Ahmed I, Gillevet PM, Probert CS, Ratcliffe NM, Smith S, Greenwood R, et al. Fecal microbiome and volatile organic compound metabolome in obese humans with nonalcoholic fatty liver disease. Clin Gastroenterol Hepatol. 2013;11:868–875. e861–863. doi: 10.1016/j.cgh.2013.02.015. [DOI] [PubMed] [Google Scholar]
- 26.Wang B, Jiang X, Cao M, Ge J, Bao Q, Tang L, Chen Y, et al. Altered Fecal Microbiota Correlates with Liver Biochemistry in Nonobese Patients with Non-alcoholic Fatty Liver Disease. Sci Rep. 2016;6:32002. doi: 10.1038/srep32002. [DOI] [PMC free article] [PubMed] [Google Scholar]
- 27.Mouzaki M, Wang AY, Bandsma R, Comelli EM, Arendt BM, Zhang L, Fung S, et al. Bile Acids and Dysbiosis in Non-Alcoholic Fatty Liver Disease. PLoS One. 2016;11:e0151829. doi: 10.1371/journal.pone.0151829. [DOI] [PMC free article] [PubMed] [Google Scholar]
- 28.Ferslew BC, Xie G, Johnston CK, Su M, Stewart PW, Jia W, Brouwer KL, et al. Altered Bile Acid Metabolome in Patients with Nonalcoholic Steatohepatitis. Dig Dis Sci. 2015;60:3318–3328. doi: 10.1007/s10620-015-3776-8. [DOI] [PMC free article] [PubMed] [Google Scholar]
- 29.Kawamata Y, Fujii R, Hosoya M, Harada M, Yoshida H, Miwa M, Fukusumi S, et al. A G protein-coupled receptor responsive to bile acids. J Biol Chem. 2003;278:9435–9440. doi: 10.1074/jbc.M209706200. [DOI] [PubMed] [Google Scholar]
- 30.Katsuma S, Hirasawa A, Tsujimoto G. Bile acids promote glucagon-like peptide-1 secretion through TGR5 in a murine enteroendocrine cell line STC-1. Biochem Biophys Res Commun. 2005;329:386–390. doi: 10.1016/j.bbrc.2005.01.139. [DOI] [PubMed] [Google Scholar]
- 31.Thomas C, Gioiello A, Noriega L, Strehle A, Oury J, Rizzo G, Macchiarulo A, et al. TGR5-mediated bile acid sensing controls glucose homeostasis. Cell Metab. 2009;10:167–177. doi: 10.1016/j.cmet.2009.08.001. [DOI] [PMC free article] [PubMed] [Google Scholar]
- 32.Hansen M, Scheltema MJ, Sonne DP, Hansen JS, Sperling M, Rehfeld JF, Holst JJ, et al. Effect of chenodeoxycholic acid and the bile acid sequestrant colesevelam on glucagon-like peptide-1 secretion. Diabetes Obes Metab. 2016;18:571–580. doi: 10.1111/dom.12648. [DOI] [PubMed] [Google Scholar]
- 33.Kumar DP, Rajagopal S, Mahavadi S, Mirshahi F, Grider JR, Murthy KS, Sanyal AJ. Activation of transmembrane bile acid receptor TGR5 stimulates insulin secretion in pancreatic beta cells. Biochem Biophys Res Commun. 2012;427:600–605. doi: 10.1016/j.bbrc.2012.09.104. [DOI] [PMC free article] [PubMed] [Google Scholar]
- 34.Donnelly KL, Smith CI, Schwarzenberg SJ, Jessurun J, Boldt MD, Parks EJ. Sources of fatty acids stored in liver and secreted via lipoproteins in patients with nonalcoholic fatty liver disease. J Clin Invest. 2005;115:1343–1351. doi: 10.1172/JCI23621. [DOI] [PMC free article] [PubMed] [Google Scholar]
- 35.Dutia R, Embrey M, O’Brien CS, Haeusler RA, Agenor KK, Homel P, McGinty J, et al. Temporal changes in bile acid levels and 12alpha-hydroxylation after Roux-en-Y gastric bypass surgery in type 2 diabetes. Int J Obes (Lond) 2015;39:806–813. doi: 10.1038/ijo.2015.1. [DOI] [PMC free article] [PubMed] [Google Scholar]
- 36.Wewalka M, Patti ME, Barbato C, Houten SM, Goldfine AB. Fasting serum taurine-conjugated bile acids are elevated in type 2 diabetes and do not change with intensification of insulin. J Clin Endocrinol Metab. 2014;99:1442–1451. doi: 10.1210/jc.2013-3367. [DOI] [PMC free article] [PubMed] [Google Scholar]
- 37.Caldwell S, Ikura Y, Dias D, Isomoto K, Yabu A, Moskaluk C, Pramoonjago P, et al. Hepatocellular ballooning in NASH. J Hepatol. 2010;53:719–723. doi: 10.1016/j.jhep.2010.04.031. [DOI] [PMC free article] [PubMed] [Google Scholar]
- 38.Verbeke L, Mannaerts I, Schierwagen R, Govaere O, Klein S, Vander Elst I, Windmolders P, et al. FXR agonist obeticholic acid reduces hepatic inflammation and fibrosis in a rat model of toxic cirrhosis. Sci Rep. 2016;6:33453. doi: 10.1038/srep33453. [DOI] [PMC free article] [PubMed] [Google Scholar]
Associated Data
This section collects any data citations, data availability statements, or supplementary materials included in this article.