
Figure 2. Plasma BAs along Primary BA pathway.
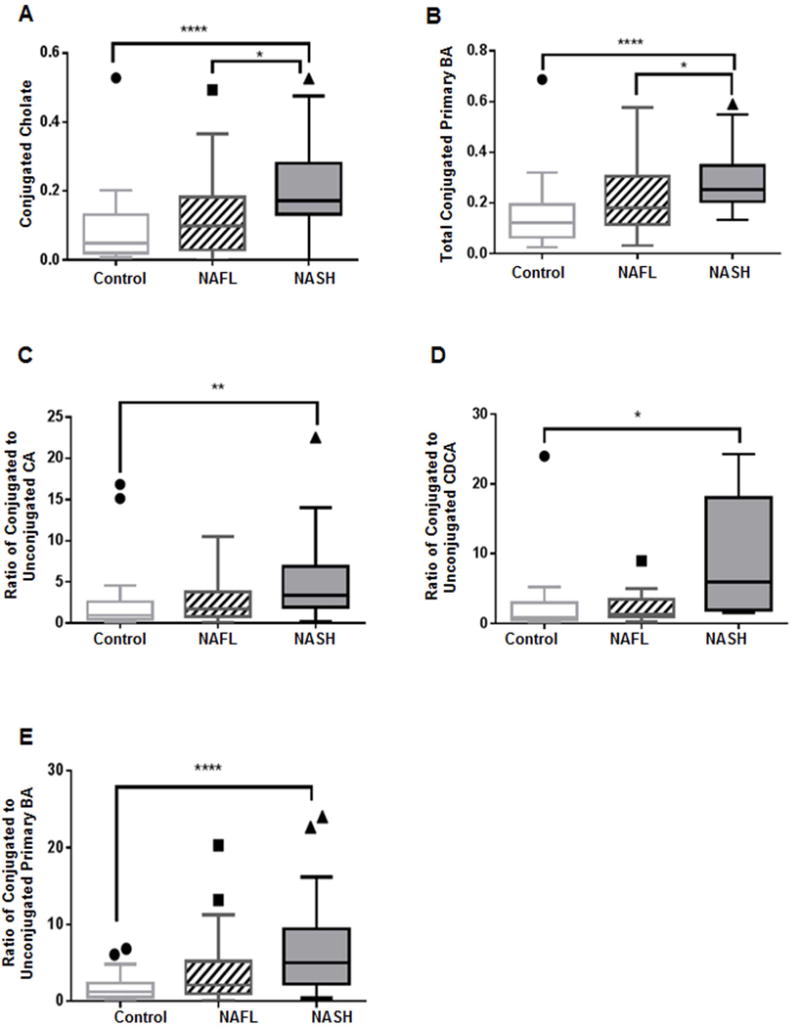
Patients with NASH demonstrate significantly increased (A) conjugated cholate and (B) total conjugated primary BAs. Patients with NASH also demonstrate significantly increased proportions of conjugated to unconjugated (C) cholate (CA), (D) chenodeoxycholate (CDCA), and (E) primary BAs. The BA levels were measured against known internal standards in global metabolomics profile and provides a relative quantitative measure of the BAs relative to the library standards across samples. *p<0.05, **p<0.01, ****p<0.0001; BA, bile acid