

Abstract
Importance
This novel endpoint tracks functional vision changes in patients with inherited retinal dystrophies (IRDs) over time.
Background
The aims of the study were to determine whether a multi-luminance mobility test (MLMT) can detect functional vision changes over time in subjects with IRDs and to assess natural history and potential effects of investigational agents.
Design
This is a prospective, observational study.
Participants
Sixty-two subjects were enrolled. Sixty (29 normal sighted and 31 visually impaired) were eligible; 54 (28 visually impaired and 26 normal-sighted) completed all testing visits.
Methods
Subjects navigated MLMT courses three times over 1 year. At each visit, subjects completed testing using individual eyes, and both eyes, at up to nine standardized, increasing luminance levels (range 1 to 400 lux). Accuracy and speed were evaluated and compared with visual acuity (VA), visual field (VF) and a visual function questionnaire.
Main Outcome Measures
Accuracy and speed of normal and visually impaired subjects on MLMT, and reliability and content validity of MLMT were the main outcome measures.
Results
MLMT distinguished normal-sighted from visually impaired subjects. All control subjects passed all MLMT attempts at all tested light levels. Visually impaired subjects’ performance varied widely; some declined over 1 year. Performance declined markedly below certain VA and VF thresholds. Concordance on performance on two baseline visits was high: correlations for accuracy were 94% and 98% for lowest common and highest common lux levels.
Conclusions and Relevance
MLMT differentiated visually impaired from control populations and, in visually impaired subjects, identified a range of performances; and tracked performance declines over time, consistent with these progressive conditions.
Keywords: functional vision, inherited retinal dystrophy, luminance, mobility test
Introduction
Functional vision – often described as the ability to conduct visually dependent activities of daily living independently – is considered a key component in a person’s ability to perform daily living tasks and in overall quality of life (QoL).1,2 Functional vision evaluations include vision assessment at various distances and observation of the subject in a variety of settings and can also include orientation and mobility tasks.3–8
It has been long accepted that mobility performance is significantly influenced by the total visual field (VF) extent, such that the smaller the total field of the eye, the poorer the mobility performance.9 Nevertheless, mobility itself may be difficult to assess uniformly, as multiple factors contribute to the outcome.10 QoL also is substantially adversely affected in people with reduced mobility.3–8
Visual acuity (VA), VF and contrast sensitivity are generally well accepted as the best visual predictors of mobility performance. For people with low vision, orientation and mobility are more affected by spatial contrast sensitivity and VF than by VA,11 although it also is acknowledged that these parameters vary widely. Mobility performance in the visually impaired has been traditionally assessed as percentage preferred walking speed on a controlled mobility (obstacle) course1,12 or a productive walking index. Lovie-Kitchin et al.13 noted that mobility is affected when VF diameter falls below 70°, but mobility challenges are present even in patients with large residual VFs.14,15 As most approaches to aid people with low vision have been assistive technologies or prosthetic devices, very little literature addresses methodology for assessing the effect of varying lighting conditions on mobility, and/or how those lighting conditions affect QoL. So, for example, although a person with nyctalopia (night blindness) may be able to navigate an obstacle course independently in bright light (i.e. photopic and daytime conditions), that same person might be hindered at lower levels of illumination and, therefore, have a reduced QoL under commonly encountered dim light (scotopic) conditions.
Inherited retinal dystrophies (IRDs) are a heterogeneous group of progressive disorders for which there are limited available therapies. One particular IRD, caused by biallelic mutations in the RPE65 gene, is associated with progressive loss of night vision, VF and VA. The RPE65 protein is an isomerohydrolase that catalyses conversion of trans-retinal to cis-retinal. It is thus critical for rod photoreceptor function. Autosomal recessive mutations in the gene encoding RPE65 lead to clinical conditions ranging from Leber congenital amaurosis (LCA) to retinitis pigmentosa (RP), but all progress eventually to blindness. RPE65 was selected as a target for gene augmentation therapy for several reasons, including availability of small and large animal models; gene size corresponding to adeno-associated viral vector capacity; and progressive, often early onset of disease attributable to a defect in a single gene.
Over time, patients with untreated RPE65-mediated IRD lose the ability to detect light of any intensity. Independent navigation becomes severely limited during childhood or the early adult years, along with impairment of other vision-dependent activities of daily living. Because traditional mobility metrics do not address the effects of illumination on speed and accuracy of navigation in a standardized and quantitative manner,16 for the purposes of a phase 1 trial of gene delivery (voretigene neparvovec) for RPE65-mediated IRD,17,18 we developed a novel assay of mobility, the multi-luminance mobility test (MLMT). The MLMT integrates aspects of VA, VF and light sensitivity into a quantifiable measure and comprises aspects of laboratory-based and real-world approaches.19 We hypothesized that by modifying and increasing the complexity of the walking environment, we could assess the effects of a range of different light levels on independent navigation, in a setting that maintains the controls more typical of a laboratory experiment.
The MLMT has been used in this study, in two phase 1 studies20 (during which it was standardized), and in a phase 3 study of voretigene neparvovec (NCT00999609). We report here on the construct and content validity of the MLMT in normal-sighted and visually impaired subjects, on the ability of the MLMT to detect change over time and the MLMT’s relationship to VA, VFs and a visual function questionnaire, as well as on test graders’ scoring reproducibility.
Methods
Study design and subjects
This prospective, observational study included normal-sighted subjects and visually impaired subjects with an IRD. Inclusion criteria included the following: at least 3 years of age; capable of complying with study testing and with sufficient attention span to navigate the mobility course and complete ancillary visual function tests; and able to provide signed subject consent and/or parent/guardian permission for study participation. Exclusion criteria included physical disability that would prevent independent ambulation through the mobility course, and attentional limitations. For those with visual impairment, the only requirement was a clinical diagnosis of an IRD; there was no cut-off for VA or VF. Subjects were recruited by telephone, email and flyers approved by the institutional review board/independent ethics committee. The study was completed according to the guidelines of Good Clinical Practice and was conducted in full compliance with the World Medical Association Declaration of Helsinki and its most recent amendments. The protocol was approved by the Institutional Review Board of The Children’s Hospital of Philadelphia. Written informed consent or parent/guardian permission was provided for all subjects prior to the initiation of any study procedures.
Eligible subjects completed four visits over 1 year. The Screening Visit consisted of subject consent, or subject assent and parent/guardian permission, and eligibility screening. At Baseline Visit 1 (conducted on the same day as the Screening Visit), visual function and functional vision tests were performed and served as the first baseline for vision testing. All visual function and functional vision tests were repeated at a second, Baseline Visit 2 (conducted approximately 1 month ± 1 week following Baseline Visit 1) and again at a 1-Year Visit (conducted approximately 1 year ± 2 months after Baseline Visit 1).
Functional vision: MLMT
Subjects were instructed to follow arrows on the MLMT course while avoiding obstacles in or adjacent to their path, traversing raised steps and identifying a door at the end of the course. At each of the three testing visits, subjects were evaluated at several light levels to identify the lowest light level at which they could successfully navigate the course (as individuals with RPE65 gene mutations have a decreased ability to detect light, an MLMT designed to evaluate visual improvements in this group must include illumination assessments). At each light level, subjects were tested with each eye individually (single eye patched) and with both eyes unpatched. Each course attempt was video and audio recorded, and coded videos were graded by two independent, masked graders based on a predetermined algorithm that assesses both speed and accuracy.
MLMT scoring
Two of the three trained graders independently reviewed each video and determined the number of collisions and the time to navigate the course, the number of times that the subject went off course, the number of arrow tiles that were bypassed and the number of times that the subject was redirected onto the course. The number of collisions with obstacles (regardless of form of contact) and other errors were used to assign penalties for both speed and accuracy. The accuracy score, which is more intuitively described as an error score, was calculated by dividing the number of accuracy penalties by the total number of obstacles (15). Subjects must have attained an accuracy score ≤ 0.25 to pass. In other words, they could commit a maximum of three errors to pass. Time score was determined by combining the seconds to complete the course with time penalties. Time penalties were assigned as follows: 15 s added for each instance off course; 15 s added for each tile bypassed; and 30 s added for each redirect. Time penalties were added to the time to complete the course to yield a total time score. A passing time score was <180 s. To pass each course run, subjects must have passed both accuracy and time criteria. After individual grading, the graders met at regular intervals to openly adjudicate the videos and determine a consensus result.
The independent reading centre was separate from all study conduct. Graders were trained on MLMT scoring but had no knowledge of the study protocol, objectives, group information and results of other visual function tests (i.e. presence or absence of visual impairment). To assess intra-observer variability, every 3 months, a 10% sample of videos from the prior quarter was randomly selected to be submitted for regrading for quality assurance, with a twofold greater probability of selection for videos where collisions or penalties occurred. These videos were mixed with new videos provided to the graders. Graders were not informed that re-grading was occurring or which videos were new.
More than 3816 videos have been graded across all studies of the sponsor using the MLMT. To determine the inter-observer reproducibility for MLMT components as well as the overall pass/fail score for a single test, correlation (for speed and accuracy) and concordance (for overall pass/fail score) was assessed between the two reviewers of each video. Intra-grader (grade–re-grade) agreement was assessed similarly for individual graders, and for agreement between the consensus original and re-grading.
MLMT change score
To quantify subject performance over time, we developed the MLMT change score algorithm in which each light level evaluated during the study was assigned a score (Table 1). Light levels used during initial exploration of the MLMT in phase 1 studies, specifically 100 and 150, and 200 and 250 (at which no participants in this study were tested), were coded together. This approximates the testing conditions of a subsequent phase 3 study, which evaluated subjects at seven light levels (1, 4, 10, 50, 125, 250 and 400 lux).21 MLMT change score was determined using the difference in score code from baseline lower light sensitivity cut-off (i.e. the lowest light level at which a subject passed at either Baseline Visit 1 or 2 to the lower light sensitivity cut-off of the 1-Year Visit).
Table 1.
Scoring code for multi-luminance mobility test change score
| Lux | ||||||||
|---|---|---|---|---|---|---|---|---|
| 1 | 4 | 10 | 50 | (100 and 150) | (200 and 250) | 400 | >400† | |
| Score code | 6 | 5 | 4 | 3 | 2 | 1 | 0 | −1 |
Does not pass at 400 lux.
MLMT course configuration
Twelve unique MLMT course configurations were developed and printed on heavy white cloth with a 1-ft border on all edges (7 ft × 12 ft). The path to be traversed was indicated with printed black arrows standardized to dimensions consistent with Snellen lettering for VA of 20/200 at 2 m (Fig. 1). Each course was standardized for number of turns, and number and type of obstacles. The number of square arrow tiles was the same in each configuration. With 24 arrow tiles, each 1 ft in side length, the approximate course length is 24 ft.
Figure 1.

Multi-luminance mobility test sample layout. Obstacles include two raised steps with arrows (2 in. high), two grass tiles, three black tiles representing holes, two elevated foam blocks (4.5 in. high), two Styrofoam (STY) cones, one stop sign (adjustable from 40 to 72 in. high), one step-over obstacle (9 in. high), one waist-high obstacle (represented by the blue tree, 27 in. high) and one waste basket (13 in. high).
Course configuration was changed before each run, and the order of course presentation to subjects was randomized before each testing visit. The randomization scheme also determined the sequence for eye-patching conditions (i.e. testing with right or left eye first, then the contralateral eye and then both eyes last) at each level of illumination.
MLMT lighting conditions
Tests were conducted in a room at up to nine standardized light levels: 1, 4, 10, 50, 100, 150, 200, 250 and 400 lux. Light levels were controlled using a customized dimmer panel and were measured in lux designed to fall within 20% error with a calibrated light meter (Extech EA33, FLIR Commercial Systems, Inc., Nashua, NH) at five different positions on the course. However, once installed, this lighting system was actually verified to be between 5% and 11% variation, with an average of less than 10% variability of illuminance over the course area. Standardized light levels were selected to approximate different, common, real-world luminance levels (Table 2). Light levels below 1 lux were not thought to be pertinent to activities of daily living, and light levels above 400 lux did not improve performance in earlier versions of the test. Because of the close spacing of several light levels, some categories were combined for purposes of data analysis. In the original version of the test, there were four closely spaced levels – 100, 150, 200 and 250 lux – at which subjects were tested. In the conduct of the current study, we used both 100 and 150 lux but did not need to use either 200 or 250 lux to define the highest failing light level, or the lowest passing one, for any subject. For purposes of analysis, subjects assessed at either 100 or 150 lux were combined into a single lux level (Table 1).
Table 2.
Lux level and corresponding real-world examples
| Illuminance (lux) | Luminance (cd/m2) | Corresponding environment |
|---|---|---|
| 1 | 0.32 mesopic vision | Moonless summer night; or indoor nightlight |
| 4 | 1.3 mesopic vision | Cloudless summer night with half moon; or outdoor parking lot at night |
| 10 | 3.2 mesopic vision | 60 min after sunset in a city setting; or a bus stop at night |
| 50 | 15.9 photopic vision | Outdoor train station at night; or inside of illuminated office building stairwell |
| 125† | 39.8 photopic vision | 30 min before cloudless sunrise; or interior of shopping mall, train or bus at night |
| 250‡ | 79.6 photopic vision | Interior of elevator, library or office hallway |
| 400 | 127.3 photopic vision | Office environment; or food court |
National Institute of Standards and Technology-calibrated, Extech model EA33 light meters used to provide examples and to set/verify specified light levels used for mobility testing.
Analysis incorporates runs at 100 and 150 lux.
200 and 250 lux were combined for analysis purposes; however, no subjects were tested at either of these levels because these levels were not needed to identify any lowest passing or highest failing level.
At each visit, an estimated lower light sensitivity cut-off (defined as the lowest light sensitivity at which the subject successfully navigates the course with a passing score) and a sub-sensitivity cut-off (defined as the illuminance level one level lower than the estimated lower light sensitivity cut-off, at which the subject receives a failing score) were identified for each subject.
MLMT testing procedures
During the practice run of the course, using a separate layout from the 12 configurations used for actual testing runs, in-room testers estimated the lowest light level at which the subject could complete the course. At least one level of light lower than this was tested, as well as a level or two higher, giving up to four light levels tested at each visit in order to determine a passing level and a failing level for each eye-patching condition. This practice run was made with both eyes and then with one eye patched (permitting subjects to retain any corrective lenses). Subjects were instructed on the cues to start and stop the test, and on the procedure used if they went off the course and required redirection. For each testing visit, each subject navigated the course a maximum of 12 times, performing each of the up to four aforementioned light levels first with one eye patched, then with the other eye patched and then using both eyes. The course configuration was changed for each of these 12 runs.
All subjects were dark adapted for 40 min before testing; randomized single-eye patching was initiated at the start of each test. Testing proceeded from lower to higher light levels after dark adaptation. After completion of the first run, a new course configuration was introduced, and the subject attempted the course again with the opposite eye patched. Runs were performed using each eye alone (through unilateral patching) and with both eyes open at estimated sub-sensitivity cut-off levels and at lower light sensitivity cut-off levels. If the subject stepped off course and did not correct himself or herself after two steps, or if the subject was at risk of injury from a collision, the tester would guide the subject back onto the course. Testers did not provide any other verbal or physical cues. Subjects were graded pass/fail on accuracy of course completion and time, with ‘pass’ defined by meeting both accuracy and time cut-offs. Both video and audio were recorded to ensure that testers did not use verbal or physical cues to aid the subject, and independent graders provided feedback regarding examiner conduct during testing.
MLMT validity
To serve as a tool to track natural history of IRDs and as an efficacy outcome measure for subsequent gene therapy trials, the MLMT was evaluated to demonstrate construct validity, reliability, content validity and ability to detect change, defined as follows:
Construct validity: The test and scoring method should be able to differentiate those with normal vision from those with impaired vision. For those with impaired vision, the test should distinguish higher from lower performers.
Reliability: The test should show high inter-observer, test–retest and intra-observer reproducibility.
Content validity: The test components of speed and accuracy score at defined levels of illumination should represent aspects of VF, VA and QoL, the latter measured by a visual function questionnaire.
Ability to detect change: The test should identify differences in scores over time in subjects whose functional vision has declined owing to progression of retinal degeneration. Conversely, there should be no differences in MLMT scores in those whose functional vision has not changed.
Visual function and QoL
Subjects were evaluated on VA, VF and a visual function questionnaire designed to be relevant to both children and adults, the latter serving as a patient-reported QoL outcome. Subjects performed standard VA and VF tests at Baseline Visits 1 and 2, and the 1-Year Visit. VA and VF were measured for each eye individually whereas the contralateral eye was occluded via patching. VA was reported in both Snellen equivalents and logMAR scores. VF was determined with a Fastpac VF using the Humphrey Static Perimeter with a size V test stimulus and a Goldmann Kinetic Perimeter. Humphrey VFs were used to assess and monitor macular and foveal retinal sensitivity. The Fastpac protocol was used to identify retinal sensitivity for both the macula and fovea, and also has the advantage of being a relatively short protocol and therefore improving the chance of successful test completion in paediatric subjects by minimizing prolonged testing fatigue. At Baseline Visit 1, all subjects were tested using both the III4e and V4e test stimuli. At Baseline Visit 2 and the 1-Year Visit, subjects were evaluated using the smallest test stimulus they could identify at Baseline Visit 1. Results were reported as sum total degrees across 24 meridians. All subjects completed the visual function questionnaire at every visit. For paediatric subjects, the consenting adult also completed a questionnaire about the child’s vision. This questionnaire contained 25 questions with numerical answers from 0 (worst vision) to 10 (best vision). The average of all answered questions was reported at each visit.
Statistical methods
Graphical and tabular presentations explored descriptive relationships between MLMT results and visual function measures of VA and VF, as well as perceived difficulty of activities of daily living as assessed by the questionnaire. Graphs include all available tests for participants at all lighting conditions, eye-patching conditions (left, right and bilateral) as available and visits. Concordance and Pearson correlations are presented. Summary statistics (mean ± SD, counts and percentages) are provided for questionnaire and MLMT change score outcomes. To explore quantitative effects of course configuration, an analysis of variance was performed for each MLMT outcome with categorical age and course configuration as fixed effects and subject as a random effect, to account for correlation of observations within subjects. Inter-grader and intra-grader (grade–re-grade) agreement used intraclass correlation coefficients for individual components of MLMT and kappa statistics for MLMT completion and pass/fail outcomes; 95% confidence intervals appear for all estimates.
Figure 2 describes the overall methodology of the study.
Figure 2.
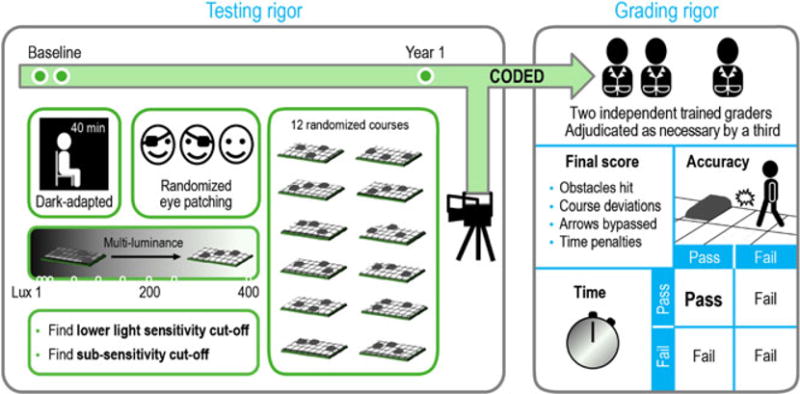
Rigor in multi-luminance mobility test (MLMT) assessment. Following 40 min of dark adaptation, subjects underwent randomized eye patching, and then no eye patching, and were instructed to navigate one of 12 randomized MLMT courses. Testing was performed at the estimated sub-sensitivity cut-off level, and the estimated lower light sensitivity level. Videos were graded remotely by two masked, trained, independent graders, adjudicated by a third as necessary. A final score was computed based on accuracy and time needed to complete the course, factoring in any penalties. A passing grade on both components was necessary to pass the MLMT.
Results
Sixty-two subjects were enrolled; 60 (29 normal sighted and 31 visually impaired) were eligible for participation. Twenty-eight visually impaired subjects and 26 normal-sighted controls, aged 4 through 39 years, completed all four visits (Table 3). Subject demographics and other baseline characteristics are summarized in Table 4. Of the visually impaired subjects, 20 were diagnosed with LCA, five with choroideremia, four with RP and one each with Stargardt disease and Usher syndrome.
Table 3.
Disposition of subjects
| Normal sighted (n = 29) | Visually impaired (n = 31) | Total (n = 60) | |
|---|---|---|---|
| Eligible for study | 29 (100) | 31 (100) | 60 (100) |
| Completed study | 26 (90) | 27 (87) | 53 (88) |
| Discontinued study | |||
| Lost to follow-up | 2 (7) | 0 | 2 (3) |
| Physician decision | 0 | 2 (6) | 2 (3) |
| Subject withdrawal | 1 (3) | 1 (3) | 2 (3) |
| Other | 0 | 1 (3) | 1 (2) |
All data shown as n (%). The visually impaired subject in the ‘other’ category had an early termination visit (out-of-visit window for the 1-Year Visit) and is included in the change score calculations and other analyses.
Table 4.
Demographics (all eligible subjects)
| Normal sighted (n = 29) |
Visually impaired (n = 31) |
Total (n = 60) |
|
|---|---|---|---|
| Age category, n | |||
| <10 years | 11 | 8 | 19 |
| ≥10 years | 18 | 23 | 41 |
| Age, years | |||
| Mean (SD) | 16.2 (9.8) | 14.7 (9.2) | 15.4 (9.4) |
| Range (min, max) | 5, 39 | 4, 40 | 4, 40 |
| Quartiles (25th, median, 75th) | 9, 12, 24 | 9, 13, 16 | 9, 13, 21 |
| Sex, n | |||
| Female | 18 | 13 | 31 |
| Male | 11 | 18 | 29 |
| Race, n | |||
| White | 23 | 26 | 49 |
| Asian | 3 | 2 | 5 |
| Other | 3 | 3 | 6 |
SD, standard deviation.
MLMT course configuration and difficulty
Table 5 shows the distribution between the normal-sighted and visually impaired subjects for each of the 12 MLMT course configurations. Figure 3 shows visually impaired subjects’ accuracy scores in each of the 12 course layouts; the lower the score, the higher the subject’s accuracy in navigating the course. Each data point represents a subject’s measurement at a visit; each subject has multiple data points. Visually, no course appears to be exceptionally easy or difficult; the same sets of individuals tend to group at the worse-performing end of the accuracy score distribution. For accuracy score and time, neither course nor age was statistically significant in the analysis of variance model.
Table 5.
Course configurations
| Course configuration | Normal-sighted | Visually impaired | Total |
|---|---|---|---|
| 1 | 18/27 | 18/33 | 36/60 |
| 2 | 16/18 | 24/42 | 40/60 |
| 3 | 17/24 | 23/47 | 40/71 |
| 4 | 13/18 | 18/38 | 31/56 |
| 5 | 11/18 | 25/54 | 36/72 |
| 6 | 17/20 | 22/44 | 39/64 |
| 7 | 21/27 | 22/43 | 43/70 |
| 8 | 11/15 | 24/43 | 35/58 |
| 9 | 17/21 | 23/44 | 40/65 |
| 10 | 14/16 | 25/50 | 39/66 |
| 11 | 19/23 | 26/55 | 45/78 |
| 12 | 16/22 | 23/44 | 39/66 |
Data presented as number of subjects/number of times course configuration was used.
Figure 3.

Accuracy score by course configuration, all visits. Each colour/symbol combination represents an individual person.
MLMT validity
Construct validity
The MLMT distinguished between normal-sighted and visually impaired subjects, with normal subjects passing on both time and accuracy at all light levels, whereas visually impaired subjects demonstrated a wide range of failing and passing performances, with dependence on levels of illumination for some conditions (Fig. 4a, b).
Figure 4.
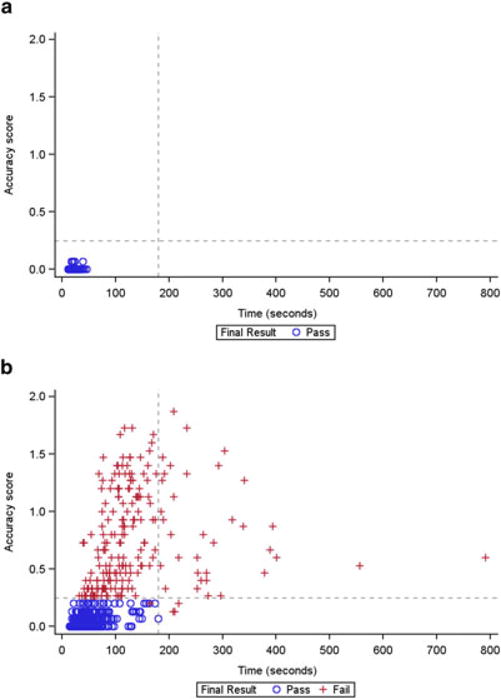
Time and accuracy scores, by pass/fail status, in the (a) normal-sighted and (b) visually impaired groups. All normal-sighted subjects received a ‘pass’ grade on the multi-luminance mobility test (MLMT) at all tested light levels. In contrast, visually impaired subjects showed a range of performance on both time and accuracy across multiple light levels. Each data point represents an individual subject’s measurement at a visit; multiple points per subject are plotted. Subjects passed on the accuracy component of the MLMT if their accuracy score was ≤0.25.
Reliability
Data using the MLMT, across this study and the phase 1 and phase 3 studies of voretigene neparvovec, showed high inter-observer, test–retest and intra-observer reproducibility in test scoring of >3500 videotaped runs (Table 6). Each MLMT run was analysed by two of three masked graders trained in MLMT scoring by orientation and mobility experts through viewing video-recorded test runs. Analyses showed high agreement across the many continuous and binary pass/fail components of the MLMT. Independent graders were not informed of the study visit at which each test originated, and evaluated the MLMT consistently regardless of study visit. The inter-grader agreement of ‘final pass/fail’, which was used to determine the MLMT change score, was 97.9%.
Table 6.
Consensus scores and intra-grader and inter-grader correlations for MLMT results among trained graders across all studies†,‡
| Inter-grader | Grade–re-grade
|
|||||
|---|---|---|---|---|---|---|
| Consensus | Grader 1 | Grader 2 | Grader 3 | |||
|
|
||||||
| n = 3816 | n = 395 | n = 354 | n = 94 | n = 110 | ||
| Intraclass correlation | No. of obstacles hit | 0.99 (0.99–0.99) | 0.99 (0.99–0.99) | 0.99 (0.99–0.99) | 0.99 (0.99–1.00) | 0.99 (0.99–0.99) |
| No. of times off course | 0.99 (0.99–0.99) | 0.99 (0.99–0.99) | 0.99 (0.99–0.99) | 0.98 (0.96–0.98) | 0.99 (0.99–1.00) | |
| No. of times re-guided | 1.00 (0.99–1.00) | 1.00 (1.00–1.00) | 0.99 (0.99–0.99) | 0.99 (0.98–0.99) | 1.00 (0.99–1.00) | |
| No. of tiles bypassed | 0.91 (0.90–0.91) | 0.92 (0.91–0.94) | 0.92 (0.90–0.93) | 0.90 (0.86–0.93) | 0.91 (0.87–0.94) | |
| Obstacles plus penalties | 0.98 (0.98–0.98) | 0.98 (0.97–0.98) | 0.97 (0.96–0.98) | 0.98 (0.97–0.99) | 0.98 (0.97–0.99) | |
| Accuracy score | 0.99 (0.99–0.99) | 0.99 (0.99–0.99) | 0.99 (0.99–0.99) | 0.99 (0.99–1.00) | 0.99 (0.99–0.99) | |
| Course time | 1.00 (1.00–1.00) | 1.00 (1.00–1.00) | 1.00 (1.00–1.00) | 1.00 (1.00–1.00) | 1.00 (1.00–1.00) | |
| Time score | 1.00 (1.00–1.00) | 1.00 (1.00–1.00) | 1.00 (1.00–1.00) | 1.00 (1.00–1.00) | 1.00 (1.00–1.00) | |
| κ | Course completed | 1.00 (1.00–1.00) | 1.00 (1.00–1.00) | 0.67 (0.05–1.00) | 1.00 (1.00–1.00) | 1.00 (1.00–1.00) |
| Accuracy pass/fail | 0.95 (0.94–0.96) | 0.94 (0.90–0.97) | 0.91 (0.86–0.95) | 0.95 (0.89–1.00) | 0.92 (0.85–1.00) | |
| Time pass/fail | 0.98 (0.98–0.99) | 0.98 (0.96–1.00) | 1.00 (1.00–1.00) | 0.97 (0.90–1.00) | 0.98 (0.94–1.00) | |
| Final pass/fail | 0.95 (0.94–0.96) | 0.94 (0.91–0.98) | 0.92 (0.88–0.96) | 0.95 (0.89–1.00) | 0.94 (0.88–1.00) | |
| n (%) Agree | Course completed | 3816 (100.0%) | 395 (100.0%) | 353 (99.7%) | 94 (100.0%) | 110 (100.0%) |
| Accuracy pass/fail | 3725 (97.6%) | 383 (97.0%) | 338 (95.5%) | 92 (97.9%) | 106 (96.4%) | |
| Time pass/fail | 3792 (99.4%) | 392 (99.2%) | 354 (100.0%) | 93 (98.9%) | 109 (99.1%) | |
| Final pass/fail | 3734 (97.9%) | 384 (97.2%) | 340 (96.0%) | 92 (97.9%) | 107 (97.3%) | |
Inter-grader and intra-grader agreement data monitored through quarterly assurance reports. For all videos graded, inter-grader agreement between two separate graders is assessed by intraclass correlations for mobility test components and by kappa statistics for course completed, accuracy and time pass/fail, and final pass/fail; percent agreement is also present for these outcomes.
“All studies” refers to all studies conducted by the sponsor using multi-luminance mobility test (MLMT). In addition to the current study, this includes videotapes recorded and graded during a phase 3 study of voretigene neparvovec.
Concordance between the 2 Baseline Visits across all light levels was high for all pass/fail components. For the bilateral MLMT pass/fail outcome in the visually impaired subjects, concordance was 88%. For both the lowest common lux levels (defined as the lowest common lux level for a subject across the 2 Baseline Visits) and the highest common lux levels (defined similarly) across the 2 Baseline Visits, the correlations for accuracy score were 94% and 98%, respectively. For time, the corresponding correlations were both 86%. More detailed analyses of test performances for all subjects, including time to complete, number of obstacles hit, number of tiles bypassed, number of times off course, number of times re-guided, and number of times each lux level was used, are summarized in Tables S1 through S3.
Content validity
Visual acuity
In normal-sighted subjects, VA and accuracy were both tightly clustered. In the visually impaired subjects, accuracy scores generally indicated a greater number of errors and were more variable with greater VA loss (Fig. 5a, b). Data on the effect of VA loss showed a cut-off effect beyond which the accuracy scores are close to 0 (i.e. no errors). Visually impaired subjects with VA loss of 0.5 logMAR units (or 20/63 Snellen equivalent) or less had accuracy scores of 0 or close to 0, similar to those of normal-sighted subjects. Conversely, all the visually impaired subjects who had VA loss greater than 0.5 logMAR units showed a range of accuracy performance; those with greater than 2 logMAR units loss had very high (poor performance) accuracy scores. When results were analysed by age group, the cut-off effect was evident regardless of age group; that is, it was not age dependent (Fig. S1). A similar cut-off effect was observed for time (data not shown). Among visually impaired subjects, the correlation of average accuracy score with mean VA was good and ranged from 0.75 to 0.86 across all visits and eyes.
Figure 5.
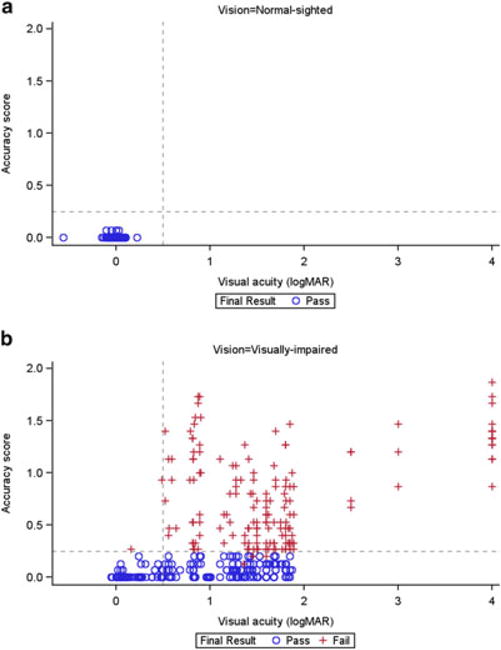
Visual acuity and accuracy scores, by pass/fail status, in the (a) normal-sighted and (b) visually impaired groups.
Visual field
For Goldmann VFs (V4e and III4e test stimuli), the outcome measure was the sum total degrees; higher sum totals indicate a greater area of functional, light-sensitive retina, corresponding to a greater field of vision for the subject (Fig. 6a, b). Among the visually impaired subjects, correlations between mean accuracy score and sum total degrees for each eye/visit combination ranged from −0.37 to −0.53, indicating only a weak to moderate correlation. Although the correlations did not indicate a strong linear relationship, a cut-off phenomenon was seen using the III4e data at 500 sum total degrees, beyond which the accuracy scores were close to 0. This cut-off effect also did not show an age dependence (Fig. S2). The cut-off appeared at 1000 sum degrees for the V4e data. Similar results were seen with Humphrey VFs (foveal sensitivity and macula threshold [Fig. 7a, b]), with correlations for foveal sensitivity among the visually impaired ranging from cut-offs −0.37 to −0.64 and occurring around 30 dB.
Figure 6.
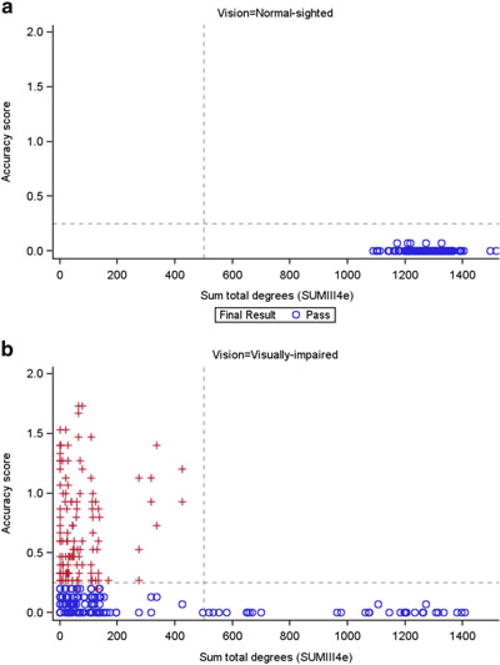
Goldmann visual fields (III4e) and accuracy score, by pass/fail status, in the (a) normal-sighted and (b) visually impaired groups.
Figure 7.

Humphrey visual fields: macular threshold and accuracy, by pass/fail status, in the (a) normal-sighted and (b) visually impaired groups.
Questionnaire
Normal-sighted subjects had consistently high scores on the questionnaire. Visually impaired subjects had a range of performance on the questionnaire, reflected in the range of MLMT time and accuracy scores (data not shown). Parents/guardians of IRD subjects (baseline mean ± SD, 4.4 ± 2.5) tended to score subjects’ performance as lower, and with more variability, than did IRD subjects themselves (baseline mean ± SD, 5.6 ± 1.8). Later visits had similar results. There were consistent relationships between mean bilateral accuracy score and parent/guardian assessment among visually impaired subjects, with correlations of approximately −0.6 for all visits. Those with consistently higher or lower accuracy scores received consistently lower and higher average questionnaire scores, respectively, by the parent or guardian. The relationship was more variable using the subject’s assessment, with a correlation of −0.54 at baseline and approximately −0.7 at later visits.
Ability to detect change
Figure 8 summarizes the MLMT change score over the 1-year observation period under the bilateral testing condition. All 26 normal-sighted subjects with 1-Year Visit data had an MLMT change score of 0, representing no change. Of the 28 visually impaired subjects with 1-Year Visit data, 20 (71%) had an MLMT change score of 0. The remaining eight visually impaired subjects had an MLMT change score of −1 or −2 (i.e. a worsening). All of these subjects carried a diagnosis of LCA or RP. Among the 28 subjects with visual impairment in the current study, the negative MLMT change scores reflect an average decrease of approximately one-half of a specified light level/year.
Figure 8.

Multi-luminance mobility test change score, bilateral assessment, Baseline Visit 2 to 1-Year Visit.
Discussion
The genesis of the current study was the effort to develop a novel gene-based therapeutic for IRDs caused by autosomal recessive mutations in the gene encoding RPE65. RPE65 is an isomerohydrolase, a key enzyme in the visual cycle, and absence of the enzyme leads to impaired light perception and eventually to blindness. This study evaluated an MLMT that can be administered under controlled conditions in an outpatient setting, and compared test performance with VF, VA and a patient-reported questionnaire. The MLMT was able to distinguish normal-sighted subjects from visually impaired subjects based on time and accuracy in completing the MLMT. For visually impaired subjects, the MLMT distinguished higher from lower performers.
Moreover, the MLMT was able to track declines in performance over the course of 1 year in those with IRDs. The visually impaired cohort included those with clinical diagnosis of LCA, RP, choroideremia, Stargardt disease and Usher syndrome. The MLMT was particularly evaluable for those with the clinical diagnoses LCA and RP, who made up the majority of the impaired vision cohort. This was not unexpected, as significant peripheral field loss, nyctalopia and VA loss, which the test was designed to measure, are key features of these conditions. Others with a clinical diagnosis manifesting with initial peripheral field loss, such as choroideremia and Usher syndrome, did not have sufficient disease progression to be evaluable, as did one subject diagnosed with Stargardt disease who had central retinal function loss. The sample size was small for choroideremia, Stargardt and Usher syndrome compared with the number of LCA and RP subjects. All eight subjects whose MLMT change score declined carried a diagnosis of RP or LCA, consistent with the progressive degenerative nature of these conditions. Therefore, this endpoint may prove valuable for both natural history and interventional therapeutics studies in the RP and LCA patient population.
A challenge for development of novel therapeutics for IRDs is the relative dearth of well-defined clinical study endpoints, not surprising given the scarcity of approved pharmacologic therapies. The desired characteristics of such an endpoint include construct and content validity for evaluation of individuals with defects in the retinoid cycle specifically, and in inherited causes of blindness generally. Given the crucial role of the retinoid cycle in perception of light, we sought to design a test that would capture subjects’ sensitivity to light and the ability to perform visually dependent activities at a range of different light levels. The MLMT thus differs from numerous other mobility tests by intent. Although other mobility tests have consistently shown that the best visual predictors of mobility performance have been VF and contrast sensitivity, they do not measure performance in varying lighting conditions.
We tracked the correlation of performance on the MLMT with other more conventional visual function tests, including VF and VA. The MLMT exhibited a threshold effect with respect to these parameters; that is, deterioration on the MLMT declined markedly when VA and VF fell below certain thresholds. There was also a relationship between accuracy score and parent/guardian questionnaire assessment among visually impaired subjects. The relationship was less clear using the subject’s assessment, although the extremes were similar for both parent/guardian and subject responses.
The evaluation of this MLMT in normal and visually impaired populations reveals several useful characteristics of the test. The MLMT is designed to evaluate the ability of a subject to navigate a marked path, while avoiding obstacles and relying on vision rather than kinaesthetic input, at a series of different light levels. Comparison of the bilateral MLMT data obtained at the 2 Baseline Visits in the visually impaired subjects demonstrates high test–retest reproducibility (high concordance for the pass/fail outcome, and high correlation for accuracy score and time components). Second, the test is sensitive to performance in a range relevant to the pathophysiology of IRDs; in fact, 28.5% of subjects with IRDs showed a measurable decline in performance at Year 1 compared with baseline. Third, and of considerable interest given some reports in the literature,22 none of the LCA or RP patients demonstrated improvement over the course of 1 year in the MLMT.
This test was developed with an emphasis on modelling activities of daily living, observed as subjects navigated through one of 12 potential courses of comparable difficulty under one of 9 luminance levels. As it was designed to assess visual outcome measures after an intervention, it had to show construct validity, be reliable, have content validity and be able to detect change. Our results show that all 4 of these criteria were met. Further, this test was developed to allow use in a paediatric patient population (relevant for genetic disease), and for use in interventional studies. Children as young as age 4 years were able to navigate the course accurately and at a reasonable pace.
A concern with tests of functional vision conducted in clinical settings is that they may not incorporate real-world conditions such as glare or variability in ambient lighting conditions. The MLMT incorporated variable lighting levels to capture light sensitivity as a component of performance. However, a potential shortcoming of this test for assessment of therapeutic agents is that it exhibits a ‘ceiling’ effect, as it does not assess the ability to see at light levels lower than 1 lux. The test also provides a means of following the durability of the effect of therapeutic interventions and has been used in this fashion in trials for RPE65 mutations.23 Some mobility tests are designed to evaluate improvements in functional vision with use of low vision aids, but most are not designed to address how subjects respond to the course under different light conditions or how progression/treatment of a degenerative vision disorder is affected by lighting conditions. As such, commonly used mobility tests would not be able to assess the improvement in nyctalopia by a given intervention or the reduction in light sensitivity as a function of disease progression.
This study is not without limitations. The subject population was small, although the total number of videotaped performance runs is substantial (>3500). The MLMT as reported here contains a series of unevenly spaced luminance levels. Another design might have specified each step as a 0.5 log difference from the previous step, for example, 1, 3.3, 10 and 33 lux. We adopted an approach that correlates light levels with activities of daily living. However, for analysis purposes, we did collapse some of the levels into a single step to even out the gradations between lux levels. In addition, our study did not account for variability in the natural walking speed of study subjects by using percentage preferred walking speed relative to pre-set values.5 We chose to concentrate on illumination to better represent the real-world vision of people with IRDs, many of whom are affected by nyctalopia and in whom lower lux levels affect QoL. As our assessments compare each subject to his or her own baseline, generalizations cannot be made about percentage preferred walking speed in this patient population.
In conclusion, the standardized MLMT shows both construct and content validity in differentiating visually impaired from control populations, identifies a range of performance in visually impaired subjects and demonstrates the ability to detect change over time. The MLMT showed high reproducibility and reliability and may be a useful instrument for assessing natural history and magnitude and durability of treatment for impaired vision due to IRDs that include nyctalopia as an associated visual impairment.20
Supplementary Material
Table S1. MLMT bilateral testing lux levels, time to complete, accuracy score, and components, lowest light level tested.
Table S2. MLMT bilateral testing lux levels, time to complete, accuracy score, and components, highest light level tested.
Table S3. Number of times each lux level was used in study assessing MLMT.
Figure S1. Visual acuity and accuracy scores, by pass/fail status, in the normal-sighted and visually impaired groups, presented by age group: 4–9 years A), 10–14 years (B), and 15+ years (C).
Figure S2. Goldmann visual fields (III4e) and accuracy score, by pass/fail status, in the normal-sighted and visually impaired groups, presented by age group: 4–9 years (A), 10–14 years (B), and 15+ years (C).
Acknowledgments
The authors gratefully acknowledge Ebenezer Daniel (Director of the Scheie Image Reading Center, Center for Preventive Ophthalmology and Biostatistics, University of Pennsylvania Perelman School of Medicine) for overseeing mobility test video grading and adjudication; Maxwell Pistilli of the Reading Center for Biostatistical Support regarding the inter-grader and intra-grader agreement; Greg Podsakoff for his support of the conduct of this study at Children’s Hospital of Philadelphia (CHOP); Duane Geruschat for his insights about orientation and mobility testing; and Michael Kahn of Spark Therapeutics, Michelle Dalton of Dalton & Associates, Jim Wood of Peloton Advantage and Christina Ohnsman of CMO Medical Communications for providing editorial assistance in the preparation of this manuscript. Drs Arlene Drack and Stephen Russell (University of Iowa), and Junwei Sun and Dr Albert Maguire (University of Pennsylvania and CHOP) contributed to generating the visual function questionnaire.
Funding sources: This study was sponsored by the Center for Cellular and Molecular Therapy at Children’s Hospital of Philadelphia and Spark Therapeutics, Inc.
Footnotes
Supporting information
Additional Supporting Information may be found online in the supporting information tab for this article.
Competing/conflicts of interest: Spark authors (DCC, KAH and JW) are employees of Spark Therapeutics and hold equity in the company. The following authors are inventors on a submitted patent related to the MLMT: Daniel C. Chung, Jean Bennett, Jennifer Wellman, Sarah McCague and Katherine A. High. Zi-Fan Yu and Satha Thill provided statistical consulting to Children’s Hospital of Philadelphia (CHOP) and Spark Therapeutics through their employer, Statistics Collaborative, Inc. Julie DiStefano-Pappas provided data management services to CHOP and Spark Therapeutics through her employer, Westat, Inc. Jean Bennett and Kathleen Marshall are inventors on a copyright for the visual function questionnaire.
References
- 1.Soong GP, Lovie-Kitchin JE, Brown B. Does mobility performance of visually impaired adults improve immediately after orientation and mobility training? Optom Vis Sci. 2001;78:657–66. doi: 10.1097/00006324-200109000-00011. [DOI] [PubMed] [Google Scholar]
- 2.Geruschat DR, Bittner AK, Dagnelie G. Orientation and mobility assessment in retinal prosthetic clinical trials. Optom Vis Sci. 2012;89:1308–15. doi: 10.1097/OPX.0b013e3182686251. [DOI] [PMC free article] [PubMed] [Google Scholar]
- 3.Pundlik S, Tomasi M, Luo G. Evaluation of a portable collision warning device for patients with peripheral vision loss in an obstacle course. Invest Ophthalmol Vis Sci. 2015;56:2571–9. doi: 10.1167/iovs.14-15935. [DOI] [PubMed] [Google Scholar]
- 4.Geruschat DR, Turano KA, Stahl JW. Traditional measures of mobility performance and retinitis pigmentosa. Optom Vis Sci. 1998;75:525–37. doi: 10.1097/00006324-199807000-00022. [DOI] [PubMed] [Google Scholar]
- 5.Haymes S, Guest D, Heyes A, Johnston A. Mobility of people with retinitis pigmentosa as a function of vision and psychological variables. Optom Vis Sci. 1996;73:621–37. doi: 10.1097/00006324-199610000-00001. [DOI] [PubMed] [Google Scholar]
- 6.Kuyk T, Elliott JL, Fuhr PS. Visual correlates of mobility in real world settings in older adults with low vision. Optom Vis Sci. 1998;75:538–47. doi: 10.1097/00006324-199807000-00023. [DOI] [PubMed] [Google Scholar]
- 7.Leat SJ, Lovie-Kitchin JE. Visual function, visual attention, and mobility performance in low vision. Optom Vis Sci. 2008;85:1049–56. doi: 10.1097/OPX.0b013e31818b949d. [DOI] [PubMed] [Google Scholar]
- 8.Black A, Lovie-Kitchin JE, Woods RL, Arnold N, Byrnes J, Murrish J. Mobility performance with retinitis pigmentosa. Clin Exp Optom. 1997;80:1–12. [Google Scholar]
- 9.Lovie-Kitchin J, Mainstone J, Robinson J, Brown B. What areas of the visual field are important for mobility in low vision patients. Clin Vis Sci. 1990;5:249–64. [Google Scholar]
- 10.Long RG, Rieser JJ, Hill EW. Mobility in individuals with moderate visual impairments. J Vis Impair Blind. 1990;84:111–8. [Google Scholar]
- 11.Marron JA, Bailey IL. Visual factors and orientation-mobility performance. Am J Optom Physiol Opt. 1982;59:413–26. doi: 10.1097/00006324-198205000-00009. [DOI] [PubMed] [Google Scholar]
- 12.Clark-Carter DD, Heyes AD, Howarth CI. The efficiency and walking speed of visually impaired people. Ergonomics. 1986;29:779–89. doi: 10.1080/00140138608968314. [DOI] [PubMed] [Google Scholar]
- 13.Lovie-Kitchin JE, Soong GP, Hassan SE, Woods RL. Visual field size criteria for mobility rehabilitation referral. Optom Vis Sci. 2010;87:E948–57. doi: 10.1097/OPX.0b013e3181ff99be. [DOI] [PubMed] [Google Scholar]
- 14.Chen CS, Lee AW, Clarke G, et al. Vision-related quality of life in patients with complete homonymous hemianopia post stroke. Top Stroke Rehabil. 2009;16:445–53. doi: 10.1310/tsr1606-445. [DOI] [PubMed] [Google Scholar]
- 15.Hayes A, Chen CS, Clarke G, Thompson A. Functional improvements following the use of the NVT Vision Rehabilitation program for patients with hemianopia following stroke. NeuroRehabilitation. 2012;31:19–30. doi: 10.3233/NRE-2012-0771. [DOI] [PubMed] [Google Scholar]
- 16.Thompson DA, Ali RR, Banin E, et al. Advancing therapeutic strategies for inherited retinal degeneration: recommendations from the Monaciano Symposium. Invest Ophthalmol Vis Sci. 2015;56:918–31. doi: 10.1167/iovs.14-16049. [DOI] [PMC free article] [PubMed] [Google Scholar]
- 17.Maguire AM, Simonelli F, Pierce EA, et al. Safety and efficacy of gene transfer for Leber’s congenital amaurosis. N Engl J Med. 2008;358:2240–8. doi: 10.1056/NEJMoa0802315. [DOI] [PMC free article] [PubMed] [Google Scholar]
- 18.Maguire AM, High KA, Auricchio A, et al. Age-dependent effects of RPE65 gene therapy for Leber’s congenital amaurosis: a phase 1 dose-escalation trial. Lancet. 2009;374:1597–605. doi: 10.1016/S0140-6736(09)61836-5. [DOI] [PMC free article] [PubMed] [Google Scholar]
- 19.U.S. Food and Drug Administration. Investigational Device Exemption (IDE) Guidance for Retinal Prostheses – Guidance for Industry and Food and Drug Administration Staff. Rockville, MD: US Food and Drug Administration; 2013. [Google Scholar]
- 20.Bennett J, Wellman J, Marshall KA, et al. Safety and durability of effect of contralateral-eye administration of AAV2 gene therapy in patients with childhood-onset blindness caused by RPE65 mutations: a follow-on phase 1 trial. Lancet. 2016;388:661–72. doi: 10.1016/S0140-6736(16)30371-3. [DOI] [PMC free article] [PubMed] [Google Scholar]
- 21.Russell S, Bennett J, Wellman JA, et al. Efficacy and safety of voretigene neparvovec (AAV2-hRPE65v2) in subjects with RPE65-mediated inherited retinal dystrophy: a randomised, controlled, open-label phase 3 trial. Lancet. 2017 doi: 10.1016/S0140-6736(17)31868-8. in press. [DOI] [PMC free article] [PubMed] [Google Scholar]
- 22.Perrault I, Rozet JM, Gerber S, et al. Leber congenital amaurosis. Mol Genet Metab. 1999;68:200–8. doi: 10.1006/mgme.1999.2906. [DOI] [PubMed] [Google Scholar]
- 23.McCague S, Wellman J, Yu FF, et al. Mobility testing validation study – using a novel, standardized mobility test to evaluate functional vision in patients with inherited retinal degeneration [abstract 4774] Invest Ophthalmol Vis Sci. 2015;56 abstract: 4774. [Google Scholar]
Associated Data
This section collects any data citations, data availability statements, or supplementary materials included in this article.
Supplementary Materials
Table S1. MLMT bilateral testing lux levels, time to complete, accuracy score, and components, lowest light level tested.
Table S2. MLMT bilateral testing lux levels, time to complete, accuracy score, and components, highest light level tested.
Table S3. Number of times each lux level was used in study assessing MLMT.
Figure S1. Visual acuity and accuracy scores, by pass/fail status, in the normal-sighted and visually impaired groups, presented by age group: 4–9 years A), 10–14 years (B), and 15+ years (C).
Figure S2. Goldmann visual fields (III4e) and accuracy score, by pass/fail status, in the normal-sighted and visually impaired groups, presented by age group: 4–9 years (A), 10–14 years (B), and 15+ years (C).