

Abstract
MicroRNA (miR)‐451 is a cell metabolism‐related miRNA that can mediate cell energy‐consuming models by several targets. As miR‐451 can promote mechanistic target of rapamycin (mTOR) activity, and increased mTOR activity is related to increased differentiation of T‐helper 17 (Th17) cells, we sought to investigate whether miR‐451 can redistribute from cancer cells to infiltrated T cells and enhance the distribution of Th17 cells through mTOR. Real‐time PCR was used for detecting expression of miR‐451 in gastric cancer, tumor infiltrated T cells and exosomes, and distribution of Th17 was evaluated by both flow cytometry and immunohistochemistry (IHC). Immunofluorescence staining was used in monitoring the exosome‐enveloped miR‐451 from cancer cells to T cells with different treatments, and signaling pathway change was analyzed by western blot. miR‐451 decreased significantly in gastric cancer (GC) tissues but increased in infiltrated T cells and exosomes; tumor miR‐451 was negatively related to infiltrated T cells and exosome miR‐451. Exosome miR‐451 can not only serve as an indicator for poor prognosis of post‐operation GC patients but is also related to increased Th17 distribution in gastric cancer. miR‐451 can redistribute from cancer cells to T cells with low glucose treatment. Decreased 5′ AMP‐activated protein kinase (AMPK) and increased mTOR activity was investigated in miR‐451 redistributed T cells and the Th17 polarized differentiation of these T cells were also increased. Exosome miR‐451 derived from tumor tissues can serve as an indicator for poor prognosis and redistribution of miR‐451 from cancer cells to infiltrated T cells in low glucose treatment can enhance Th17 differentiation by enhancing mTOR activity.
Keywords: exosome, gastric cancer, miR‐451, mTOR, Th17
1. INTRODUCTION
microRNA‐451 (miR‐451) gene is located on chromosome 17 at 17q11.2 in intergenic regions adjacent to the protein‐coding gene ERAL1 (Era G‐protein‐like 1).1 miRNA expression profiling analyses have recently identified miR‐451 as a highly conserved miRNA expressed in several species, including mice and humans.2 Many studies have established that miR‐451 is widely dysregulated in human malignancies, including lung cancer,3, 4 gastric cancer,5, 6, 7, 8 breast cancer,9 glioma,10, 11 and leukemia.12, 13, 14, 15 Some studies have indicated miR‐451 as an anti‐cancer gene that can inhibit cell growth, proliferation, invasion and enhance apoptosis.3, 5, 11, 16 miR‐451 can work intracellularly and by secretion. Thus, miR‐451 is regarded as one of the potential ideal miRNA biomarkers in cancer diagnosis.1, 12, 17
Exosomes are cell‐derived vesicles that are present in perhaps all eukaryotic fluids, including blood, urine, and culture medium of cell cultures.18, 19, 20 First discovered in the maturing mammalian reticulocytes (immature red blood cell), exosomes were shown to participate in the selective removal of many plasma membrane proteins as the reticulocyte becomes a mature red blood cell.21 Exosomes contain various molecular constituents of their cell of origin, including proteins and RNA. Studies concerning profiling comparison of miRNAs in exosomes between cancer and normal tissues has enabled a new direction of cancer research.20 As mentioned earlier, miR‐451 is a secreting miRNA that can also be detected in exosomes. However, the detailed roles of exosome miR‐451 are largely unknown. In the present study, we investigated the existence and the roles of secreting miR‐451 in human gastric cancer, as well as its value in diagnosis.
2. MATERIALS AND METHODS
2.1. Patients
The present hospital‐based case‐control study consisted of 76 GC patients and 42 cancer‐free controls. All subjects were recruited from the 359th Hospital of PLA between January 2012 and January 2017. All patients were undergoing surgery treatment for primary GC; those with other hematological disorders, previous history of cancers, and chemotherapy were excluded. The cancer‐free control subjects from the same geographic area showed no evidence of a genetic relationship with the cases. This study was approved by the Ethics Review Board of the 359th Hospital of PLA, and all patients provided written informed consent. Clinical features of all cases and controls are presented in Table 1.
Table 1.
Clinical characteristics of gastric cancer patients and cancer‐free controls
| Characteristics | Cases (n = 76) | Controls (n = 42) | P‐value | ||
|---|---|---|---|---|---|
| N | % | N | % | ||
| Age (years) | |||||
| ≤50 | 36 | 47.37 | 24 | 57.14 | .805 |
| >50 | 40 | 52.63 | 18 | 42.86 | |
| Gender | |||||
| Male | 38 | 50.00 | 19 | 45.24 | .248 |
| Female | 38 | 50.00 | 23 | 54.76 | |
| Helicobacter pylori infection | |||||
| Positive | 59 | 77.63 | 7 | 16.67 | <.0001 |
| Negative | 17 | 22.37 | 35 | 83.33 | |
| Differentiation | |||||
| G1 | 18 | 23.68 | |||
| G2 | 22 | 28.95 | |||
| G3 | 24 | 31.58 | |||
| G4 | 12 | 15.79 | |||
| TMN stage | |||||
| I | 12 | 15.79 | |||
| II | 22 | 28.95 | |||
| III | 24 | 31.58 | |||
| IV | 18 | 23.68 | |||
| Tumor size (cm) | |||||
| ≤5 cm | 37 | 48.68 | |||
| >5 cm | 39 | 51.32 | |||
| Metastasis | |||||
| Yes | 42 | 55.26 | |||
| No | 34 | 44.74 | |||
2.2. Cell line and reagents
Gastric cancer cell lines including MKN‐45 were purchased from ATCC. All cells were cultured in DMEM purchased from Gibco (Carlsbad, CA, USA) supplemented with 10% FBS (Invitrogen, Carlsbad, NM, USA) and maintained in humidified 5% CO2 at 37°C. Human T cells were purified from erythrocyte lysis blood using a Dynabeads™ CD3 (11151D; ThermoFisher Scientific, Waltham, MA, USA). Human T cells were maintained in a T‐cell culture medium which was RPMI‐1640 medium with 10% FBS (Invitrogen) and 100 IU hrIL‐2 (14‐8029‐81; eBioscience, San Diego, CA, USA).
Th17 cell polarization stimulation was based on, but slightly modified from, the previous publication.22 Briefly, 1 × 10⁵ purified human T cells were cocultured with MKN‐45 in T cell medium and treated with cytokines including interleukin (IL)‐6 (10 ng/mL), IL‐1β (10 ng/mL), transforming growth factor beta (TGF‐β)1 (5‐10 ng/mL), and IL‐23 (10 ng/mL) for 5 days. Five hours just before flow cytometry detection, the T cells were treated with PMA (50 ng/mL), ionomycin (1 μg/mL) as well as the transport inhibitor Brefeldin A. Th17 cells were detected by flow cytometry using BD Pharmingen™ (San Jose, CA, USA) PE Mouse anti‐Human RORγt (563081), BD Pharmingen™ Alexa Fluor® 647 Mouse anti‐Human IL‐17A (560491), and gated with BD Pharmingen™ FITC Mouse Anti‐Human CD4 (561005).
2.3. Real‐time PCR
Total RNA of both paired gastric cancer and peri‐tumor tissue and infiltrated T cells was isolated with TRIzol reagent. RNA in exosomes was extracted using the Total Exosome RNA & Protein Isolation Kit (4478545; ThermoFisher Scientific) according to the manufacturer's instructions. Expression of miR‐451 was detected by using TaqMan Advanced miRNA assay (A25576; Waltham, MA).
2.4. Isolation of tumor infiltrated T cells
Fresh tissue‐infiltrating lymphocytes were obtained according to the following procedure.23 Briefly, cancer and peri‐tumor tissues were cut into small pieces and digested in 100 U/mL Collagenase type IV and 100 μg/mL DNase in RPMI + 10% FBS in RPMI‐1640. Dissociated cells were filtered through a 75‐μm cell strainer and separated by Ficoll centrifugation, and mononuclear cells were washed and resuspended in RPMI‐1640 supplemented with 10% FBS (FBS) (Gibco). T cells were purified with anti‐CD3 magnetic Dynabeads (11151D; ThermoFisher Scientific) according to the manufacturer's instructions.
2.5. Exosome extraction from human serum
Serum sample was centrifuged at 2000 g for 30 minute to remove cells and debris. The supernatant containing the clarified serum was transferred to a new tube; the exosome was isolated by using a Total exosome isolation kit (4478360; ThermoFisher Scientific, Waltham, MA, USA). Briefly, 1 mL serum was mixed well by vortexing with 200 μL of exosome isolation reagent, incubated at 4°C for 30 minute, and centrifuging the sample at 10 000 g for 10 minute at room temperature. The pellet was resuspended in PBS.
2.6. Western blot
For western blotting, proteins were extracted from tissues or cultured cells using RIPA buffer containing PMSF (Beyotime, Nantong, China). An equal amount of proteins (100 μg) was separated by 7.5%/12.5% SDS‐PAGE and transferred to a PVDF membrane. Primary polyclonal antibodies targeting TSC1(ab), AMPK Thy (ab133462), AMPK (ab6672), mTOR Ser (ab2486), mTOR (ab142349), Anti‐S6K1 antibody [E175] (ab32359), Anti‐S6K1 (phospho T389) antibody (ab2571), Anti‐EGR2 antibody [EPR4004] (ab108399) were purchased from Abcam (Cambridge, MA, USA). Secondary antibodies were anti‐rabbit or anti‐mouse HRP‐linked and purchased from Santa Cruz Biotechnology (Santa Cruz, CA, USA). Blots were developed using ECL reagent (Millipore, Burlington, MA, USA). An equal amount of protein loading in each lane was confirmed using β‐actin antibody. ImageJ software (NIH, Bethesda, MD, USA) quantified the integrated density of the band.
2.7. Immunofluorescence staining
Cancer cells‐T cells coculture system consisted of MKN‐45 and human T cells in the ratio of 10:1; the cells were planted into a 4‐well‐Millicell® EZ SLIDES (Millipore) with 10% Matrigel (Corning, Corning, NY, USA). The sides were stained for co‐staining of in situ hybridization (ISH) and immunocytochemistry (ICC) staining according to a previous publication.24 miR‐451 was detected with a Cy3 labeled probe to miR‐451 (HM451‐100) (BioGenex, Fremont, CA, USA), T cells were detected with antibody targeting CD3 (ab699; Abcam, Cambridge, MA, USA) followed by goat anti‐mouse IgG H&L (Alexa Fluor® 647) (ab150115; Abcam) and exosome was detected by using antibody targeting CD63 (ab68418; Abcam) followed by goat anti‐rabbit Cy5 labeled second antibody (ab97077; Abcam). Slides were finally mounted with Fluoroshield Mounting Medium With DAPI (ab104139; Abcam).
2.8. Immunohistochemistry (IHC) staining
Sections were stained according to a previous publication.23 The section was incubated with primary mouse anti‐human Ab for RORγt (MABF81; Millipore), the sections were stained with diaminobenzidine (DAB) according to manufacturer's protocols and mounted and photographed using a digitalized microscope camera (Nikon, Tokyo, Japan).
2.9. Statistical analysis
Differences between cases and controls were evaluated by Student's t test for continuous variables and χ2 test for categorical variables. The 2 values correlation was evaluated by linear correlation analysis and tested by F‐test. Overall survival in different groups was analyzed by using Kaplan‐Meier curve. All statistical analyses were carried out using Statistical Package for Social Sciences (SPSS Ver. 12; IBM, Armonk, NY, USA) software.
3. RESULTS
3.1. miR‐451 was differently distributed in tumor tissue, infiltrated T cells and exosomes in human gastric cancer
To investigate the expression of miR‐451 in human gastric cancer, we selected 76 paired gastric cancer and peri‐tumor fresh tissues. Expression of miR‐451 was determined by real‐time PCR; the result indicated that miR‐451 was significantly lower in gastric tumor tissues compared to their peri‐tumor tissue (Figure 1A), the result was similar to many previous studies.8, 25 Next, we isolated tumor infiltrating leukocytes (TIL) from the tumor and peri‐tumor tissues and further isolated CD3‐positive cells with magnetic beads. We found an interesting result that miR‐451 was overexpressed in infiltrated T cells in tumor tissues (Figure 1B). As many studies indicated that miR‐451 is a secreting miRNA and can be detected in human serum,26 and the secreting miRNA can be packaged by exosomes,20 we isolated the exosomes from the serum of gastric cancer patients as well as 42 healthy controls. Exosome miR‐451 was significantly higher in gastric cancer patients compared to the healthy controls (Figure 1C).
Figure 1.
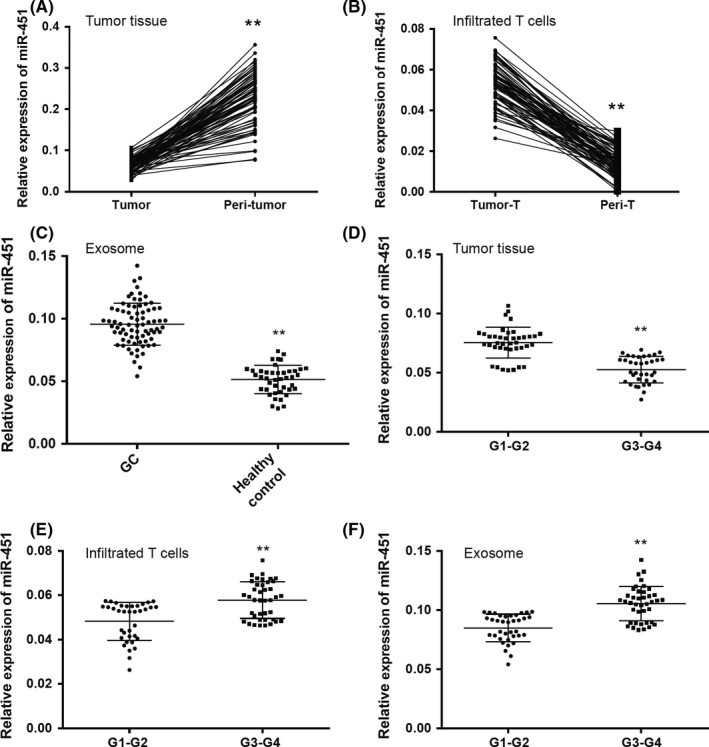
MicroRNA (MiR‐451) was differently distributed in tumor tissue, infiltrated T cells and exosomes in human gastric cancer (GC). Relative expression of miR‐451 was detected in (A) 76 paired human gastric cancer and peri‐tumor tissues and (B) tumor infiltrated T cells isolated from tumor and peri‐tumor tissues. C, Relative expression of miR‐451 was detected in exosomes extracted from serum obtained from GC patients (n = 76) and healthy controls (n = 42). Comparisons of relative expression of miR‐451 were carried out within (D) tumor tissues, (E) infiltrated T cells and (F) exosomes obtained from different TMN‐stage GC. All experiments were carried out in triplicate; data are presented as mean ± SD. **P < .01
We then further explored the expression of miR‐451 depending on different clinical features. First, we divided the GC patients into 2 groups: G1‐G2 (n = 40) and G3‐G4 (n = 36). We found that miR‐451 was significantly higher in the G1‐G2 tumor tissues and lower in the infiltrated T cells and exosomes (Figure 1E,F). Next, expression of miR‐451 in tumor tissue, serum exosomes and infiltrated T cells was compared within different TMN stage (I‐II vs III‐IV) and different tumor size (≤5 cm and >5 cm). The result indicated that miR‐451 was significantly lower in the tumors with I‐II TMN stage and smaller size, and significantly higher in serum exosome and infiltrated T cells of the patients with II‐IV TMN stage and bigger size (Table 2). The results might indicate that poorly differentiated gastric cancer with high proliferation and metastasis potential has a lower miR‐451 distribution within the tumor and higher miR‐451 in the infiltrated T cells and exosomes.
Table 2.
Comparison of miR‐451 expression in tumor tissues, serum exosome and infiltrated T cells within different clinical features
| Features | Exosome miR‐451 | Tumor tissue miR‐451 | Infiltrated T cell miR‐451 |
|---|---|---|---|
| TMN stage | |||
| I‐II | 0.08966 ± 0.002833, n = 34 | 0.05736 ± 0.001678, n = 34 | 0.04994 ± 0.001614, n = 34 |
| III‐IV | 0.1003 ± 0.002229, n = 42 (P = .0036) | 0.05006 ± 0.001293, n = 42 (P = .0008) | 0.05627 ± 0.001362, n = 42 (P = .0035) |
| Tumor size | |||
| ≤5 cm | 0.09022 ± 0.00229, n = 37 | 0.05662 ± 0.001539, n = 37 | 0.04989 ± 0.00168, n = 37 |
| >5 cm | 0.1021 ± 0.002698, n = 39 (P = .0013) | 0.0502 ± 0.001446, n = 39 (P = .0033) | 0.05683 ± 0.001174, n = 39 (P = .0013) |
miR, micro RNA.
3.2. Infiltrated T cells and exosome miR‐451 were indicators of poor prognosis of GC patients
Based on the results of the different distributions of miR‐451 in human gastric cancer, we postulated that miR‐451 in infiltrating T cells and exosomes might be partially derived from gastric cancer cells. To test this hypothesis, we further analyzed whether miR‐451 expression in tumor cells was associated with it in infiltrated T cells and exosome. Through a linear correlation study, the result revealed that expression of GC‐miR451 was negatively correlated to infiltrated T cells‐miR‐451 (Figure 2A), whereas exosome‐miR‐451 was positively correlated to infiltrated T cells‐miR‐451 (Figure 2B). This result might indicate that downregulation of miR‐451 in GC tissues might associate with infiltrated T cells miR‐451 and exosome‐miR‐451 by a secreting method.
Figure 2.
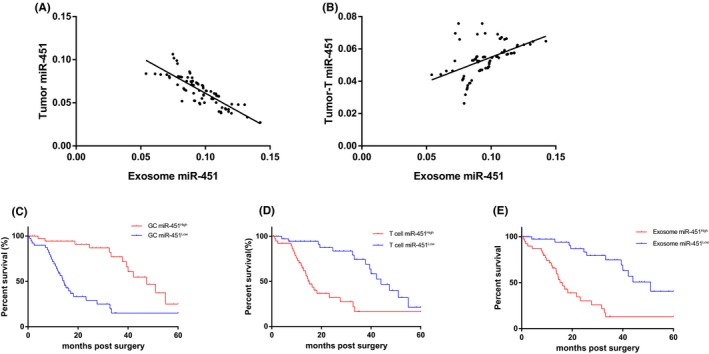
Infiltrated T cells and exosome microRNA‐451 (miR‐451) were indicators of poor prognosis of gastric cancer (GC) patients. Linear correlation studies were carried out by (A) tumor miR‐451 vs exosome miR‐451 and (B) tumor infiltrated T cell miR‐451 vs exosome miR‐451. Survival curve carried out using Kaplan‐Meier curve for post‐surgery patients by indicators of (C) tumor miR‐451, (D) tumor infiltrated T cells and (E) exosome miR‐451, respectively. All experiments were carried out in triplicate
We also carried out a follow‐up study to track the prognosis of GC patients involved our study with various sources of miR‐451. We divided GC patients into high and low expression groups according to the median of each group. For the GC‐miR‐451, the miR‐451Low group had a significantly poor prognosis compared to the miR‐451High group, with a 5‐year survival rate of 15.2% (HR = 3.454, 95% CI: 2.323‐4.507, P < .0001) (Figure 2C); for the infiltrated T cells, the miR‐451High group had a significantly poor prognosis with a 5‐year survival of 14.4% (HR = 4.100, 95% CI: 2.715‐4.631, P < .0001) (Figure 2D); for the exosomes, it was similar to the infiltrated T cells in that the miR‐451High group had a significantly poorer prognosis with a 5‐year survival of 15.9% (HR = 4.344, 95% CI: 2.853‐5.721, P < .0001) (Figure 2E). We compared these 3 indicators, and exosome miR‐451 is a relatively feasible and easily acquired indicator for predicting the prognosis of post‐surgery GC patients. Previous studies indicated that miR‐451 might negatively associate with the activity of mechanistic target of rapamycin (mTOR) which is an essential factor in glycolysis,27, 28 and mTOR activity was associated with Th17 cell differentiation.29, 30 Therefore, the association between exosome miR‐451 and Th17 cells will be further investigated.
3.3. Exosome miR‐451 was associated with Th17 distribution within infiltrated T cells
To investigate the role of miR‐451 in the tumor microenvironment (TME), we analyzed Th17 distribution within human GC. First, we determined Th17 percentage in the tumor infiltrated T cells. We defined Th17 as the subset of CD4+ IL‐17A+ RORγt+ T cells after we gated the cells with CD4, and we found that exosome‐miR‐451High GC patients had significantly more abundant Th17 (24.82 ± 0.7180, N = 42) than exosome‐miR‐451Low patients (19.78 ± 0.6816, n = 34) (P = .0016). Furthermore, we confirmed such result by IHC staining of RORγt. RORγt‐positive cells were non‐tumor infiltrated immune cells, and the exosome‐miR‐451High tissues had more positive cells than the exosome‐miR‐451Low tissues (Figure 3B). These results suggested that overexpression of miR‐451 in T cells was associated with Th17 differentiation.
Figure 3.
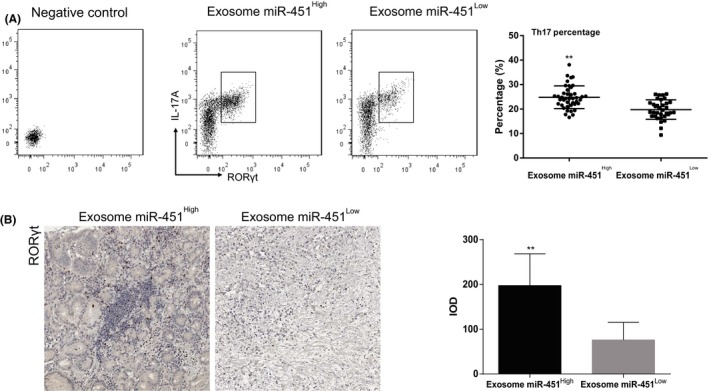
Exosome microRNA‐451 (miR‐451) was associated with T‐helper 17 (Th17) distribution within infiltrated T cells. A, Comparison of Th17 cell percentage within tumor infiltrated T cells between exosome miR‐451High and exosome miR‐451Low subgroups. Th17 were detected by using flow cytometry for CD4+ interleukin (IL)‐17A+ RORγt+ cells. B, Distribution of Th17 was detected using immunohistochemistry (IHC) for RORγt within gastric cancer tissues in exosome miR‐451High and exosome miR‐451Low subgroups. All experiments were carried out in triplicate; data are presented as mean ± SD. **P < .01. IOD, Integrated optical density
3.4. GC exosome‐derived miR‐451 might contribute to increased Th17 differentiation in low glucose condition
To test the hypothesis that infiltrated T cells and exosome miR‐451 is derived from GC cells, we set up a cancer cell‐T cell coculture system. Based on the previous studies indicating that expression of miR‐451 depended on the concentration of glucose,27 high and low glucose culture conditions were used. With the treatment of high glucose, miR‐451 was highly expressed mainly in GC cells, part of miR‐451 was enveloped in the exosome, and the expression of miR‐451 was relatively lower in the T cells cocultured with GC cells (Figure 4A). However, when we changed to the low glucose condition, the distribution of miR‐451 changed inversely, GC miR‐451 expression decreased while the T cells miR‐451 increased significantly. We noticed that the miR‐451‐positive exosome was detected out of the cancer cells (Figure 4A). Furthermore, as a control, we also detected miR‐451 expression in separated cultured T cells with low and high glucose, respectively. We found that miR‐451 expression in the low glucose medium was much lower than the expression in the high glucose medium (Figure 4A). Therefore, we can verify the postulation that miR‐451 can be transferred from GC cells to T cells by exosomes.
Figure 4.
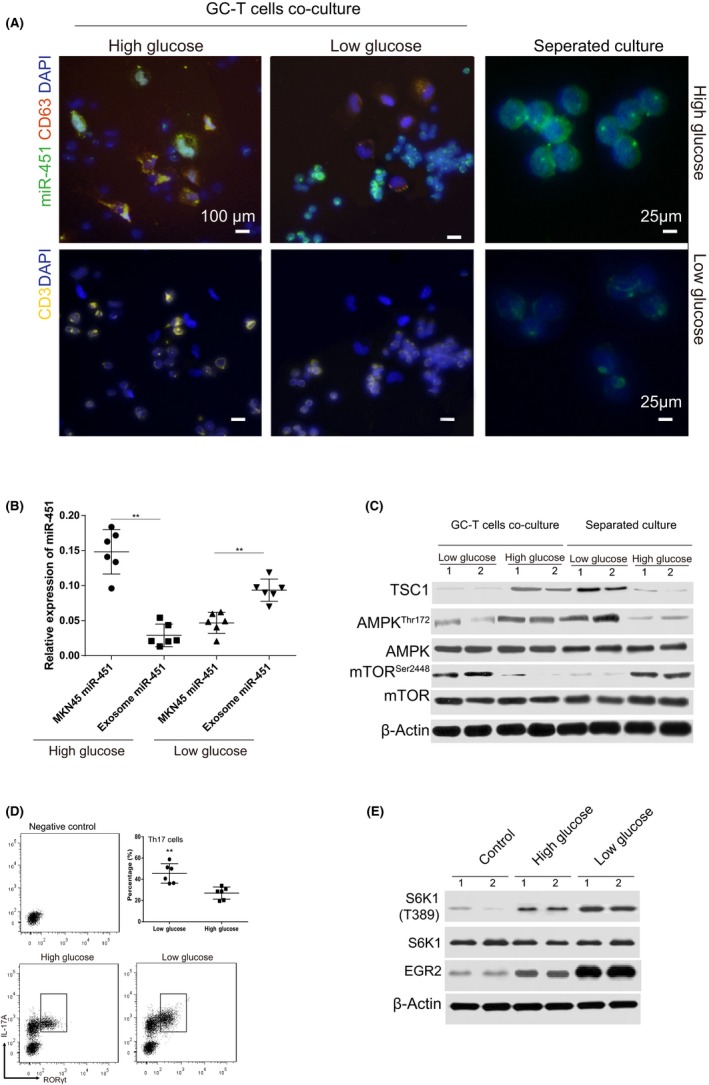
Gastric cancer (GC) exosome‐derived microRNA‐451 (miR‐451) might contribute to increased T‐helper 17 (Th17) differentiation in the low glucose condition. A, MNK45 and human peripheral T cells and T cells alone were cocultured using high (3.7 g/L) and low (1 g/L) glucose conditions for 48 h. Immunofluorescence staining was carried out to detect miR‐451 (cy3‐labeled miR‐451 probe), CD3 (Alexa Fluor® 647 labeled) and CD63 (cy5‐labeled Ab). B, Expression of miR‐451 was detected using real‐time PCR in different treatments indicated in the figure. C, T cells were isolated from the coculture system, and separating system described as above; the protein was extracted and analyzed with Abs for TSC1, AMPK (Thr172), total AMPK, mTOR (Ser2448), total mTOR and controlled by β‐Actin. D, Comparison of Th17 cell percentage with polarization simulations and treatments indicated in the figure. Th17 was detected using flow cytometry for CD4+ interleukin (IL)‐17A +RORγt+ cells. E, Activation of S6K1/EGR2 signaling was detected by using western blot in the GC tumor cocultured T cells treated differently. All experiments were carried out in triplicate; data are presented as mean ± SD. **P < .01
To confirm that miR‐451 can be secreted into cell culture medium by exosomes in low glucose conditions, MKN45 cells were treated with high and low glucose, and the expression of miR‐451 in cancer cells and exosomes was detected. Results revealed that expression of miR‐451 in MKN‐451 was decreased in the low glucose condition; on the contrary, exosome miR‐451 was increased in the low glucose condition compared to the high glucose condition (Figure 4B). We further investigated the expression of miR‐451 targeting gene TSC1 and its downstream pathway both in the cocultured T cells and in the separated cultured T cells. The results were interesting, as in the high glucose condition, expression of TSC1 in the separated cultured T cells showed no significant difference to the cocultured T cells downstream, including the activity of AMPK and mTOR (Figure 4B). However, it showed a significant difference in the low glucose condition; we found that the separated cultured T cells had a significantly low TSC1 expression, lower AMPK activity and higher mTOR activity than the cocultured T cells (Figure 4C). We also carried out a Th17 polarization stimulation assay using the GC‐T cells coculture method; the T cells were collected after 5 days stimulation, the result indicated that the Th17 percentage increased significantly in the low glucose condition (Figure 4D). The signaling pathway was also investigated, and we found that low glucose can increase activation of s6k1/ERG2 activation in GC cocultured T cells (Figure 4E) which was one of the signaling pathways regulating Th17 by mTOR.31 Taken together, we concluded that the increased percentage of Th17 might be as a result of increased miR‐451 within the infiltrated T cells, and the increased miR‐451 was GC exosome originated.
4. DISCUSSION
Several studies have indicated that miR‐451 is energy‐responding miRNA, the transcription of which can be modulated by some environmentally sensitive transcriptional factors and pathways such as OCT‐17, 27 and LKB1/AMPK28 in different types of cells. For instance, in glioma cells, overexpression of miR‐451 sensitized cells to glucose deprivation, suggesting that its downregulation is necessary for robust activation of LKB1 in response to metabolic stress. A similar result was also obtained from another independent group indicating that miR‐451 was negatively regulated through the phosphorylation and inactivation of its direct transcriptional activator OCT1 by AMPK, which is activated by glucose depletion‐induced metabolic stress.27 In the present study, we investigated such a phenomenon in a human gastric cancer cell; miR‐451 expression was enhanced with high glucose treatment and decreased significantly when the glucose level was low, and this regulation was TSC1/AMPK/mTOR‐related. However, at least 1 question remains: Where does miR‐451 go when the glucose level decreases? Besides the increased degeneration of miR‐451 itself, is there any possibility that miR‐451 was secreted out of the cells? Our results answered this question, and the answer is affirmative. We also think the results can be applied to explain one of our findings as to why the expression of miR‐451 was dramatically decreased in the cancer tissues compared to the non‐tumor tissues.
Many studies have shown that miR‐451 is downregulated in human GC; the downregulation of miR‐451 tends to be positively correlated with tumor stage, lymphatic metastasis and shorter overall survival of patients.8 Our results were similar to previous studies and, moreover, we found that miR‐451 expression was inversely related to both the infiltrated T cells and exosomes. High expression of miR‐451 in both tumor infiltrated T cells and exosomes can serve as an indicator of poor prognosis in post‐surgery GC patients. We postulated that secretion of miR‐451 from GC cells might be another reason for downregulation of miR‐451 in GC, because miR‐451 can be secreted from cancer cells, especially in the condition of low glucose which is a common condition in the tumor.
Exosomes are one of the hot spots in recent cancer research; related studies can be seen in many types of human malignancies19, 20 including leukemia, lymphoma, liver cancer, colorectal cancer, gastric cancer as well as other malignancies. It is one of the main mediators in charge of cellular communications. Exosomes are also one of the new focuses in TME studies. Cancer cells can modify immunity by sending signals including RNAs and proteins etc. to immune cells. For example, exosomes of patients with active head and neck cancers were effective in inducing apoptosis of CD8+ T cells, suppression of CD4+ T cell proliferation and upregulation of regulatory T cells (Treg) suppressor functions.16 Another study also indicated that exosome effects included selective impairment of IL‐2‐mediated CD25 upregulation, affecting all but the CD3(+)CD8(−) T‐cell subset. IL‐2‐induced Foxp3 expression by CD4(+)CD25(+) cells was not inhibited by tumor exosomes, and the suppressive function of CD4(+)CD25(+) T cells was enhanced by exosomes.32 In our study, we not only confirmed that cancer cells could modulate TME by exosomes, but also unveiled some mechanisms of exosome secretion from cancer cells. The cancer cells can switch their metabolism model by miR‐451 secretion and meanwhile change the Th17 confluence TME which can promote angiogenesis to obtain more energy.22, 23, 33
Conclusively, in our study, we found that exosome miR‐451 can serve as an indicator for poor prognosis of post‐surgery GC patients and that increased secretion of exosome miR‐451 can be triggered in a low glucose condition. Moreover, exosome miR‐451 can be transferred to T cells which increase their differentiation to Th17 cells. We think our findings not only highlight the possibility to apply exosome miR‐451 in clinical diagnosis, but also to enhance our knowledge of how tumor cells modify the microenvironment and thus to find feasible therapeutic strategies.
CONFLICT OF INTEREST
Authors declare no conflicts of interest for this article.
ACKNOWLEDGMENT
This work was supported by Medical science and technology innovation project of Nanjing Military Region (No. 14ZD24 to XD).
Liu F, Bu Z, Zhao F, Xiao D. Increased T‐helper 17 cell differentiation mediated by exosome‐mediated microRNA‐451 redistribution in gastric cancer infiltrated T cells. Cancer Sci. 2018;109:65–73. https://doi.org/10.1111/cas.13429
Funding information
This work was supported by Medical science and technology innovation project of Nanjing Military Region (No. 14ZD24 to XD).
REFERENCES
- 1. Pan X, Wang R, Wang ZX. The potential role of miR‐451 in cancer diagnosis, prognosis, and therapy. Mol Cancer Ther. 2013;12:1153‐1162. [DOI] [PubMed] [Google Scholar]
- 2. Zhan M, Miller CP, Papayannopoulou T, et al. MicroRNA expression dynamics during murine and human erythroid differentiation. Exp Hematol. 2007;35:1015‐1025. [DOI] [PMC free article] [PubMed] [Google Scholar]
- 3. Cheng D, Xu Y, Sun C, et al. MicroRNA‐451 sensitizes lung cancer cells to cisplatin through regulation of Mcl‐1. Mol Cell Biochem. 2016;423:85‐91. [DOI] [PubMed] [Google Scholar]
- 4. Wang R, Wang ZX, Yang JS, et al. MicroRNA‐451 functions as a tumor suppressor in human non‐small cell lung cancer by targeting ras‐related protein 14 (RAB14). Oncogene. 2011;30:2644‐2658. [DOI] [PubMed] [Google Scholar]
- 5. Bandres E, Bitarte N, Arias F, et al. microRNA‐451 regulates macrophage migration inhibitory factor production and proliferation of gastrointestinal cancer cells. Clin Cancer Res. 2009;15:2281‐2290. [DOI] [PubMed] [Google Scholar]
- 6. Gomes LL, Moreira FC, Hamoy IG, et al. Identification of miRNAs expression profile in gastric cancer using self‐organizing maps (SOM). Bioinformation. 2014;10:246‐250. [DOI] [PMC free article] [PubMed] [Google Scholar]
- 7. Ribeiro‐dos‐Santos A, Khayat AS, Silva A, et al. Ultra‐deep sequencing reveals the microRNA expression pattern of the human stomach. PLoS ONE. 2010;5:e13205. [DOI] [PMC free article] [PubMed] [Google Scholar]
- 8. Shen Y, Gong JM, Zhou LL, et al. MiR‐451 as a new tumor marker for gastric cancer. Oncotarget. 2017;8:56542‐56545. [DOI] [PMC free article] [PubMed] [Google Scholar]
- 9. Bergamaschi A, Katzenellenbogen BS. Tamoxifen downregulation of miR‐451 increases 14‐3‐3zeta and promotes breast cancer cell survival and endocrine resistance. Oncogene. 2012;31:39‐47. [DOI] [PMC free article] [PubMed] [Google Scholar]
- 10. Godlewski J, Bronisz A, Nowicki MO, et al. microRNA‐451: a conditional switch controlling glioma cell proliferation and migration. Cell Cycle. 2010;9:2742‐2748. [PubMed] [Google Scholar]
- 11. Nan Y, Han L, Zhang A, et al. MiRNA‐451 plays a role as tumor suppressor in human glioma cells. Brain Res. 2010;1359:14‐21. [DOI] [PubMed] [Google Scholar]
- 12. Avigad S, Verly IR, Lebel A, et al. miR expression profiling at diagnosis predicts relapse in pediatric precursor B‐cell acute lymphoblastic leukemia. Genes Chromosom Cancer. 2016;55:328‐339. [DOI] [PubMed] [Google Scholar]
- 13. Bruchova‐Votavova H, Yoon D, Prchal JT. miR‐451 enhances erythroid differentiation in K562 cells. Leuk Lymphoma. 2010;51:686‐693. [DOI] [PubMed] [Google Scholar]
- 14. Lopotova T, Zackova M, Klamova H, et al. MicroRNA‐451 in chronic myeloid leukemia: miR‐451‐BCR‐ABL regulatory loop? Leuk Res. 2011;35:974‐977. [DOI] [PubMed] [Google Scholar]
- 15. Su R, Gong JN, Chen MT, et al. c‐Myc suppresses miR‐451 dash, vertical YWTAZ/AKT axis via recruiting HDAC3 in acute myeloid leukemia. Oncotarget. 2016;7:77430‐77443. [DOI] [PMC free article] [PubMed] [Google Scholar]
- 16. Ludwig S, Floros T, Theodoraki MN, et al. Suppression of lymphocyte functions by plasma exosomes correlates with disease activity in patients with head and neck cancer. Clin Cancer Res. 2017;23:4843‐4854. [DOI] [PMC free article] [PubMed] [Google Scholar]
- 17. Brenner B, Hoshen MB, Purim O, et al. MicroRNAs as a potential prognostic factor in gastric cancer. World J Gastroenterol. 2011;17:3976‐3985. [DOI] [PMC free article] [PubMed] [Google Scholar]
- 18. Bardelli A, Pantel K. Liquid biopsies, what we do not know (yet). Cancer Cell. 2017;31:172‐179. [DOI] [PubMed] [Google Scholar]
- 19. Becker A, Thakur BK, Weiss JM, et al. Extracellular vesicles in cancer: cell‐to‐cell mediators of metastasis. Cancer Cell. 2016;30:836‐848. [DOI] [PMC free article] [PubMed] [Google Scholar]
- 20. Tkach M, Thery C. Communication by extracellular vesicles: where we are and where we need to go. Cell. 2016;164:1226‐1232. [DOI] [PubMed] [Google Scholar]
- 21. Bette‐Bobillo P, Vidal M. Characterization of phospholipase A2 activity in reticulocyte endocytic vesicles. Eur J Biochem. 1995;228:199‐205. [DOI] [PubMed] [Google Scholar]
- 22. Zhang JP, Yan J, Xu J, et al. Increased intratumoral IL‐17‐producing cells correlate with poor survival in hepatocellular carcinoma patients. J Hepatol. 2009;50:980‐989. [DOI] [PubMed] [Google Scholar]
- 23. Kuang DM, Peng C, Zhao Q, et al. Activated monocytes in peritumoral stroma of hepatocellular carcinoma promote expansion of memory T helper 17 cells. Hepatology. 2010;51:154‐164. [DOI] [PubMed] [Google Scholar]
- 24. Ma B, Tanese N. Combined FISH and immunofluorescent staining methods to co‐localize proteins and mRNA in neurons and brain tissue. Methods Mol Biol. 2013;1010:123‐138. [DOI] [PubMed] [Google Scholar]
- 25. Su Z, Zhao J, Rong Z, et al. MiR‐451, a potential prognostic biomarker and tumor suppressor for gastric cancer. Int J Clin Exp Pathol. 2015;8:9154‐9160. [PMC free article] [PubMed] [Google Scholar]
- 26. Gu X, Xue JQ, Han SJ, et al. Circulating microRNA‐451 as a predictor of resistance to neoadjuvant chemotherapy in breast cancer. Cancer Biomark. 2016;16:395‐403. [DOI] [PubMed] [Google Scholar]
- 27. Ansari KI, Ogawa D, Rooj AK, et al. Glucose‐based regulation of miR‐451/AMPK signaling depends on the OCT1 transcription factor. Cell Rep. 2015;11:902‐909. [DOI] [PMC free article] [PubMed] [Google Scholar]
- 28. Godlewski J, Nowicki MO, Bronisz A, et al. MicroRNA‐451 regulates LKB1/AMPK signaling and allows adaptation to metabolic stress in glioma cells. Mol Cell. 2010;37:620‐632. [DOI] [PMC free article] [PubMed] [Google Scholar]
- 29. Nagai S, Kurebayashi Y, Koyasu S. Role of PI3K/Akt and mTOR complexes in Th17 cell differentiation. Ann N Y Acad Sci. 2013;1280:30‐34. [DOI] [PubMed] [Google Scholar]
- 30. Kim JS, Sklarz T, Banks LB, et al. Natural and inducible TH17 cells are regulated differently by Akt and mTOR pathways. Nat Immunol. 2013;14:611‐618. [DOI] [PMC free article] [PubMed] [Google Scholar] [Retracted]
- 31. Kurebayashi Y, Nagai S, Ikejiri A, et al. Recent advances in understanding the molecular mechanisms of the development and function of Th17 cells. Genes Cells. 2013;18:247‐265. [DOI] [PMC free article] [PubMed] [Google Scholar]
- 32. Clayton A, Mitchell JP, Court J, et al. Human tumor‐derived exosomes selectively impair lymphocyte responses to interleukin‐2. Cancer Res. 2007;67:7458‐7466. [DOI] [PubMed] [Google Scholar]
- 33. Maniati E, Hagemann T. IL‐17 mediates resistance to anti‐VEGF therapy. Nat Med. 2013;19:1092‐1094. [DOI] [PubMed] [Google Scholar]