

Abstract
Ganglioside GD2 is specifically expressed in small‐cell lung cancer (SCLC) cells, leading to enhancement of malignant phenotypes, such as cell proliferation and migration. However, how GD2 promotes malignant phenotypes in SCLC cells is not well known. In this study, to reveal the mechanisms by which GD2 increases malignant phenotypes in SCLC cells, we used enzyme‐mediated activation of radical sources combined with mass spectrometry in GD2+ SCLC cells. Consequently, we identified ASC amino acid transporter 2 (ASCT2), a major glutamine transporter, which coordinately works with GD2. We showed that ASCT2 was highly expressed in glycolipid‐enriched microdomain/rafts in GD2+ SCLC cells, and colocalized with GD2 in both proximity ligation assay and immunocytostaining, and bound with GD2 in immunoprecipitation/TLC immunostaining. Malignant phenotypes of GD2+ SCLC cells were enhanced by glutamine uptake, and were suppressed by L‐γ‐glutamyl‐p‐nitroanilide, a specific inhibitor of ASCT2, through reduced phosphorylation of p70 S6K1 and S6. These results suggested that ASCT2 enhances glutamine uptake in glycolipid‐enriched microdomain/rafts in GD2+ SCLC cells, leading to the enhancement of cell proliferation and migration through increased phosphorylation of the mTOR complex 1 signaling axis.
Keywords: ASCT2, GD2, glutamine transporter, glycolipid, small‐cell lung cancer
Abbreviations
- ADC
antibody–drug conjugate
- ASCT2
ASC amino acid transporter 2
- EMARS
enzyme‐mediated activation of radical sources
- EphA2
ephrin type‐A receptor 2
- FA
FITC‐LC‐arylazide
- GEM
glycolipid‐enriched microdomain
- GPNA
L‐γ‐glutamyl‐p‐nitroanilide
- IP
immunoprecipitation
- LAT1
L‐type amino acid transporter 1
- MS
mass spectrometry
- mTORC1
mTOR complex 1
- NSCLC
non‐small‐cell lung cancer
- PDGFRα
platelet‐derived growth factor receptor α
- PLA
proximity ligation assay
- qPCR
quantitative PCR
- SCLC
small cell lung cancer
- TLC
thin‐layer chromatography
1. INTRODUCTION
Sialic acid‐containing glycolipids, gangliosides are highly expressed in GEM/rafts on the plasma membrane of cells.1, 2 Gangliosides GM1 and GM2 are generally expressed in lung cancer tissues,3 whereas GD3 and GD2 are specifically expressed in SCLC cells, based on the expression of GD3 synthase.3, 4 In addition, GD2 is expressed in neuroblastoma cells, and is a target molecule for treatment of the disease.5 Previous studies reported that GD2 enhances malignant phenotypes such as cell proliferation and invasion activity, and anti‐GD2 mAb induces apoptosis in SCLC cells.3, 4 However, it is not well known how GD2 promotes malignant phenotypes in SCLC cells.
ASC amino acid transporter 2 (SLC1A5)6, 7 is a major glutamine transporter that is highly expressed in several tumors, such as non‐SLCL, clear cell renal cell carcinoma, triple‐negative breast cancer, and neuroblastoma cells.8, 9, 10, 11, 12 In triple‐negative breast cancer cells, cell proliferation is increased by glutamine uptake by ASCT2, and the malignant phenotypes were decreased by GPNA, which specifically inhibits glutamine uptake by ASCT2.11 Moreover, the growth of NSCLC cells injected into the flank of nude mice was significantly suppressed by GPNA.13
Mammalian target of rapamycin complex 1 is deeply associated with malignant phenotypes of cancer cells. The loss of p53, a very common event in cancer, promotes activation of mTORC1 and malignant phenotypes.14, 15 Recently, it was reported that glutamine is a key amino acid to activate mTORC1 through Arf1 in lysosome lumen.16, 17 A downstream factor of mTORC1, p70 S6K1, is dephosphorylated by inhibiting glutamine uptake in triple‐negative breast cancer cells.11 Moreover, glutamine uptake by ASCT2 is also required for the activation of mTORC1 for T‐cell differentiation.18
Although roles of GD2 in malignant phenotypes of SCLC have been analyzed, there is no information about molecules interacting with GD2 in GEM/rafts. To date, it has been reported that GD3 interacts with membrane proteins in melanomas and glioma cells, which promotes malignant phenotypes of individual cancer cells.19, 20 In this study, we aimed to reveal the molecular mechanisms by which GD2 expressed on the membrane of SCLC cells induces malignant phenotypes, then used EMARS combined with MS21, 22 to address this aim. By EMARS combined with MS analysis, we identified molecules associating with GD2 in GEM/rafts of SCLC cells, and analyzed the interaction between GD2 and these target molecules. Consequently, we identified ASCT2 as a molecule associating with GD2 in SCLC cells. Here, we show the roles of ASCT2 in GD2+ SCLC cells, and the mechanisms by which GD2 and ASCT2 co‐operate in the enhancement of malignant phenotypes of SCLC cells.
2. MATERIALS AND METHODS
2.1. Cell culture
D‐8, D‐13, and D‐18 were SK‐LC‐17 transfected with GD3 synthase cDNA, and C‐2, C‐6, and C‐8 were SK‐LC‐17 transfected with a control vector.3, 23 Human α‐2,8‐sialyltransferase (GD3 synthase) cDNA clone pD3T‐31 was subcloned into pMIKneo vector (Assoc. Prof. Kazuo Maruyama, Dep. Hygiene, Tokyo Medical Dental University, Tokyo, Japan) to obtain the pMIKneo/D3T‐31.23 SK‐LC‐17 cell lines used for cDNA transfection were plated on a 60‐mm plastic tissue culture plate at a density of 6 × 10⁵ cells/4 mL/plate. After 24 hours, the medium was removed and the cells were washed twice with serum‐free DMEM. The pMIKneo/D3T‐31 vector (4 μg) was mixed with Lipofectamine 2000 (Thermo Fisher Scientific, Waltham, MA, USA), then added to the cells in the plate. After 6 hours of incubation, the medium was changed to the regular one as described above. Stable transfectants were selected with 250 μg/mL G418. Other SCLC cell lines, NCI‐N417 and ACC‐LC‐171, were described previously.3 These cell lines were cultured in RPMI‐1640 supplemented with 10% FCS and G418 (250 μg/mL) at 37°C in a humidified atmosphere containing 5% CO2.
2.2. Construction and transfection of expression vectors
GD3 synthase cDNA was previously described.23 The cDNA of human ASCT2 was subcloned into pCMV‐Tag 3 vector. The pCMV‐Tag 3 vector is used to induce transient expression of an N‐terminal c‐myc fusion protein in SK‐LC‐17 cells.
2.3. Antibodies and reagents
Mouse anti‐GD3 mAb (R‐24) was obtained from Dr. L.J. Old (Memorial Sloan Kettering Cancer Center, New York, NY, USA). Mouse anti‐GD2 mAb (220‐51) was generated in our laboratory. Rabbit anti‐flotillin‐1 antibody, rabbit anti‐caveolin‐1 antibody, mouse anti‐CD109 mAb, rabbit anti‐PDGFRα antibody, goat anti‐ASCT2 antibody, and mouse anti‐c‐myc antibody were purchased from Santa Cruz Biotechnology (Santa Cruz, CA, USA). Rabbit anti‐ASCT2 antibody, rabbit anti‐phospho‐mTOR antibody (Ser2448), rabbit anti‐mTOR mAb, mouse anti‐phospho‐p70 S6 kinase mAb (Thr389), rabbit anti‐p70 S6 kinase mAb, rabbit anti‐S6 ribosomal protein mAb, rabbit anti‐phospho‐S6 ribosomal protein mAb (Ser235/Ser236), rabbit anti‐EphA2 mAb, and rabbit anti‐CD44 antibody were purchased from Cell Signaling Technology (Danvers, MA, USA). Goat anti‐urokinase plasminogen activator surface receptor antibody was purchased from R&D Systems (Minneapolis, MN, USA). Rabbit anti‐c‐myc antibody was purchased from Sigma‐Aldrich (St. Louis, MO, USA). Rabbit anti‐ASCT2 conjugated with Alexa 488 was purchased from Bioss (Woburn, MA, USA).
2.4. Flow cytometry
Surface expression of ganglioside GD2, GD3, and ASCT2 on SK‐LC‐17 transfectants was analyzed by FACSCalibur (Becton Dickinson, Franklin Lakes, NJ, USA) using anti‐GD2 mAb (220‐51), anti‐GD3 mAb (R24), and goat anti‐ASCT2 antibody. Cells (8.0 × 10⁵) were trypsinized and washed with PBS three times. The cells were incubated with the primary antibodies for 60 minutes on ice, then incubated with FITC‐conjugated anti‐mouse IgG antibody and anti‐goat IgG antibody for 45 minutes. After washing with PBS, relative expression levels of GD2, GD3, and ASCT2 were analyzed by FACSCalibur.
2.5. Enzyme‐mediated activation of radical sources and MS analysis
The EMARS reactions and MS analysis were carried out as described previously.21, 22 Briefly, D‐13 and D‐18 cells (5.0 × 10⁵) were treated with 10 μg/mL HRP‐conjugated monovalent anti‐GD2 mAb (220‐51) in 2% BSA/PBS at room temperature for 20 minutes. After washing with PBS, cells were incubated with FA solution diluted in PBS (0.1 mmol/L FA/PBS) at room temperature for 15 minutes with light shielding. After washing twice with PBS, treated cells were scraped with 100 mmol/L Tris‐HCl (pH 7.4) and 1 mmol/L PMSF. Molecules labeled with FITC were immunoprecipitated with an anti‐FITC antibody and served for MS analysis. Horseradish peroxidase‐conjugated monovalent anti‐GD2 mAb (220‐51) was prepared using a Peroxidase Labeling Kit‐SH (Dojindo, Kumamoto, Japan). Immunoprecipitates were dissolved in MS sample buffers (12 mmol/L sodium deoxycholate, 12 mmol/L sodium lauroylsarcosine, and 100 mmol/L Tris‐HCl [pH 8.0]), boiled at 95°C, and centrifuged at 20 000 g for 15 minutes. The supernatants underwent reduction with dithiothreitol and alkylation with iodoacetamide. The samples were diluted fivefold with 50 mmol/L ammonium bicarbonate and digested by Lys‐C (Wako, Osaka, Japan) for 3 hours, then by trypsin for 8 hours at 37°C. They were desalted and concentrated with C18 StageTips (Thermo Fisher Scientific, Waltham, MA, USA). Mass spectrometry was undertaken using an LTQ‐Orbitrap‐XL MS mass spectrometer (Thermo Fisher Scientific) system combined with a Paradigm MS4 high‐performance TLC system (Michrom BioResources, Auburn, CA, USA). Tandem MS spectra were submitted to the program Mascot 2.3 (Matrix Science, Boston, MA, USA) and X! Tandem (The Global Proteome Machine; http://www.thegpm.org/tandem/) for MS/MS ion search. Mascot was set up to search the Sprot_2013_6 database (selected for Homo sapiens, 20, 249) assuming the digestion enzyme trypsin.
2.6. Western blot analysis
After washing with PBS three times, cells were lysed by cell lysis buffer (20 mmol/L Tris‐HCl [pH 7.5], 150 mmol/L NaCl, 1 mmol/L Na2EDTA, 1 mmol/L EGTA, 1% Triton X‐100, 2.5 mmol/L sodium pyrophosphate, 1 mmol/L β‐glycerophosphate, 1 mmol/L Na3VO4, and 1 μg/mL leupeptin) (Cell Signaling Technology) supplemented with a protease inhibitor cocktail (Merck, Darmstadt, Germany). Cell lysates were sonicated briefly, and were centrifuged at 14 000 g for 10 minutes to remove insoluble materials. Proteins in supernatants were measured by the DC protein assay (Bio‐Rad, Hercules, CA, USA), and proteins were separated in SDS‐PAGE using 10% gels. Separated proteins were transferred onto an Immobilon‐P membrane (EMD Millipore, Billerica, MA, USA), and blots were incubated with 5% skim milk in PBS including 0.05% Tween‐20 for blocking. The membrane was probed with primary antibodies and HRP‐labeled secondary antibodies sequentially, and bound conjugates on the membrane were visualized with an Enhanced Chemiluminescence detection system (PerkinElmer, Waltham, MA, USA).
2.7. Thin‐layer chromatography immunostaining
Immunoprecipitates were extracted by treating with chloroform / methanol (2:1, v/v). After evaporation of solvents under N2 gas stream, lipids were dissolved in distilled water and loaded to Sep‐Pak C18 cartridges (Waters, Milford, MA, USA). After washing with distilled water, lipids were eluted by methanol and a chloroform/methanol mixture (2:1 and 1:1, v/v) sequentially. The extracts were dried under an N2 gas stream and dissolved in 30 μL chloroform/methanol (2:1, v/v). Extracted lipids were separated using high‐performance TLC plates (Merck). These lipids were developed using a solvent system of chloroform/methanol/0.22% CaCl2 (55:45:10, v/v/v) and blotted onto a PVDF membrane (Atto, Tokyo, Japan) using TLC Thermal Blotter (AC‐5970; Atto). After blocking with 3% BSA in PBS, the membrane was incubated with an anti‐GD2 mAb (220‐51) or an anti‐GD3 mAb (R24) for 60 minutes. Biotin‐conjugated anti‐mouse IgG antibody was then incubated for 30 minutes, and ABC reagent (Vector Laboratories, Burlingame, CA, USA) was incubated for 30 minutes. Bound conjugates on the membrane were visualized with an Enhanced Chemiluminescence detection system (PerkinElmer).
2.8. Immunoprecipitation
Cells (3.0 × 10⁶) were seeded on 10‐cm dishes. After 24 hours, c‐myc‐tag ASCT2 was transfected into cells using Lipofectamine 2000 (Thermo Fisher Scientific) and incubated for 48 hours. Cells were lysed with lysis buffer containing 1% Triton X‐100. Lysates were centrifuged at 14 000 g for 10 minutes at 4°C to remove insoluble materials, and were immunoprecipitated with anti‐c‐myc antibody at 4°C overnight with rotation. Protein G‐Sepharose (GE Healthcare, Little Chalfont, UK) was added and rotated at 4°C for 2 hours. The beads were washed three times with IP buffer (50 mmol/L Tris‐HCl [pH 7.4], 150 mmol/L NaCl, and 1 mmol/L Na3VO4) containing 0.5% Triton X‐100, and the precipitated proteins were separated with SDS‐PAGE to be used for immunoblotting.
2.9. Quantitative PCR
Extraction of RNAs was carried out using TRIzol reagent (Ambion by Life Technologies, Carlsbad, CA, USA) following the manufacturer's protocol. cDNA was generated using oligo dT primer and Moloney murine leukemia virus reverse transcriptase (Invitrogen, San Diego, CA, USA). The qPCR was carried out using a DyNAmo SYBR Green qPCR Kit (Thermo Fisher Scientific) and CFX Connect Real‐Time System (Bio‐Rad). Primers used in this study were: ASCT2 forward, 5′‐CTCCTTGATCCTGGCTGTGG‐3′; and reverse, 5′‐CCCAGAGCGTCACCTTCTAC‐3′.
2.10. Sucrose density gradient fractionation of Briji35 extracts
Sucrose density gradient fractionation was carried out as reported previously with modification.24 Briefly, cells (1.0 × 10⁷) were lysed by MES + NaCl + EDTA (MNE) buffer containing 1% Briji35. After removing insoluble materials by centrifugation at 14 000 g for 10 minutes, lysates were dounced 10 times with a Digital Homogenizer (As One, Osaka, Japan). The lysates were mixed with an equal volume of 80% sucrose in MNE buffer, and stepwise gradient was prepared by overlaying 30% sucrose in MNE buffer followed by a final layer of 5% sucrose in MNE buffer. The gradient was formed by centrifugation for 14‐16 hours at 4°C at 100 000 g using an MLS50 rotor (Beckman Coulter, Brea, CA, USA). Fractions of 500 μL were separated from the top of the gradient and were used for Western blot analyses.
2.11. Isolation of cell surface proteins by biotin labeling
Biotin labeling and isolation of cell surface proteins were carried out with a Cell Surface Protein Isolation Kit (Thermo Fisher Scientific), following the manufacturer's protocol. Briefly, cells (1.0 × 10⁷) were washed using ice‐cold PBS three times, and surface proteins were labeled with sulfo‐NHS‐SS‐Biotin for 30 minutes. Subsequently, cells were lysed in cell lysis buffer (20 mmol/L Tris‐HCl [pH 7.5], 150 mmol/L NaCl, 1 mmol/L Na2EDTA, 1 mmol/L EGTA, 1% Triton X‐100, 2.5 mmol/L sodium pyrophosphate, 1 mmol/L β‐glycerophosphate, 1 mmol/L Na3VO4, and 1 μg/mL leupeptin) (Cell Signaling Technology) supplemented with a protease inhibitor cocktail (Merck) and spun at 14 000 g at 4°C to remove insoluble materials. Biotin‐labeled surface proteins were captured on NeutrAvidin agarose resin at room temperature for 1 hours. After the resin was washed, proteins bound to the resin were eluted with 1× SDS‐PAGE sample buffer, and analyzed by Western blotting.
2.12. Immunocytochemistry
Cells (2 × 10⁵) were plated on a glass‐bottomed dish (Iwaki, Tokyo, Japan) precoated with 0.01% poly‐L‐lysine (Sigma‐Aldrich) and incubated for 24 hours in RPMI‐1640 supplemented with 10% FCS. Cells were transfected with c‐myc‐tag ASCT2 cDNA using Lipofectamine 2000 (Thermo Fisher Scientific) and incubated for 24 hours. After washing three times with PBS, cells were fixed with 4% paraformaldehyde in PBS for 10 minutes at room temperature. Dishes were then blocked with 10% donkey serum albumin in PBS for 1 hours and incubated with anti‐GD2 mAb (220‐51) and anti‐c‐myc antibody diluted in 0.5% donkey serum albumin in PBS. After incubation with primary antibodies for 1 hour at room temperature, dishes were washed with PBS and incubated with an Alexa 568‐conjugated anti‐mouse IgG antibody and Alexa 488‐conjugated anti‐rabbit IgG antibody (Invitrogen) in 0.5% donkey serum albumin in PBS for 1 hour at room temperature. After washing dishes with PBS, DAPI staining was carried out, and then cells were observed under a confocal microscope (LSM 700; Carl Zeiss, Oberkochen, Germany).
2.13. Proximity ligation assay
Proximity ligation assay was carried out using a Duolink in situ PLA kit (Sigma‐Aldrich), following the manufacturer's protocol. Briefly, cells (2 × 10⁵) were plated on a glass‐bottomed dish (Iwaki) precoated with 0.01% poly‐L‐lysine (Sigma‐Aldrich), and incubated for 24 hours in RPMI‐1640 supplemented with 10% FCS. Cells were transfected with c‐myc‐tag ASCT2 cDNA using Lipofectamine 2000 (Thermo Fisher Scientific) and incubated for 24 hours. After washing three times with PBS, cells were fixed with 4% paraformaldehyde in PBS for 10 minutes at room temperature. Dishes were then blocked with 10% donkey serum albumin in PBS for 1 hour and incubated with anti‐GD2 mAb and anti‐c‐myc antibody diluted in 0.5% donkey serum albumin in PBS. Duolink in situ PLA probes anti‐mouse PLUS and anti‐rabbit MINUS were added and incubated for 1 hour at 37°C. Ligation solution was added, followed by incubation for 30 minutes at 37°C. Amplification was carried out for 100 minutes at 37°C. Cells were observed under a confocal microscope (Fluoview FV10i; Olympus, Tokyo, Japan).
2.14. Cell proliferation assay
Cells (2.0 × 10³) were plated in 96‐well plates and incubated for 1‐5 days in RPMI‐1640 (containing no glutamine) supplemented with 10% dialyzed FCS and glutamine (5 mmol/L). After culturing for 1‐5 days, 20 μL MTT solution (5 mg/mL in PBS) was added and incubated for 4 hours at 37°C. The reaction was stopped by adding 1‐propanol containing 0.4% HCl and 0.1% NP‐40. The absorption values at 590 nm were then determined using an automatic plate reader (ImmunoMini NJ‐2300; Nalgene Nunc, NY, USA).
2.15. [3H]‐glutamine uptake
The [3H]‐glutamine uptake experiment was carried out as described previously, with modification.25 Briefly, cells (2.0 × 10⁵) were cultured in serum‐free RPMI‐1640 supplemented with 1 nmol/L tritium‐labeled glutamine for 1 minute, and cells were washed using ice‐cold PBS three times and lysed. Radioactivity was counted by a liquid scintillation counter (Beckman Coulter).
2.16. In vitro migration assay
The confluent cells were scratched with a 1000‐μL disposable plastic pipette tip and gently washed using RPMI‐1640 twice. The cells were cultured in RPMI‐1640 containing 10% FCS supplemented with or without 1 mmol/L GPNA. The cells were allowed to migrate towards the wound space for 16 hours, then migration rates were measured by taking pictures under a microscope (migration area of 16‐0 hours).
2.17. Knockdown of ASCT2 in SK‐LC‐17 transfectants
The ASCT2‐specific siRNAs #1, #2, and #3 (Sigma‐Aldrich) or scramble siRNA (200 pmol) were transfected into cells (1.0 × 10⁶) by Lipofectamine 2000 (Thermo Fisher Scientific).
2.18. Statistical analysis
Mean values were calculated using an unpaired Student's two‐tailed t‐test. P‐values of <.05 were considered statistically significant.
3. RESULTS
3.1. Enzyme‐mediated activation of radical sources/MS in GD2+ SK‐LC‐17 cells identifies five candidate molecules
GD2 is specifically expressed on SCLC cells, and promotes malignant phenotypes. In order to analyze the roles of GD2 in SCLC cells, we transfected GD3 synthase cDNA into GD2− SK‐LC‐17 cells, and established SK‐LC‐17 transfectants D‐8, D‐13, and D‐18 highly expressing GD3 and GD23 (Figures 1A, S1). C‐2, C‐6, and C‐8 are GD2− SK‐LC‐17 transfectants (Figures 1A, S1). Tumor‐specific gangliosides coordinately work with plasma membrane proteins in cancer cells, which leads to enhancement of malignant phenotypes.19, 20 However, it is not well known what kind of plasma membrane proteins work together with GD2 in SCLC cells. To address this issue, we tried to identify GD2‐associating molecules by EMARS‐MS in GD2+ SK‐LC‐17 transfectants, D‐13 and D‐18 (a scheme of EMARS is shown in Figure 1B). In this method, molecules located within a 100‐200‐nm diameter of GD2 were labeled with FITC by radical reaction of an aryl azide functional group.21, 22 Then FITC‐labeled molecules were collected by immunoprecipitation using an anti‐FITC antibody (Figure 1C). These EMARS‐IP samples were applied to liquid chromatography–MS/MS analyses to identify the labeled molecules. We succeeded in identifying 15 plasma membrane proteins as GD2‐associating molecules in D‐13 and D‐18 (Figure 1D, Table 1). Among the common GD2‐associating molecules between D‐13 and D‐18, we focused on five candidate molecules, ASCT2, CD109, urokinase plasminogen activator surface receptor, CD44, and EphA2, because the scores of these molecules were high (protein identification probabilities were more than 99%), and they were classified into membrane molecules.
Figure 1.
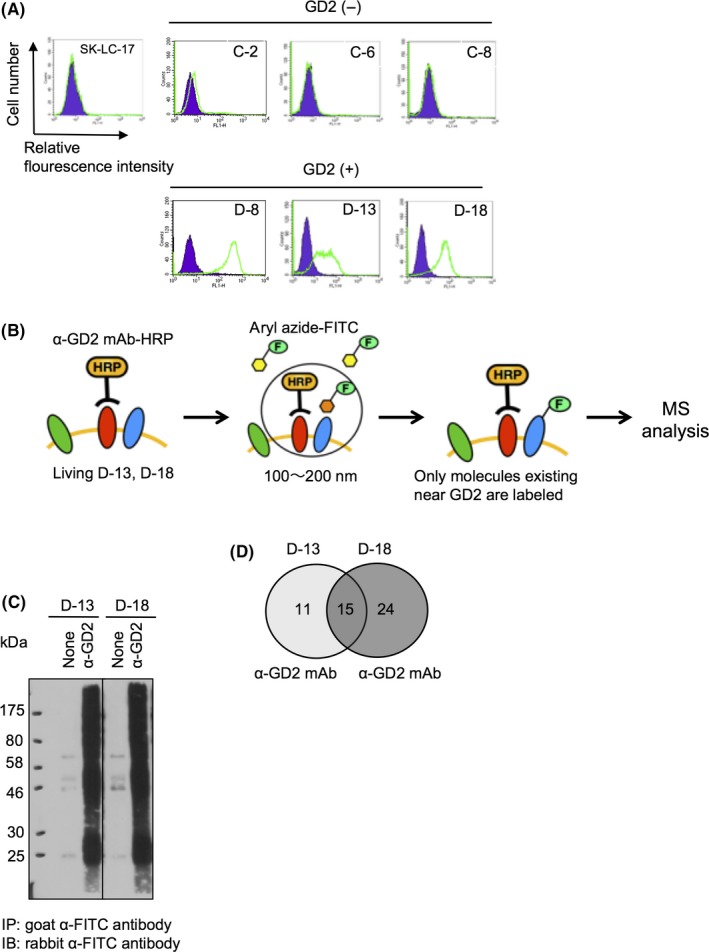
Enzyme‐mediated activation of radical sources (EMARS)/mass spectrometry (MS) in ganglioside GD2+ SK‐LC‐17 small‐cell lung cancer cells identified five candidate molecules. A, Expression levels of GD2 in SK‐LC‐17 transfectants were analyzed by flow cytometry. B, Scheme of EMARS combined with liquid chromatography (LC)/MS. EMARS reaction was carried out using HRP‐conjugated anti‐GD2 mAb (α‐GD2 mAb‐HRP) as an anchor, and fluorescein‐LC‐ASA. Molecules labeled with FITC by EMARS reaction were immunoprecipitated using rabbit anti‐FITC antibody, and the samples were applied to LC/MS. C, Immunoprecipitates in EMARS reaction were analyzed by Western blotting with a goat anti‐FITC antibody. Control (none) was prepared without anti‐GD2 mAb (220‐51). D, Number of identified plasma membrane proteins to be associated with GD2 by EMARS shown in Venn diagrams. We considered that protein identification probabilities are >50%. IB, immunoblot; IP, immunoprecipitant
Table 1.
Candidate molecules associating with ganglioside GD2 as defined in enzyme‐mediated activation of radical sources–mass spectrometry
| # | Protein name | Accession | Probabilities | ||
|---|---|---|---|---|---|
| M.W. (kDa) | D‐13 (%) | D‐18 (%) | |||
| 1 | Adenylyl cyclase‐associated protein 1 | CAP1_HUMAN | 52 | 100 | 100 |
| 2 | Elongation factor 1 ‐α1 | EF1A1_HUMAN | 50 | 100 | 100 |
| 3 | Ubiquitin‐40S ribosomal protein S27a | RS27A_HUMAN | 18 | 100 | 100 |
| 4 | ADP/ATP translocase 2 | ADT2_HUMAN | 33 | 100 | 100 |
| 5 | Keratin, type II cytoskeletal 8 | K2C8_HUMAN | 54 | 100 | 100 |
| 6 | CD109 | CD109_HUMAN | 162 | 100 | 100 |
| 7 | Ephrin type‐A receptor 2 | EPHA2_HUMAN | 108 | 100 | 100 |
| 8 | Desmoglein‐2 | DSG2_HUMAN | 122 | 100 | 100 |
| 9 | Phosphate carrier protein, mitochondrial | MPCP_HUMAN | 40 | 100 | 99 |
| 10 | Urokinase plasminogen activator surface receptor | UPAR_HUMAN | 37 | 100 | 99 |
| 11 | Glyceraldehyde‐3‐phosphate dehydrogenase | G3P_HUMAN | 36 | 99 | 100 |
| 12 | CD44 antigen | CD44_HUMAN | 82 | 99 | 100 |
| 13 | ASC amino‐acid transporter 2 | AAAT_HUMAN | 57 | 99 | 100 |
| 14 | Syndecan‐2 | SDC2_HUMAN | 22 | 83 | 90 |
| 15 | Ig κ chain V‐I region Roy | KV116_HUMAN | 12 | 97 | 93 |
M.W., molecular weight.
We considered that scores (probabilities) of the molecules were >50, and common candidate molecules associating with GD2 between D‐13 and D‐18 are shown.
3.2. ASC amino acid transporter 2 associated with GD2 in GEM/rafts
Next, we examined which candidate molecules more specifically work with GD2 in SCLC cells. Gangliosides are mainly expressed on the plasma membrane and localized in GEM/rafts,1, 2 and we predicted that these five candidate molecules are highly expressed in GEM/rafts. Therefore, we fractionated detergent extracts from SK‐LC‐17 transfectants by sucrose density‐gradient ultracentrifugation,24 and analyzed levels of ASCT2, CD109, urokinase plasminogen activator surface receptor, CD44, and EphA2 expression in the raft fractions of SK‐LC‐17 transfectants (Figure 2A). Interestingly, ASCT2 was highly expressed in GEM/rafts of GD2+ SK‐LC‐17 transfectants, whereas it was only minimally detected in GEM/rafts of GD2− SK‐LC‐17 transfectants (Figures 2A, S2). The expression level of EphA2 in the raft fractions of GD2+ SK‐LC‐17 transfectants was also higher than in GD2− SK‐LC‐17 transfectants (Figures 2A, S2). Although EphA2 has emerged to be strongly associated with malignant phenotypes in glioma cells and lung cancer cells,26, 27 the function of ASCT2 has been poorly understood in SCLC cells. Therefore, we focused on ASCT2, and studied the association between ASCT2 and GD2. We selected C‐2, C‐8, D‐8, and D‐13 clones, because expression levels of ASCT2 in GEM/rafts were very different among them. Surprisingly, total expression levels of ASCT2 in all SK‐LC‐17 transfectants were not considerably different (Figure 2B). In addition, expression levels of ASCT2 on the plasma membrane among SK‐LC‐17 transfectants were not largely different (Figure S3).
Figure 2.
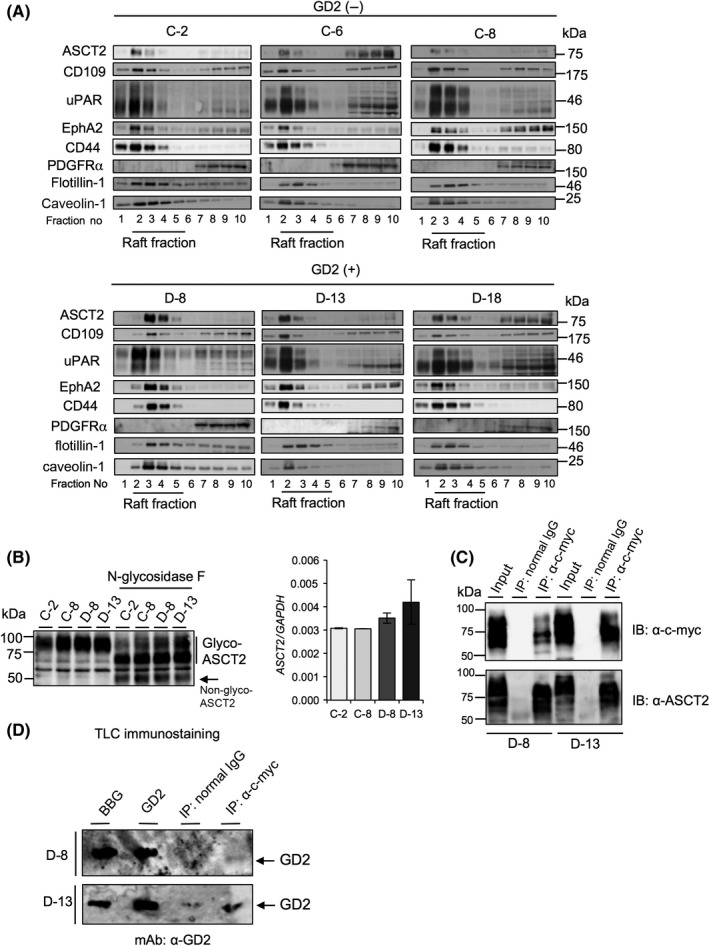
ASC amino acid transporter 2 (ASCT2) associated with ganglioside GD2 in glycolipid‐enriched microdomain (GEM)/rafts. A, Fractionation of 1% Briji35 extracts from GD2+ SK‐LC‐17 transfectants was carried out by sucrose density gradient ultracentrifugation. Cells (1.0 × 10⁷) were lysed by MES + NaCl + EDTA (MNE) buffer containing 1% Briji35. The lysates were mixed with an equal volume of 80% sucrose in MNE buffer, and stepwise gradient was prepared by overlaying 30% sucrose in MNE buffer followed by a final layer of 5% sucrose in MNE buffer. The gradient was formed by ultracentrifugation for 14‐16 h at 4°C at 100 000 g. Fractions of 500 μL were separated from the top of the gradient and used for Western blotting. Caveolin‐1 and flotillin‐1 are GEM/raft markers. B, Total expression levels of ASCT2 were analyzed by Western blotting using an anti‐ASCT2 antibody (left panel). N‐linked glycosylation was deleted using N‐glycosidase F. Expression levels of ASCT2 mRNA were analyzed by RT–quantitative PCR (right panel). Expression levels of ASCT2 mRNA were normalized by the GAPDH gene. C, Results of immunoprecipitation (IP)–immunoblotting (IB) experiments. Cells (1.0 × 10⁶) were transfected with c‐myc‐tag ASCT2 cDNA and incubated for 48 h. Cells were lysed by lysis buffer containing 1% Triton X‐100, and c‐myc‐tag ASCT2 was immunoprecipitated using an anti‐c‐myc antibody. Total cell lysate was used as input. D, After immunoprecipitation, thin‐layer chromatography (TLC) immunostaining was undertaken using anti‐GD2 mAb (220‐51) to detect GD2. Bovine brain gangliosides (BBG, 1.0 μg) and pure GD2 (0.25 μg) were used as standards
Based on high expression of ASCT2 in GEM/rafts, we examined whether ASCT2 binds with GD2. We transfected c‐myc‐tag ASCT2 cDNA into GD2+ SK‐LC‐17 cells, and undertook immunoprecipitation and immunoblotting using anti‐c‐myc antibody and anti‐ASCT2 antibody, respectively (Figure 2C). The IP products with anti‐c‐myc antibody were applied to TLC immunostaining to detect GD2. Consequently, we found that GD2 was co‐precipitated with ASCT2 (Figure 2D), suggesting molecular complex formation of ASCT2 and GD2. In IP–TLC immunostaining, background was sometimes high, and faint bands were detected in IP with the normal IgG lane if we want to show definite bands of GD2 in ASCT2 precipitates (Figure 2D). In turn, GD3 was not co‐precipitated with ASCT2 (Figure S4). We tried to further confirm that GD2 was co‐precipitated with ASCT2 in other SCLC cells, NCI‐N417 and ACC‐LC‐171 expressing endogenous GD2 (Figure S5A). We undertook IP–TLC immunostaining (Figure S5B,C). Unfortunately, we did not find that GD2 was co‐precipitated with ASCT2, probably due to poor transfection efficiency (Figure S5B,C). Next, to reveal whether ASCT2 was really a specific molecule to GD2, we examined whether a membrane protein binds with GD2. Previously, we reported that PDGFRα was identified as a molecule associating with GD3 by EMARS‐MS, and interacts with GD3 in glioma cells.19 In SK‐LC‐17 transfectants, PDGFRα was expressed in the non‐raft fraction (Figure 2A), and GD2 was not co‐precipitated with PDGFRα (Figure S6). Taking these results together, ASCT2 is specifically expressed in GEM/rafts of GD2+ SK‐LC‐17 transfectants, and associated with GD2, thereby promoting malignant phenotypes.
3.3. Colocalization of ASCT2 with GD2 in GEM/rafts
Next, we undertook immunofluorescence/double staining to examine whether ASCT2 is colocalized with GD2. c‐Myc‐tag ASCT2 derived from transfected cDNA was detected in a restricted portion of the cytoplasm and plasma membrane. It was colocalized with GD2 on the plasma membrane of GD2+ SK‐LC‐17 transfectants (Figure 3A). As for endogenous ASCT2, we found that it was also colocalized with GD2 (Figure S7). As caveolin‐1 is a GEM/raft marker, we examined whether c‐myc‐tag ASCT2 was colocalized with caveolin‐1. As a result, we found that c‐myc‐tag ASCT2 was colocalized with caveolin‐1 on the plasma membrane in GD2+ SK‐LC‐17 transfectants (Figure 3B). Although we described that GD2 was not precipitated with ASCT2 in other SCLC cell lines, NCI‐N417 and ACC‐LC‐171 (Figure S5B,C), we found that GD2 was colocalized with both endogenous and exogenous ASCT2 (Figure S8).
Figure 3.
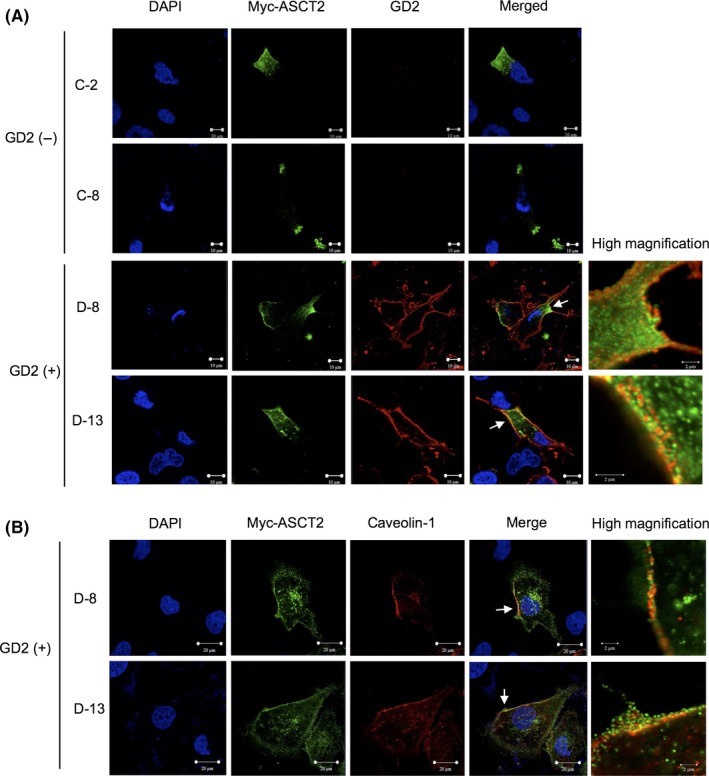
ASC amino acid transporter 2 (ASCT2) colocalized with ganglioside GD2 in glycolipid‐enriched microdomain/rafts. A, GD2 and c‐myc‐tag ASCT2 were immunostained simultaneously. SK‐LC‐17 transfectants were transfected with c‐myc‐tag ASCT2 cDNA. Cells were double‐immunostained with an anti‐c‐myc antibody and an anti‐GD2 mAb (220‐51). After incubation with Alexa 488‐conjugated anti‐rabbit IgG antibody and Alexa 568‐conjugated anti‐mouse IgG antibody as secondary antibodies, cell nuclei were stained with DAPI, and results were observed under a confocal microscope. Scale bar = 10 μm (left) and 2 μm (right, high magnification). B, GD2+ SK‐LC‐17 transfectants were double‐immunostained with an anti‐c‐myc antibody and an anti‐caveolin‐1 antibody. After incubation with Alexa 488‐conjugated anti‐mouse IgG antibody and Alexa 568‐conjugated anti‐rabbit IgG antibody as secondary antibodies, cell nuclei were stained with DAPI. Scale bar = 20 μm (left) and 2 μm (right, high magnification). Areas of high magnification indicated by arrows
This result of the double immunofluorescence study was not enough to confirm a close association between GD2 and ASCT2. Therefore, we undertook the PLA and showed a close association between them (Figure S9). Moreover, GD2 and ASCT2 were also closely associated in NCI‐N417 and ACC‐LC‐171 cells (Figure S10). These data clearly showed that ASCT2 was colocalized with GD2 in GEM/rafts in GD2+ SK‐LC‐17 transfectants, and suggested that ASCT2 was also closely associated with GD2 in NCI‐N417 and ACC‐LC‐171 cells.
3.4. Malignant phenotypes were suppressed by ASCT2 inhibitor GPNA
ASC amino acid transporter 2 is a major glutamine transporter, and promotes malignant phenotypes in several cancer cells.8, 9, 10, 11, 12 Therefore, we examined the level of glutamine uptake in SK‐LC‐17 transfectants. First, to measure the initial velocity of glutamine uptake in SK‐LC‐17 transfectants, we examined the time course of glutamine uptake in D‐13. We found that glutamine uptake into D‐8 occurred in a linear mode for the first 1 minute (Figure S11). Next, we compared glutamine uptake among SK‐LC‐17 transfectants for the first 1 minute. Glutamine uptake was significantly different between GD2+ SK‐LC‐17 transfectants and GD2− SK‐LC‐17 transfectants within initial linear phase, which suggested that initial velocities of glutamine uptake of GD2+ SK‐LC‐17 transfectants were higher than those of GD2− SK‐LC‐17 transfectants (Figure 4A). Next, we examined roles of glutamine in the malignant phenotypes by using MTT assay to analyze cell proliferation. We found that cell proliferation was significantly increased in GD2+ SK‐LC‐17 transfectants in the presence of glutamine (Figure 4B). Cell proliferation was not detected without glutamine (data not shown).
Figure 4.
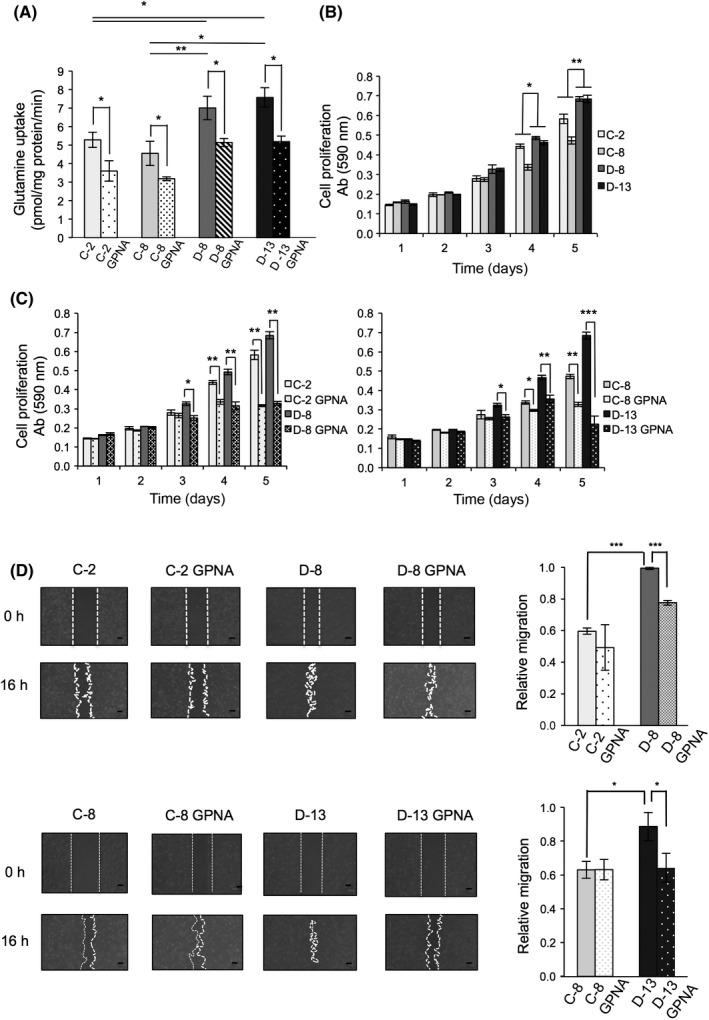
Malignant phenotypes were suppressed by ASC amino acid transporter 2 inhibitor L‐γ‐glutamyl‐p‐nitroanilide (GPNA). A, Glutamine uptake in SK‐LC‐17 transfectants treated with 1 mmol/L GPNA was measured using [3H]‐glutamine. Cells (2.0 × 10⁵) were treated with RPMI‐1640 supplemented with 1 nmol/L [3H]‐glutamine. After 1 min, the cells were washed with ice‐cold PBS three times and were lysed. Radioactivity was counted by a liquid scintillation counter. B, Cell proliferation was measured by MTT assay. Cells (2.0 × 10³) were plated in 96‐well plates and incubated for 1‐5 days in RPMI‐1640 (containing no glutamine) supplemented with 10% dialyzed FCS and glutamine (5 mmol/L). Cell growth rate was analyzed by using MTT reagent. Absorbance (590 nm) was determined and plotted in graphs. *P < .05; **P < .01. C, Cell proliferation of SK‐LC‐17 transfectants treated with GPNA was measured by MTT assay. Cells (2.0 × 10³) were plated in 96‐well plates and incubated for 1‐5 days in RPMI‐1640 supplemented with 10% dialyzed FCS and GPNA (0 mmol/L or 1 mmol/L). *P < .05; **P < .01; ***P < .001. D, Cell migration of SK‐LC‐17 transfectants treated with GPNA was measured by wound healing assay. SK‐LC‐17 transfectants (2.0 × 10⁶) were scratched and washed twice. After 16 h, migration rates (migration area at 16‐0 h) were calculated. Scale bar = 100 μm. *P < .05; **P < .01; ***P < .001
To examine the function of ASCT2, we used GPNA, which specifically inhibits glutamine uptake by ASCT2.11, 13 Glutamine uptake was significantly decreased in SK‐LC‐17 transfectants by GPNA (Figure 4A). To clarify whether glutamine uptake was really regulated by ASCT2 in SK‐LC‐17 transfectants, we examined glutamine uptake in SK‐LC‐17 transfectants treated with anti‐ASCT2 siRNAs. We prepared three kinds of anti‐ASCT2 siRNAs (#1, #2, and #3) and tested knockdown efficiency of ASCT2 in SK‐KC‐l7 transfectants. Transfection of anti‐ASCT2 siRNA #3 suppressed ASCT2 expression with high efficiency (Figure S12A). After knockdown with anti‐ASCT2 siRNA #3, glutamine uptake into SK‐LC‐17 transfectants was significantly reduced (Figure S12B,C). In GPNA‐treated cells, cell proliferation was significantly decreased (Figure 4C). In particular, GD2+ SK‐LC‐17 transfectants were more affected by GPNA and cell proliferation was more suppressed (Figure 4C), because glutamine uptake through ASCT2 is more enhanced in GD2+ SK‐LC‐17 transfectants due to increased expression levels of ASCT2 in GEM/rafts (Figures 4A, S2). Furthermore, cell migration was significantly suppressed in GD2+ SK‐LC‐17 transfectants by GPNA (Figure 4D). These results indicate that GD2 enhances the function of ASCT2, and eventually the malignant properties of SK‐LC‐17 cells. These effects were brought about based on the co‐operation in GEM/rafts. However, the precise mechanisms by which GD2 enhances the function of ASCT2 remain to be investigated.
3.5. Mammalian target of rapamycin complex 1 signaling axis attenuated by reduction of glutamine uptake
Glutamine is a key amino acid to activate the mTORC1 signaling axis.16, 17 Therefore, we examined phosphorylation levels of downstream factors of mTORC1, such as p70 S6K1 and S6. SK‐LC‐17 transfectants were treated with GPNA to inhibit glutamine uptake by ASCT2. Consequently, p70 S6K1 and S6 were dephosphorylated in a time‐dependent manner in SK‐LC‐17 transfectants (Figure 5). Interestingly, p70 S6K1 and S6 of GD2+ SK‐LC‐17 transfectants were dephosphorylated faster than those in GD2− SK‐LC‐17 transfectants. Hence, glutamine uptake through ASCT2 is more required in GD2+ SK‐LC‐17 cells for activation of the mTORC1 signaling axis.
Figure 5.
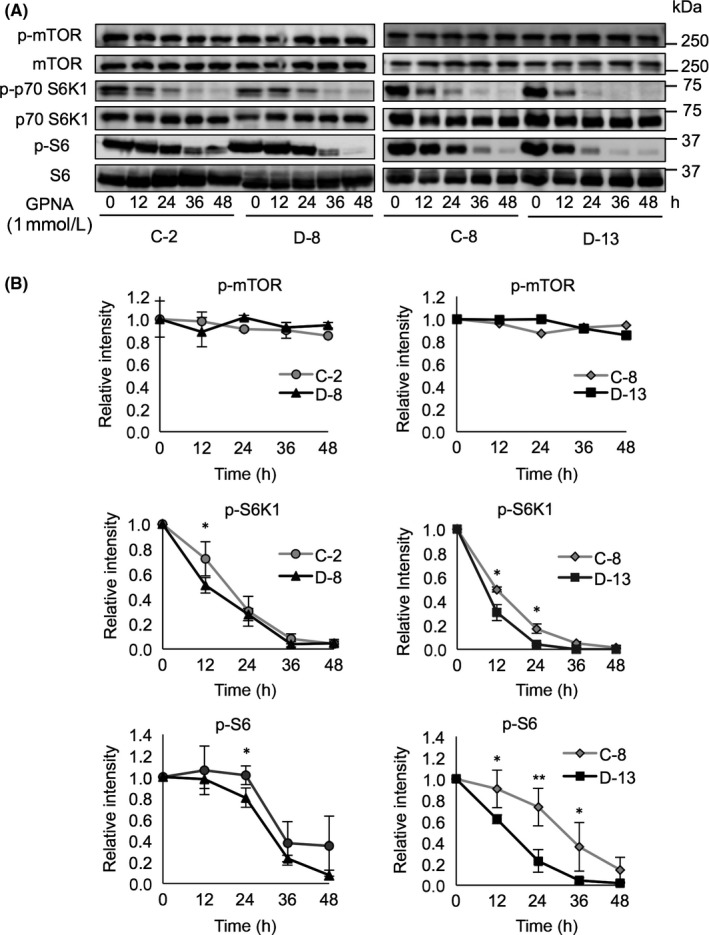
Mammalian target of rapamycin complex 1 (mTORC1) signaling axis attenuated by reduction of glutamine uptake. A, Phosphorylation levels of mTOR, S6K1, and S6 were analyzed by Western blotting. SK‐LC‐17 transfectants (8 × 10⁵) were incubated for 0, 12, 24, 36, and 48 h in RPMI‐1640 containing 1 mmol/L L‐γ‐glutamyl‐p‐nitroanilide (GPNA). B, Intensity of bands of phosphorylated mTOR, S6K1, and S6 was scanned; data are presented in graphs after correction with those of total mTOR, S6K1, and S6, respectively
These results suggested that glutamine uptake through ASCT2 leads to the activation of the mTORC1 signaling axis that is involved, at least partly, in the enhancement of cell proliferation and migration in GD2+ SK‐LC‐17 cells.
4. DISCUSSION
In order to develop novel treatments for cancer, it is essential to identify tumor‐specific molecules. Ganglioside GD2 is specifically expressed in SCLC cells, but hardly expressed in NSCLC cells or normal tissues.3 Previous studies reported that GD2 promoted malignant phenotypes, such as cell proliferation and invasion, and anti‐GD2 mAb induced apoptosis in SCLC cells.3, 4 However, it was not well known how GD2 works in SCLC cells. We addressed this issue focusing on SCLC in this study. Recently, it has been reported that the EMARS method is a novel way to identify molecules interacting with gangliosides.21, 22 For example, PDGFRα was identified as a GD3‐associating protein in glioma cells using the EMARS method.19 Moreover, neogenine, a membrane protein that promotes the development of the nervous system, was identified as a GD3‐associating molecule in melanoma cells. Neogenin enhanced malignant phenotypes in melanoma cells through its intracellular domain as a transcription factor.20 In this study, we undertook EMARS and MS to clarify how GD2 works and what kind of molecules GD2 works with in SCLC cells.
This study provided evidence for the first time that ganglioside interacts with an amino acid transporter. Results of EMARS‐MS suggested that several molecules were associated with GD2 on the cell surface. Among the candidate molecules, ASCT2 was specifically expressed in GEM/rafts of GD2+ SK‐LC‐17 transfectants (Figure 2A). Therefore, we identified ASCT2 as a representative molecule associating with GD2. Several transcription factors, such as activating transcription factor 4, N‐myc, and E2F3, promoted glutamine metabolism through ASCT2 in several tumors,12, 28, 29 and N‐myc and E2F3 were highly expressed in SCLC cells.30, 31 However, in this study, the total expression level of ASCT2 was not considerably different among SK‐LC‐17 transfectants (Figure 2B). Hence, GD2 did not seem to affect ASCT2 expression in SK‐LC‐17 cells. ASC amino acid transporter 2 contains two putative N‐linked glycosylation sites (N163 and N212), and ASCT2 is transported to the plasma membrane depending on N‐linked glycosylation.32 However, the expression levels of ASCT2 on the plasma membrane is the same among SK‐LC‐17 transfectants (Figure S3). Taking membrane trafficking of ASCT2 and our results together, it might be true that GD2 does not recruit mature ASCT2 to the plasma membrane but to GEM/rafts. However, the trafficking mechanism of ASCT2 remains to be elucidated in detail. We found that GD2 bound with ASCT2 in GD2+ SK‐LC‐17 transfectants (Figures 2C,D, S9), and GD2 was also closely associated with ASCT2 in NCI‐N417 and ACC‐LC‐171 cells (Figures S8, S10). Previously, it was reported that sialic acid‐containing GM3 bound with insulin receptor through lysine residue on the plasma membrane,33 indicating that a sialic acid of ganglioside binds with basic amino acids of membrane proteins. Interestingly, we found that three basic amino acids of ASCT2 located at the neighboring region of the plasma membrane, suggesting that GD2 might bind with ASCT2 through these three residues.
ASC amino acid transporter 2 is coexpressed with LAT1 (SLC7A5) in several tumors such as lung adenocarcinomas, leukemia, and tongue cancer, and the expression of both ASCT2 and LAT1 enhances malignant phenotypes of cancers in vitro and in vivo.34, 35, 36 The mechanism by which the combination of ASCT2 and LAT1 increases malignant phenotypes in cancer cells is considered to be due to activation of the mTORC1 signaling pathway. ASC amino acid transporter 2 and LAT1 are a major glutamine transporter and a major leucine transporter, respectively, and both of these amino acids activate the mTORC1 signaling pathway in an independent manner.16 Although the interaction between ASCT2 and LAT1 is poorly understood in SCLC cells, both transporters might co‐operate and activate the mTORC1 signaling axis. Our data and previous studies showed that glutamine uptake by ASCT2 activated the mTORC1 signaling axis, such as p70 S6K1 and S6.37 Recent studies elucidated that p70 S6K1 regulates cell migration and invasion in cancer cells.38, 39, 40 Moreover, p70 S6K1‐mediated phosphorylation controls phosphatidylinositol 4‐phosphate 5‐kinase type I degradation to regulate development of focal adhesions and invadopodia, and consequently, cell migration and invasion.41 In this study, GPNA decreased glutamine uptake by ASCT2 in SK‐LC‐17 transfectants, leading to inactivated signaling of p70 S6K1, and consequently to reduced cell migration (Figures 4D, 5A,B). These results suggest that glutamine regulates cell migration based on p70 S6K1– phosphatidylinositol 4‐phosphate 5‐kinase type I in SK‐LC‐17 transfectants.
ASC amino acid transporter 2 is considered to be a novel target for treatment in several tumors,8, 9, 10, 11, 12 and several ASCT2 inhibitors have been developed. To examine whether anti‐GD2 mAb enhances the effect of ASCT2 inhibitors, such as GPNA and BenSer,42 in SCLC cells, we will perform dual administration of anti‐GD2 mAb and GPNA in vitro and in vivo, in SCLC cells and a xenograft model, respectively. GD2 is also a promising target for treatment of neuroblastoma, and anti‐GD2 mAb has been developed for therapy trials.5, 43, 44 However, little is known about how GD2 promotes malignant phenotypes in neuroblastoma cells. It has been reported that ASCT2 is also expressed in neuroblastoma cells, and promotes malignant phenotypes by glutamine uptake.12 GD2 might also interact with ASCT2 on the plasma membrane of neuroblastoma cells, leading to enhancement of malignant phenotypes. Recently, ADCs have been vigorously developed for oncology therapeutics.45 Gangliosides including GD2 are adequate antigen targets for ADCs, because several gangliosides are specifically expressed in tumor cells. Therefore, ADCs targeting gangliosides are thought to be effective therapeutics for tumors. The results of this study suggest that anti‐GD2 mAb conjugated with an ASCT2 inhibitor is an effective strategy for novel therapy towards SCLC cells and neuroblastoma cells.
In conclusion, we uncovered the roles of GD2 in SCLC cells in this study. GD2 recruits ASCT2 to GEM/rafts and enhances glutamine uptake through ASCT2 in SCLC cells. As a result, malignant phenotypes, such as cell proliferation and migration, were increased through activation of the mTORC1 signaling axis.
DISCLOSURE STATEMENT
The authors have no conflict of interest.
Supporting information
ACKNOWLEDGMENTS
We thank T. Mizuno, Y. Nakayasu, and S. Yamamoto for technical support. This work was supported by Grants‐in‐aid for Scientific Research (21390076, 22117511, 2590371, and 24390078) from the Ministry of Education, Culture, Sports, Science and Technology of Japan.
Esaki N, Ohkawa Y, Hashimoto N, et al. ASC amino acid transporter 2, defined by enzyme‐mediated activation of radical sources, enhances malignancy of GD2‐positive small–cell lung cancer. Cancer Sci. 2018;109:141–153. https://doi.org/10.1111/cas.13448
Funding information
Ministry of Education, Culture, Sports, Science and Technology of Japan.
REFERENCES
- 1. Daniotti JL, Vilcaes AA, Torres DV, Ruggiero FM, Rodriguez‐Walker M. Glycosylation of glycolipids in cancer; basis for development of novel therapeutic approaches. Front Oncol. 2013;3:306. [DOI] [PMC free article] [PubMed] [Google Scholar]
- 2. Hakomori S. Glycosynapses: microdomains controlling carbohydrate‐dependent cell adhesion and signaling. An Acad Bras Cienc. 2004;76:553‐572. [DOI] [PubMed] [Google Scholar]
- 3. Yoshida S, Fukumoto S, Kawaguchi H, Sato S, Ueda R, Furukawa K. Ganglioside G(D2) in small cell lung cancer cell lines: enhancement of cell proliferation and mediation of apoptosis. Cancer Res. 2001;61:4244‐4252. [PubMed] [Google Scholar]
- 4. Aixinjueluo W, Furukawa K, Zhang Q, et al. Mechanisms for the apoptosis of small cell lung cancer cells induced by anti‐GD2 monoclonal antibodies: roles of anoikis. J Biol Chem. 2005;280:29828‐29836. [DOI] [PubMed] [Google Scholar]
- 5. Kushner BH, Kramer K, Gheung NK. PhaseII trail of the anti‐G(D2) monoclonal antibody 3F8 and granulocyte‐macrophage colony‐stimulating factor for neuroblastoma. J Clin Oncol. 2001;19:4189‐4194. [DOI] [PubMed] [Google Scholar]
- 6. Utsunomiya‐Tate N, Endou H, Kanai Y. Cloning and functional characterization of a system ASC‐like Na+‐ dependent neutral amino acid transporter. J Biol Chem. 1996;271:14883‐14890. [DOI] [PubMed] [Google Scholar]
- 7. Kanai Y, Hediger MA. The glutamate and neutral amino acid transporter family: physiological and pharmacological implications. Eur J Pharmacol. 2003;479:237‐247. [DOI] [PubMed] [Google Scholar]
- 8. Shimizu K, Kaira K, Tomizawa Y, et al. ASC amino‐acid transporter 2 (ASCT2) as a novel prognostic marker in non‐small cell lung cancer. Br J Cancer. 2014;110:2030‐2039. [DOI] [PMC free article] [PubMed] [Google Scholar]
- 9. Hassanein M, Hoeksema MD, Shiota M, et al. SLC1A5 mediates glutamine transport required for lung cancer cell growth and survival. Clin Cancer Res. 2013;19:560‐570. [DOI] [PMC free article] [PubMed] [Google Scholar]
- 10. Liu Y, Yang L, An H, et al. High expression of solute carrier family 1, member 5 (SLC1A5) is associated with poor prognosis in clear‐cell renal cell carcinoma. Sci Rep. 2015;5:16954. [DOI] [PMC free article] [PubMed] [Google Scholar]
- 11. van Geldermalsen M, Wang Q, Nagarajah R, et al. ASCT2/SLC1A5 controls glutamine uptake and tumor growth in triple‐negative basal‐like breast cancer. Oncogene. 2016;35:3201‐3208. [DOI] [PMC free article] [PubMed] [Google Scholar]
- 12. Ren P, Yue M, Xiao D, et al. ATF4 and N‐Myc coordinate glutamine metabolism in MYCN‐amplified neuroblastoma cells through ASCT2 activation. J Pathol. 2015;235:90‐100. [DOI] [PubMed] [Google Scholar]
- 13. Hassanein M, Qian J, Hoeksema MD, et al. Targeting SLC1A5‐mediated glutamine dependence in non‐small cell lung cancer. Int J Cancer. 2015;137:1587‐1597. [DOI] [PMC free article] [PubMed] [Google Scholar]
- 14. Laplante M, Sabatini DM. mTOR signaling in growth control and disease. Cell. 2012;149:274‐293. [DOI] [PMC free article] [PubMed] [Google Scholar]
- 15. Feng Z, Zhang H, Levine AJ, Jin S. The coordinate regulation of the p53 and mTOR pathways in cells. Proc Natl Acad Sci U S A. 2005;102:8204‐8209. [DOI] [PMC free article] [PubMed] [Google Scholar]
- 16. Jewell JL, Kim YC, Russell RC, et al. Differential regulation of mTORC1 by leucine and glutamine. Science. 2015;347:194‐198. [DOI] [PMC free article] [PubMed] [Google Scholar]
- 17. Abraham RT. Making sense of amino acid sensing. Science. 2015;347:128‐129. [DOI] [PubMed] [Google Scholar]
- 18. Nakaya M, Xiao Y, Zhou X, et al. Inflammatory T cell responses rely on amino acid transporter ASCT2 facilitation of glutamine uptake and mTORC1 kinase activation. Immunity. 2014;40:692‐705. [DOI] [PMC free article] [PubMed] [Google Scholar]
- 19. Ohkawa Y, Momota H, Kato A, et al. Ganglioside GD3 enhances invasiveness of gliomas by forming a complex with platelet‐derived growth factor receptor α and Yes kinase. J Biol Chem. 2015;290:16043‐16058. [DOI] [PMC free article] [PubMed] [Google Scholar]
- 20. Kaneko K, Ohkawa Y, Hashimoto N, et al. Neogenin, defined as a GD3‐associated molecule by enzyme‐mediated activation of radical sources, confers malignant properties via intracytoplasmic domain in melanoma cells. J Biol Chem. 2016;291:16630‐16643. [DOI] [PMC free article] [PubMed] [Google Scholar]
- 21. Kotani N, Gu J, Isaji T, Udaka K, Taniguchi N, Honke K. Biochemical visualization of cell surface molecular clustering in living cells. Proc Natl Acad Sci U S A. 2008;105:7405‐7409. [DOI] [PMC free article] [PubMed] [Google Scholar]
- 22. Hashimoto N, Hamamura K, Kotani N, et al. Proteomic analysis of ganglioside‐associated membrane molecules: substantial basis for molecular clustering. Proteomics. 2012;12:3154‐3163. [DOI] [PubMed] [Google Scholar]
- 23. Haraguchi M, Yamashiro S, Yamamoto A, et al. Isolation of GD3 synthase gene by expression cloning of GM3 α‐2,8‐sialyltransferase cDNA suing anti‐GD2 monoclonal antibody. Proc Natl Acad Sci U S A. 1994;91:10455‐10459. [DOI] [PMC free article] [PubMed] [Google Scholar]
- 24. Iwabuchi K, Yamamura S, Prinetti A, Handa K, Hakomori S. GM3‐enriched microdomain involved in cell adhesion and signal transduction through carbohydrate‐carbohydrate interaction in mouse melanoma B16 cells. J Biol Chem. 1998;273:9130‐9138. [DOI] [PubMed] [Google Scholar]
- 25. Tomi M, Mori M, Tachikawa M, Katayama K, Terasaki T, Hosoya K. L‐type amino acid transporter 1‐mediated L‐leucine transporter at the inner blood‐retinal barrier. Invest Ophthalmol Vis Sci. 2005;46:2522‐2530. [DOI] [PubMed] [Google Scholar]
- 26. Miao H, Gale NW, Guo H, et al. EphA2 promotes infiltrative invasion of glioma stem cells in vivo through cross‐talk with Akt and regulates stem cell properties. Oncogene. 2015;34:558‐567. [DOI] [PMC free article] [PubMed] [Google Scholar]
- 27. Amato KR, Wang S, Tan L, et al. EPHA2 blockade overcomes acquired resistance to EGFR kinase inhibitors in lung cancer. Cancer Res. 2016;76:305‐318. [DOI] [PMC free article] [PubMed] [Google Scholar]
- 28. Wise DR, DeBerardinis RJ, Mancuso A, et al. Myc regulates a transcriptional program that stimulates mitochondrial glutaminolysis and leads to glutamine addiction. Proc Natl Acad Sci U S A. 2008;105:18782‐18787. [DOI] [PMC free article] [PubMed] [Google Scholar]
- 29. Reynolds MR, Lane AN, Robertson B, et al. Control of glutamine metabolism by the tumor suppressor Rb. Oncogene. 2014;33:556‐566. [DOI] [PMC free article] [PubMed] [Google Scholar]
- 30. Nau MM, Brooks BJ Jr, Carney DN, et al. Human small‐cell lung cancers show amplification and expression of N‐myc gene. Proc Natl Acad Sci U S A. 1986;83:1092‐1096. [DOI] [PMC free article] [PubMed] [Google Scholar]
- 31. Cooper CS, Nicholson AG, Foster C, et al. Nuclear overexpression of the E2F3 transcription factor in human lung cancer. Lung Cancer. 2006;54:155‐162. [DOI] [PubMed] [Google Scholar]
- 32. Console L, Scalise M, Tarmakova Z, Coe IR, Indiveri C. N‐linked glycolsyaltion of human SLC1A5 (ASCT2) transporter is critical for trafficking to membrane. Biochim Biophys Acta. 2015;1853:1636‐1645. [DOI] [PubMed] [Google Scholar]
- 33. Kabayama K, Sato T, Saito K, et al. Dissociation of the insulin receptor and caveolin‐1 complex by ganglioside GM3 in the state of insulin resistance. Proc Natl Acad Sci U S A. 2007;104:13678‐13683. [DOI] [PMC free article] [PubMed] [Google Scholar]
- 34. Yazawa T, Shimizu K, Kaira K, et al. Clinical significance of coexpression of L‐type amino acid transporter 1 (LAT1) and ASC amino acid transporter 2 (ASCT2) in lung adenocarcinoma. Am J Transl Res. 2015;7:1126‐1139. [PMC free article] [PubMed] [Google Scholar]
- 35. Polet F, Martherus R, Corbet C, Pinto A, Feron O. Inhibition of glucose metabolism prevents glycosylation of the glutamine transporter ASCT2 and promotes compensatory LAT1 upregulation in leukemia cells. Oncotarget. 2016;7:46371‐46383. [DOI] [PMC free article] [PubMed] [Google Scholar]
- 36. Toyoda M, Kaira K, Ohshima Y, et al. Prognostic significance of amino‐acid transporter expression (LAT1, ASCT2 and xCT) in surgically resected tongue cancer. Br J Cancer. 2014;110:2506‐2513. [DOI] [PMC free article] [PubMed] [Google Scholar]
- 37. Altman BJ, Stine ZE, Dang CV. From Krebs to clinic: glutamine metabolism to cancer therapy. Nat Rev Cancer. 2016;16:619‐634. [DOI] [PMC free article] [PubMed] [Google Scholar]
- 38. Liu L, Parent CA. TOR kinase complexes and cell migration. J Cell Biol. 2011;194:815‐824. [DOI] [PMC free article] [PubMed] [Google Scholar]
- 39. Hsieh AC, Liu Y, Edlind MP, et al. The translational landscape of mTOR signaling steers cancer initiation and metastasis. Nature. 2012;485:55‐61. [DOI] [PMC free article] [PubMed] [Google Scholar]
- 40. Khotskaya YB, Goverdhan A, Shen J, et al. S6K1 promotes invasiveness of breast cancer cells in a model of metastasis of triple‐negative breast cancer. Am J Transl Res. 2014;6:361‐376. [PMC free article] [PubMed] [Google Scholar]
- 41. Jafari N, Zheng Q, Li L, et al. p70S6K1 (S6K1)‐mediated phosphorylation regulates phosphatidylinositol 4‐phosphate 5‐kinase type Iγ degradation and cell invasion. J Biol Chem. 2016;291:25729‐25741. [DOI] [PMC free article] [PubMed] [Google Scholar]
- 42. Wang Q, Beaumont KA, Otte NJ, et al. Targeting glutamine transport to suppress melanoma cell growth. Int J Cancer. 2014;135:1060‐1071. [DOI] [PubMed] [Google Scholar]
- 43. Kushner BH, Kramer K, Modak S, Cheung NK. Successful multifold does escalation of anti‐GD2 monoclonal antibody 3F8 in patients with neuroblastoma: a phase I study. J Clin Oncol. 2011;29:1168‐1174. [DOI] [PMC free article] [PubMed] [Google Scholar]
- 44. Cheung NK, Cheung IY, Kramer K, et al. Key role for myeloid cells: phase II results of anti‐GD2 antobody 3F8 plus granulocyte‐macrophage colony‐stimulating factor for chemoresistant osteomedullary neuroblastoma. Int J Cancer. 2014;135:2199‐2205. [DOI] [PMC free article] [PubMed] [Google Scholar]
- 45. Beck A, Goetsch L, Dumontet C, Corvaïa N. Strategies and challenges for the next generation of antibody‐drug conjugates. Nat Rev Drug Discov. 2017;16:315‐337. [DOI] [PubMed] [Google Scholar]
Associated Data
This section collects any data citations, data availability statements, or supplementary materials included in this article.
Supplementary Materials