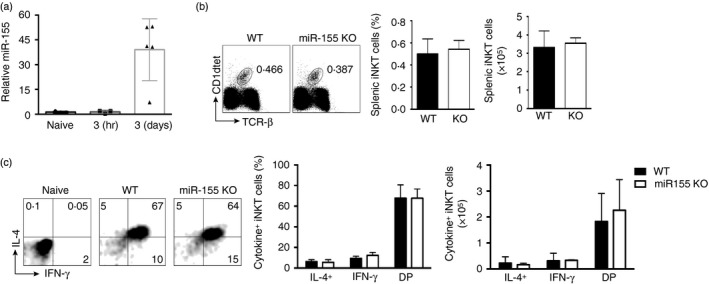
Figure 3.

miR‐155 is up‐regulated in activated invariant natural killer T (iNKT) cells. (a) Quantitative PCR indicating relative expression of miR‐155 by sorted CD1d‐tet+ TCR‐β + iNKT cells from naive mice or mice injected with 2 μg α‐galactosylceramide (α‐GC) for 3 hr or 3 days. (b) Flow cytometric analysis of iNKT cell frequency in the spleen after intraperitoneal injection with 2 μg α‐GC for 3 hr. Graphs indicate the average frequency and absolute number (± SEM) of gated iNKT cells from the indicated genotype. (c) Flow cytometry and bar graphs indicate frequency and cell number of interferon‐γ (IFN‐γ) and interleukin‐4 (IL‐4) expression by gated splenic iNKT lymphocytes from the indicated genotype. DP, double positive for IFN‐γ and IL‐4. Graphs are representative of two experiments with two mice per group.
