Abstract
Control over assembly, orientation, and defect‐free growth of metal‐organic framework (MOF) films is crucial for their future applications. A layer‐by‐layer approach is considered a suitable method to synthesize highly oriented films of numerous MOF topologies, but the initial stages of the film growth remain poorly understood. Here we use a combination of infrared (IR) reflection absorption spectroscopy and atomic force microscopy (AFM)‐IR imaging to investigate the assembly and growth of a surface mounted MOF (SURMOF) film, specifically HKUST‐1. IR spectra of the films were measured with monolayer sensitivity and <10 nm spatial resolution. In contrast to the common knowledge of LbL SURMOF synthesis, we find evidence for the surface‐hindered growth and large presence of copper acetate precursor species in the produced MOF thin‐films. The growth proceeds via a solution‐mediated mechanism where the presence of weakly adsorbed copper acetate species leads to the formation of crystalline agglomerates with a size that largely exceeds theoretical growth limits. We report the spectroscopic characterization of physisorbed copper acetate surface species and find evidence for the large presence of unexchanged and mixed copper‐paddle‐wheels. Based on these insights, we were able to optimize and automatize synthesis methods and produce (100) oriented HKUST‐1 thin‐films with significantly shorter synthesis times, and additionally use copper nitrate as an effective synthesis precursor.
Keywords: atomic force microscopy, epitaxial growth, growth mechanism, infrared absorption spectroscopy, metal-organic framework
Introduction
Over the past two decades, metal‐organic frameworks (MOFs) have gained increasing interest as promising materials for gas separation and storage, sensor applications, and catalysis.1, 2, 3 MOFs are highly porous crystalline materials consisting of inorganic metal nodes coordinated to organic linkers‐ functionalities that enable highly versatile chemical properties. The synthesis of oriented MOF films received significant attention due to their potential use as membranes, sensing and photo‐responsive devices, and (electro)catalysts.4, 5, 6, 7 Surface‐anchored films of metal‐organic frameworks (SURMOFs) can be synthesized in a straightforward manner by using a liquid phase layer‐by‐layer (LbL) synthesis approach.8, 9 The benefits of this method include the growth of highly homogeneous and oriented films at room temperature,8, 10 with diverse topologies,11, 12 enabling at the same time controlled mechanistic studies of MOF assembly13, 14 and guest‐induced framework changes.15, 16, 17
The LbL growth of SURMOFs is typically realized by functionalizing gold substrates with organic self‐assembled monolayers (SAMs). Subsequently, alternately immersing the SAM/Au substrates in separate metal and linker solutions, with solvent washing steps in between, assures controlled growth. Resulting SURMOF orientation is dictated by the terminating groups of the SAMs.14, 18, 19 The most studied example of a SURMOF is [Cu3(btc)2(H2O)n], commonly known as HKUST‐1, which typically includes copper acetate (Cu(CH3COO)2, abbreviated here as CuAc2) and 1,3,5‐benzenetricarboxylate (btc) as precursors.8, 20
Shekhah et al. have suggested that the paddle‐wheel structure of CuAc2 resembles the structure of HKUST‐1 and that this particular precursor facilitates the SURMOF formation.13 Nevertheless, the mechanistic details of the early stages of the [Cu3(btc)2] SURMOF growth are still under debate. Quartz crystal microbalance (QCM) investigations, measuring the mass uptake of individual SURMOF precursor species as a function of time, indicated a non‐stoichiometric increase in the uptake after each deposition step.20 Scanning probe microscopy studies have found that [Cu3(btc)2] SURMOF films can grow significantly faster than expected from the LbL model,21, 22 whereas the orientation of the obtained films was not always as expected from the termination of SAMs.20, 21, 22 Importantly, the LbL SURMOF synthesis is (relatively) time consuming. In contrast, both QCM and surface plasmon resonance (SPR) studies have shown precursor uptake periods of times shorter than typically used reaction times for LbL SURMOF synthesis.8, 13, 20 An approach combining shorter reaction times with LbL growth, liquid phase epitaxy (LPE) spray synthesis, has been developed by Arslan et al. for the fast synthesis of highly oriented films.23 Films grown in this way, however, show growth rates far exceeding LbL limits indicating the presence of an additional growth mechanism. Attempts to unravel LbL growth mechanisms in the initial stages by using spectroscopic tools have been previously performed, for example, by Zhuang et al. for the Cu2(F4bdc)2‐(dabco) SURMOF (dabco=1,4‐diazabicyclo[2.2.2]octane), but so far no conclusive results have been found for HKUST‐1.14 Therefore, fundamental understanding, and as a result further synthetic improvements, are needed in order to justify advantages of the LbL approach over other synthetic strategies.19, 24, 25, 26, 27
Here, as outlined in Figure 1, we report on a systematic study of the [Cu3(btc)2] SURMOF growth mechanism and on improved synthesis procedures to yield preferentially oriented SURMOF films. In order to do so, we have applied two synthetic procedures, namely manual and automated dipping synthesis, for the LbL SURMOF growth of HKUST‐1 (Figure 1 a, b). In a manual synthesis procedure (Figure 1 a), separate washing and drying steps were applied, whereas when using an automated dipping procedure (Figure 1 b), no drying was used. These two synthetic approaches were purposely chosen to improve our understanding of the growth mechanism in the initial growth stages (manual synthesis) and based on this understanding, to improve and automatize the synthesis of SURMOFs (automatic synthesis). Fully controlled LbL synthesis analysis can be achieved only by manually separating each deposition step by removing all weakly adsorbed species with both washing and drying; however, this procedure is time consuming and impractical for the quick film synthesis. On the other hand, automated dip synthesis assured precise reproducibility and a large advantage of using an automated tool for the facile production of thicker films suitable for practical applications and characterization with, for example, XRD analysis. The latter approach to the synthesis is not new, as it has been previously shown by Wöll et al. to produce homogeneous and preferentially oriented SURMOF films.28
Figure 1.
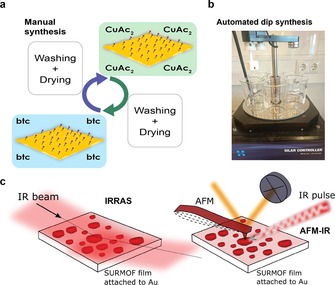
Synthesis and spectroscopic characterization of HKUST‐1 SURMOF films. a,b) Schematic of manual synthesis (a) and a photograph of a setup used for automated dip synthesis (b). A robotic hand is used to immerse substrates into precursor solutions, with two washing steps in between (six solution beakers in total). Both synthesis approaches revolve around layer‐by‐layer (LbL) synthesis on a SAM functionalized Au substrate (shown in (a)), however where manual synthesis (a) applies a drying step, an automated synthesis (b) does not. Automated synthesis is particularly useful for a high‐throughput production of thicker films (>50 synthesis cycles). c) Schematic of working principles of IRRAS and AFM‐IR techniques used in this study.
We further provide for the first time spectroscopic fingerprints and clear evidence for the highly hindered SURMOF growth in the presence of CuAc2 and show that a controlled hetero‐epitaxial growth can be unexpectedly achieved by using copper nitrate as a precursor, contrary to the common knowledge in the field.13, 29 For this purpose, we use a combination of two highly sensitive infrared (IR) spectroscopic approaches, namely infrared reflection absorption spectroscopy (IRRAS) and AFM‐IR microscopy (Figure 1 c). IRRAS is a bulk IR technique that provides averaged information about SURMOF growth with a sub‐monolayer sensitivity. Zhuang et al. have previously shown the potential of IRRAS to disclose initial stages of SURMOF growth at different synthesis temperatures.14 However, IRRAS does not provide microscopic insights into the topology and local nanoscale chemistry of SURMOFs. To circumvent this limitation, we have complemented IRRAS results with tip‐sensed AFM‐IR microscopy approaches.30, 31a,31b Apart from providing topological information of AFM as a powerful method to study mechanisms of crystal growth,32, 33 AFM‐IR can further provide local spectroscopic information with spatial resolution around 10 nm. Various versions of AFM‐based IR microscopy have been recently employed, including synchrotron‐based IR mapping of metal nanoparticle catalysis,34 structural analysis of μm‐sized MOF crystals35 and zeolite thin film investigations,31b but its application to study the initial stages of the SURMOF growth process with a monolayer chemical sensitivity has, to the best of our knowledge, never been demonstrated. In this paper, two emerging tip‐sensed AFM‐IR technologies have been used, namely, photothermal AFM‐nano‐IR and photo‐induced force microscopy (PiFM), which complement each other in their technical abilities. Both AFM‐IR spectroscopy methods can determine the film topology in an AFM fashion and record local IR spectra from <5 nm thin‐films with <10 nm spatial resolution. AFM‐nano‐IR senses the photothermally‐induced expansion of a SURMOF film due to the IR light absorption from a pulsed laser source.30 Instead in PiFM‐IR, a similar pulsed laser source induces a dipole in the SURMOF and consequently a mirror dipole in the AFM tip which is translated into IR spectral data.31a,31b The AFM‐nano‐IR method proved more suitable for taking full range (1300–1800 cm−1) point spectra, whereas the PiFM‐IR was particularly useful for recording IR maps at set wavelengths. Details on the experimental approach taken in this research can be found in the Experimental Section.
Results and Discussion
In a first set of experiments, Au substrates (Au/Si) were functionalized with 16‐mercaptohexadecanoic acid (MHDA) prior to synthesis—a SAM commonly used to grow (100) oriented [Cu3(btc)2] SURMOF.8 HKUST‐1 thin films were manually deposited by alternatingly immersing the substrates in CuAc2 and btc solutions with intermittent rinsing and drying (Figure 1 a). A consecutive immersion in both CuAc2 and btc signifies a full deposition cycle and a half cycle consists of a single immersion in either CuAc2 or btc. The immersion times in ethanolic solutions of CuAc2 and btc were 10 and 20 min, respectively. IRRAS spectra revealed very interesting details of the initial stages of HKUST‐1 growth. If the substrates were subjected to 5 min washing steps in flowing ethanol and subsequent drying each half cycle, a very slow growth of the film was observed (Figure 2 a). IRRAS spectra of such thin‐films showed very broad bands that are not alike an IR spectrum of [Cu3(btc)2]. Instead, broad bands at 1620 cm−1 and 1570 cm−1 were present (Figure 2 a). Remarkably, if the washing steps consisted of 10 s rinsing in ethanol with drying only after full cycles, the COO− vibrational modes of [Cu3(btc)2] at 1650 cm−1 and 1380 cm−1 appeared much stronger in intensity, indicating significantly faster growth (Figure 2 a).
Figure 2.
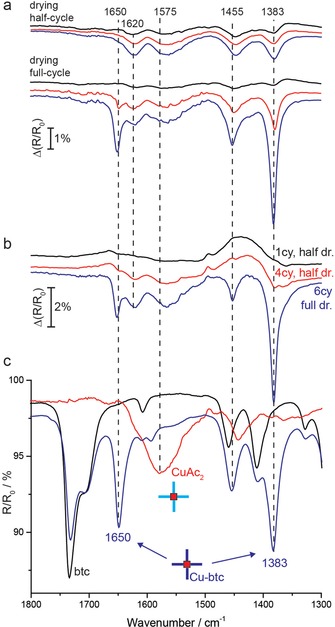
a) IRRAS spectra of the first three cycles of the LbL synthesis for manual growth with half‐cycle (top) and whole cycle (bottom) drying. b) Influence of drying steps on [Cu3(btc)2] growth. During the first 4 cycles the SURMOF was dried in N2 flow each half‐cycle and hindered growth was observed. The fast growth resumed only after full‐cycle drying steps (5th and 6th cycle). c) IRRAS spectra of copper acetate (red), btc (black), and btc upon addition of copper acetate (blue).
Additional control experiments have shown that the growth rates critically depend on the drying and washing steps (Figure S1). The drying step has shown as the most crucial. If substrates were dried after each half‐cycle in N2 flow, almost no SURMOF formation could be consistently observed (Figure 2 a and Supporting Information Figure S1). However, fast growth could again be established on SURMOFs grown in the hindered regime if the drying steps were applied after full deposition cycles (Figure 2 b). We concluded from here that the SURMOF chemistry does not proceed in an ideal and well‐controlled LbL fashion and that the actual growth rates can be strongly altered by the synthesis conditions. We suspect that a half‐cycle drying step additionally removes loosely attached CuAc2 species that cannot be completely removed by washing step with ethanol. Importantly, if a large fraction of the weakly adsorbed CuAc2 precursors is removed by rinsing and drying steps, the formation of [Cu3(btc)2] SURMOF occurs through surprisingly hindered, defect‐rich growth.
Based on the initial experiments, we hypothesized that the growth proceeds if CuAc2 and btc species are allowed to form secondary building units (SBUs) in the solution. In order to understand the actual SURMOF growth mechanism, we have further substantiated the chemistry of the formed surface structures. Apart from the characteristic asymmetric and symmetric stretching modes of [Cu3(btc)2] at 1650 and 1380 cm−1,36, 37 respectively, the presence of the broad band centered around 1570 cm−1 could not be matched with the IR spectrum of the HKUST‐1 framework. This band remained present at the surface disregarding the synthesis procedure (drying half/whole cycle, Figure 2 a, b). To unambiguously prove the origin of the IR absorption bands of the films, we have recorded separate IRRAS spectra of CuAc2, btc, and their mixtures of different stoichiometric ratios (Figure 2 c, see also Figure S2 and other Supporting Information for experimental details). Based on this, the broad band at 1575 cm−1 could be assigned to the COO− asymmetric stretching vibration originating from [Cu2Ac4] paddle‐wheels (Figure 2 c). Thus, a significant presence of un‐exchanged [Cu2Ac4] species in the [Cu3(btc)2] films was unexpectedly observed for both samples dried at half‐ as well as at whole cycles. To the best of our knowledge, this is the first report that spectroscopically detected the presence of precursor CuAc2 species in the formed SURMOF. The band at 1620 cm−1, which is dominating the IRRAS spectra during the hindered growth, is a signature of mixed [Cu2(btc)2Ac2] building units (vide infra) and further supports our observation of the irregularly grown SURMOF film.
Although the stoichiometric substitution of [Cu2Ac4] paddle‐wheels with btc linker is critical for regular film growth, no previous studies have reported the IR signature of excess precursor species present in the film.8, 20 These species are partially exchanged or un‐exchanged [Cu2Ac4] paddle‐wheels that remain loosely attached (most likely physisorbed) at the surface of the irregular SURMOF film. Probably, the demanding surface‐mediated substitution of acetate [Cu2Ac4] and btc linkers required for the true LbL growth is the reason for irregular and defect‐rich growth. We exclude the effect of the Au substrate and self‐assembly of MHDA as our experiments were performed following reported procedures and across the range of differently prepared substrates. The explanation of the growth mechanism can be found in the solution‐mediated chemistry of copper acetate and btc. This mechanism is supported by the fact that CuAc2 and btc react quickly in the solution when their direct reaction mixtures were inspected by IRRAS (Figure 2 c). From this we concluded that [Cu2(btc)4] precursor SBUs form easily at the solid–liquid interface of a SURMOF where both reactants are present.
To generalize our findings, we have further used two Au–COOH‐terminated substrates, namely Au/Si (surface roughness of 2 nm, same type of substrates used for above described experiments) and Au/mica (with atomically flat Au (111) terraces). Both substrates were initially used to synthesize HKUST‐1 films in the fast growth regime (manual synthesis, full cycle drying, Figure 3 a, b). For [Cu3(btc)2] films prepared on Au/Si, the crystal grains reached 75 nm in height after only five deposition steps (Figure 3 a). This growth rate largely exceeds the growth rates predicted from the epitaxial‐like LbL synthesis (ca. 1.3 nm per cycle) and agrees well with previous AFM studies.21, 22 Based on the AFM profile in Figure 3 a, we estimate 2.5 times larger amount of material (see Experimental Details) after five cycles than expected from the LbL stoichiometry. By using the AFM‐nanosingle‐IR technique, it was possible to record point spectra at desired locations on the SURMOF film. IR single‐point spectra recorded at one of the large crystals show the expected spectra of SURMOF previously observed with IRRAS, including a significant presence of CuAc2 (Figure 3 c, spectrum (a)). Similar inspection of a film grown after two deposition cycles on Au/mica substrates has revealed 10 nm features in height (Figure 3 b). Due to the beam interference from the Au/mica substrates, we have been unable to record IRRAS spectra of thin films deposited on Au/mica. However, single‐point spectra could be recorded with AFM‐nano‐IR, regardless of the type of substrate used. Two spectra taken at two different locations on this SURMOF are given in Figure 3 c (spectra #2 and #3)).
Figure 3.
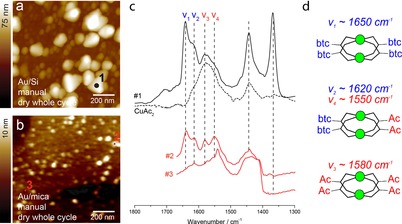
AFM images and AFM‐nano‐IR spectra recorded on Au/Si and Au/mica HKUST‐1 SURMOF thin films. a) AFM image of a thin film on Au/Si measured after 5 deposition cycles using manual synthesis with drying each whole cycle. b) AFM image of a thin film on Au/mica measured after 2 deposition cycles grown in the same way as (a). c) Representative nano‐IR spectra recorded at different positions for the substrates presented in (a,b). Spectrum (#1) is taken on top of a large SURMOF grain (1 black), spectra #2 and #3 are taken at two different positions. An IRRAS spectrum of CuAc2 (dotted line) is added for comparison. d) Vibrational modes assigned to COO− originating from the different Cu‐paddle‐wheel substitutions. Note that models are simplified for clarity by omitting C and O atoms coordinated to copper; copper atoms are depicted in green.
The spectroscopic potential of AFM‐nano‐IR is highlighted through a clear difference between the two spectra, which indicate different chemical environments at the surface of the film, consisting of varying substitution ratios in [Cu2Acx(btc)y]. As IRRAS analysis provides SURMOF averaged information, these location‐dependent ratios could not have been detected without AFM‐IR. AFM‐nano‐IR further confirms that apart from the defect‐rich SURMOF grains, an amorphous layer of CuAc2 species is attached to the Au‐COOH surface (Figure 3 c, spectrum (b, #2)). Very strong hindrance in the growth of [Cu3(btc)2] is noted on Au/mica substrates, as predominantly CuAc2 species were detected at the surface (Figure S3). These results are in line with a previous AFM study that reported both crystalline and amorphous HKUST‐1 structures grown on Au‐mica.22 We further confirmed that different growth rates can result from the sequence of drying steps. AFM topology maps of the samples with the hindered growth prepared with five deposition cycles on Au/Si and Au/mica show MOF grains below 5 nm in height (Figure S4). AFM‐nano‐IR spectra in Figure S4 (spectra (a) and (b)) indicate the formation of the acetate‐ related paddle‐wheel structures. Examples of AFM‐nano‐IR spectra recorded at different locations an various substrates are shown in Figures S3 and S5.
The comparison of IR spectra in Figure 3 c points toward at least four different Cu−COO− asymmetric modes that describe varying degrees of substitution of the corresponding copper paddle‐wheels. From the positions and intensities of the IR bands for different growth regimes, we infer the following assignments: the band at around 1650 cm−1 (mode v1, Figure 3 c) is a signature of COO− asymmetric vibration in the fully coordinated [Cu2(btc)4]. This band is present in fully reacted mixtures of Cu−btc (Figure 2 c), and also for the films grown with drying each whole cycle (Figure 2 a); the vibration at 1620 cm−1 (mode v2) is prominent for the hindered‐grown films (Figure 3 c) and belongs to COO− (from Cu−btc) in the partially exchanged [Cu2Ac2(btc)2]; similarly, the band at 1550 cm−1 (mode v4) likely belongs to the COO− (from Cu−Ac) vibrations in the partially exchanged [Cu2(btc)2Ac2], whereas the band at around 1580 cm−1 (mode v3) is attributed to an asymmetric COO− mode of [Cu2Ac4], based on the IRRAS spectra of copper acetate (Figure 2 c). The arrangement and chemistry of these species could be responsible for the previously observed surface diffusion barriers and defects in [Cu3(btc)2] films with unclear chemical origin.4, 33
Our results indicate that strong CuAc2 adsorption at the surface may easily facilitate the uptake of precursor species (CuAc2/btc) with mass exceeding the equivalent of a monolayer and that ethanol alone may not be sufficient to (homogeneously) wash off these precursor species from the surface. In line with our interpretation, Stavila et al. have detected an increasing mass uptake with each step of the LbL synthesis, reaching 50 % of additional mass after five cycles.20 Ohnsorg et al.21 were the first to suggest that the linear growth rates observed with QCM13 can be interpreted with the growth of large MOF islands via the Volmer‐Weber mechanism,21, 22 rather than a controlled LbL growth. We additionally find that the fast local growth rates are the consequence of the solution‐mediated strong interactions between loosely attached (physisorbed) CuAc2 and btc, most likely taking place at the solid–liquid interface. Importantly, if the reaction components are carefully separated (e.g. by drying each half‐cycle), a very hindered and irregular growth with large presence of CuAc2 species in the film occurs. Note that this mechanism is particularly strong for HKUST‐1 and it may not explain the growth of other MOF frameworks.14
Whereas IRRAS was able to provide only limited and averaged information about growth of the film prepared with the manual synthesis with half‐cycle drying steps, we were readily able to apply PiFM‐IR to visualize and chemically characterize individual grains after a single LbL SURMOF deposition cycle (Figure 4). Two AFM topology images of different size are shown with their corresponding IR maps recorded at 1450 and 1577 cm−1 (magnifications of Figure 4 a–b including markers are shown in Figure S6 a–b). As such, the excess of CuAc2 on the surface can accurately be correlated with the topology. The IR maps in Figure 4 b/d, as well as point spectra taken on the sample surface (Figure 4 e), support the notion that the CuAc2 can be heterogeneously distributed over the surface, as well as the fact that extensive washing in combination with drying removes a large amount of physisorbed species resulting in inhomogeneous substrate coverage. However, AFM has shown an increase in SURMOF coverage with layer deposition (Figure 6), that is, growth does not occur solely on previously grown SURMOF. The irregular SURMOF crystal shapes observed in AFM for the one layer sample have not been encountered previously and require additional research.
Figure 4.
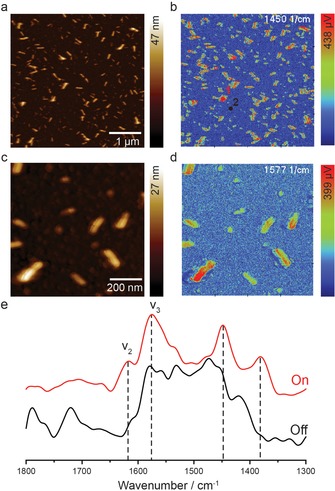
PiFM AFM images of a 1 layer HKUST‐1 SURMOF thin film. The sample was made using manual synthesis, including a drying step each half cycle. a) 5×5 μm2 AFM image showing the initial deposition of singular MOF islands. b) PiFM‐IR map of the substrate shown in (a) measured at 1450 cm−1 (magnifications of (a,b) can be found in Figure S6). c) 1×1 μm2 AFM image of the same sample and d) PiFM‐IR map measured at 1577 cm−1. e) Point IR spectra taken on top of a high feature (red) and on the background (black). Markers 1 and 2 in (b) show the sampling positions. Spectrum #1 clearly shows characteristic HKUST‐1 signal whereas the spectrum taken on the background does not. Note that there the intensity in 1600–1650 region could be lower due to lower power output of the IR laser in this region.
Figure 6.
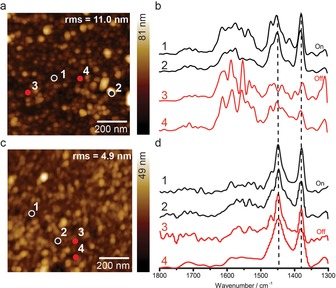
AFM topology images of HKUST‐1 SURMOF thin films of 5 layers grown using CuAc2 by manual synthesis (drying each half cycle) (a) and automated fast (c) LBL synthesis. b) and d) show normalized point spectra taken off and on top of high features in the samples shown in a) and c), respectively. A large difference in shape of spectra taken on/off high features of the manually grown SURMOF indicates a non‐uniform sample, whereas the chemical identity both on and off high features for the fast grown sample is homogeneous. Note that due to a dip in laser power between 1620–1670 cm−1, no reliable signal is acquired in this range.
To improve film quality, a synthesis procedure with washing yet without drying was adopted, as previous results suggest a deteriorating effect on thin film quality by drying. To verify film quality XRD measurements were employed to analyze crystal orientation. XRD samples require a thicker film to ensure sufficient signal, therefore in order to produce films for XRD analysis in a controlled and less labor intensive manner, an automatic dip‐coater was utilized to create SURMOFs of 50–150 deposition cycles. Initial attempts to reproduce the highly oriented (100) films, which are expected for [Cu3(btc)2] framework grown on a carboxylic acid terminated MHDA substrate,8 using similar immersion times and washing steps failed (30/60 min for CuAc2/btc, respectively, see Experimental Section: slow synthesis procedure 1). The synthesis resulted in films with mixed (100) and (111) preferential orientations (Figure 5 a, top, CuAc2 slow synthesis). AFM measurements indicated a highly heterogeneous film with crystal sizes significantly exceeding theoretical limits of the LbL synthesis (Figure 5 b). This result is in accordance with other reports in literature where authors noticed both (100) and (111) oriented crystallites.20, 21, 22 Remarkably, only reduced immersion times in both reactants and ethanol (2 min for both CuAc2 and btc, with a 20 s washing step, see Experimental Section, (fast) synthesis procedure 2) have led to (100) oriented films, (Figure 5 a, middle, CuAc2 fast synthesis).13 An AFM image shows significantly improved homogeneity of the film (Figure 5 c). IRRAS spectra for these films are shown in Figure S7. We interpret this result in relation to the crystallization rates from the solution. As the growth proceeds due to excess presence of SBU in the solution, their concentration at the solid–liquid interface is sufficient to produce a (100) oriented film. In contrast, significantly longer synthesis times may lead to higher growth rates that promote crystallization along both (111) and (100) directions.
Figure 5.
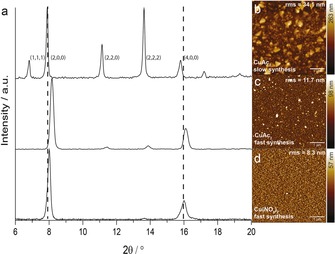
Out‐of‐plane X‐ray diffractograms (background corrected) and AFM images of 50 layers thin films synthesized using automatic dip‐coating with differentiating Cu‐precursor species and deposition/washing times (no drying). The following synthesis steps were used—slow synthesis: CuAc2 (30 min), btc (60 min) and ethanol (5 min); fast synthesis: CuAc2 or Cu(NO3)2 (2 min), btc (2 min) and ethanol (20 s). a) XRD diffractograms showing bulk film orientation resulting from slow automated synthesis (top) and preferential (100) orientation resulting from fast automated synthesis (middle, bottom). b–d) Corresponding AFM images illustrating resulting SURMOF film quality for slow synthesis with CuAc2 (b), fast synthesis with CuAc2 (c), and fast synthesis with Cu(NO3)2 (d). AFM root mean square values are included in AFM images to show improving surface quality through decreasing surface roughness.
From the results presented above, it is clear that the crystallographic orientation and degree of crystalline defects in a SURMOF film can be dramatically altered solely by synthetic conditions (i.e., the length and sequence of dipping, washing and drying steps) and that the termination of a SAM monolayer may not be overly detrimental for the outcome of the synthesis. To further illustrate this, we have compared two distinct films from manual and automatic synthesis. Even if we do not intend to fully compare (manual, automatic) synthesis procedures for resulting film quality, a comparison does illustrate the differences in underlying growth mechanisms. Using the above described procedure for manual synthesis with drying each half cycle, a five‐layer SURMOF was synthesized (Figure 6 a). The surface quality improved by applying (fast) automated synthesis, which is visible through increased flatness in the AFM (Figure 6 c), as similarly shown for the 50 layer XRD sample (Figure 5 b, c, Figure S8). In addition, the chemical (in‐)homogeneity was analyzed using PiFM‐IR (Figure 6 b, d). The sample made through manual synthesis (top) showed a non‐uniform chemical identity throughout the thin film. On top of larger features, distinctive HKUST‐1 peaks were measured (Figure 6 b, black lines), while no distinctive MOF signal was acquired on the background (Figure 6 b, red lines). Additionally a large presence of CuAc2, characteristic for hindered growth, was detected. The sample grown using fast automated synthesis, however, was found to be chemically homogeneous and possesses little CuAc2, both on top and off of high features. Unfortunately no statement can be made regarding the local defect concentration as a dip in laser power between 1620–1670 cm−1 prevented the detection of reliable IR signal, however bulk IRRAS experiments have shown fast automated synthesis to promote the full coordination of the [Cu2(btc)4] paddle‐wheel through the solution‐mediated growth.
Despite improvements of film quality by synthesis procedure optimization, the strong surface affinity of CuAc2 will nonetheless hinder a facile high quality growth of HKUST‐1 SURMOF. This can be overcome by replacing the CuAc2 precursor with the sterically less demanding copper‐nitrate precursor (Cu(NO3)2). Shekhah et al. have shown by QCM that the use of Cu(NO3)2 results in a much slower mass uptake than for CuAc2.13 These results have been explained by a suitable Cu‐paddle‐wheel structure of CuAc2, which is believed to facilitate the SURMOF growth. Strikingly, using Cu(NO3)2 as precursor species resulted in a highly oriented (100) film with a smooth surface and controlled growth that follows the island structure of the Au/Si substrate (Figure 5 d and Figure S7). By using the highly flat Au/mica substrates we obtained films with surface roughness around 4 nm after 50 cycles (Figure S8). An estimation based on IR intensity of Cu‐btc bands suggests roughly 3–5 times higher growth rates for CuAc2‐based films, as compared to Cu(NO3)2 after 20 immersion cycles (Figure 7 a). The big discrepancy in the uptake and growth rates between the two precursors originates from the higher adsorption affinity of CuAc2 and possibly formation of different SBUs than for Cu(NO3)2.32 This result is qualitatively in line with Shekhah et al., although from our results it is clear that (Cu(NO3)2) can produce [Cu3(btc)2] SURMOF, despite much slower surface uptake.13 Nevertheless, this uptake is sufficient to yield an increase of SURMOF growth to about deposited monolayer layer per synthesis cycle. We also note that Cu(NO3)2 has a low affinity for the Au/MHDA surface; when drying step each half‐cycle was applied, the amount of formed SURMOF was minimal (not shown here), but the growth of the SURMOF is still possible if the solution‐mediated mechanism takes place. This also imposes an important question of what the effect of the SBUs solution concentration is on SURMOF growth. Interestingly, when SURMOF films, grown for 3 immersion cycles according to the manual procedure, are exposed overnight to a direct synthesis solution (i.e., a solution containing both the Cu‐precursor and the btc linker), much faster growth of SURMOF film derived from Cu(NO3)2 is observed (Figure 7 b, top). This is in sharp contrast to a similar substrate being placed in a direct synthesis solution containing the CuAc2 precursor (Figure 7 b, bottom), which shows only LbL deposition and no delayed SURMOF synthesis from SBUs in the solution over time. This would suggest that (fully) coordinated copper paddle‐wheel formation in solution is fast for Cu(NO3)2, but surface deposition is slow due to lower surface affinity. Nevertheless, the crystallization of SURMOF from the direct solution is significantly faster in the case of Cu(NO3)2, which is also the reason why MOF materials are predominantly made with this precursor.
Figure 7.
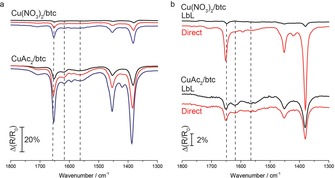
a) Comparison of IRRAS spectra of [Cu3(btc)2] films obtained after 5 (black), 10 (red), and 20 cycles (blue) of manual synthesis, with full cycle drying steps, for copper nitrate (top) and copper acetate (bottom). The estimated peak height ratio between the two reactants results in 3–5 times higher amount of film for copper‐acetate‐based substrate. b) Comparison of IRRAS spectra of [Cu3(btc)2] films obtained after 3 cycles of the manual synthesis, with full cycle drying steps (black), and after subsequent addition of the reactant's mixture (i.e., Cu+btc) overnight (red), copper nitrate (top) and copper acetate (bottom).
Our mechanistic insights enable significantly faster synthesis of the oriented SURMOF films by the LbL method. In our example, we managed to shorten the synthesis time for 100 cycles from almost 7 days to less than 8 h. This places the LbL synthesis of MOF films to a practically reachable time scales as further optimizations are certainly expected. At the same time, the mechanistic details emerging from this work explain the success of other previously reported methods to produce highly oriented MOF films with significantly faster growth rates, such as in the automated spray synthesis.23
Conclusion
A powerful combination of IR spectroscopy‐based methods, including AFM‐IR spectroscopy, sheds more light on the growth mechanism of [Cu3(btc)2] films and imposes important questions of rethinking the generally used LbL SURMOF assembly methodology. Through the application of multiple synthesis methods, both initial growth mechanisms can be unraveled and HKUST‐1 SURMOF quality can be improved. A manual LbL synthesis, which includes a drying step, provided the careful separation of growing stages, necessary to study the influence of separate precursor (metal/linker) species. As such, for the first time spectroscopic IR signatures for different copper‐carboxylate species are reported here. Additionally, the extent of drying applied during manual synthesis has been found to largely determine the SURMOF growth rate. We argue that this effect is related to the degree of physisorption of the metal precursor species, CuAc2, where a high (non‐stoichiometric) amount of adsorbed surface species promotes faster growth.
From findings supported by bulk IR analysis (IRRAS), we have concluded that HKUST‐1 SURMOF does not grow via a pure LbL mechanism, but rather through solution mediated growth (Figure 8). As a result, Volmer–Weber type island formation is seen in AFM. These separate MOF grains can be individually characterized chemically by novel AFM‐IR techniques. Chemical (in‐)homogeneity can be probed through point specific IR spectrum acquisition as well as IR mapping of precursor‐ and/or SURMOF species. A second synthesis procedure, namely an automated dipping synthesis, provided facile means for producing thick LbL films (50–150 layers) suitable for XRD analysis. XRD analysis showed that synthesis procedures comparable to ones reported in literature can produce non‐oriented SURMOFs. Therefore, the outcome of the synthesis largely depends on the synthetic procedure and related excess amounts of precursor species.
Figure 8.
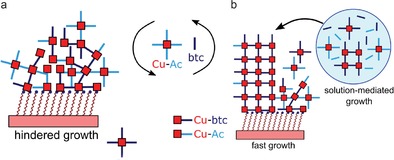
Simplified illustrations of the hindered (a) and solution‐mediated (b) film growth mechanism of HKUST‐1 SURMOF.
Optimizing the automated dipping procedure, by reducing dipping and washing times, could be used to improve film quality towards preferentially (100) oriented films. As a result, the synthesis time needed for producing such oriented films also decreased significantly; however, copper acetate‐related defects cannot be avoided. Additionally, IR studies could be used to provide more insight on the influence of metal precursor species on SURMOF quality. Comparing CuAc2 and Cu(NO3)2 led to the discovery of the applicability of the latter for producing LbL SURMOFs. Remarkably, using Cu(NO3)2, increasingly flat and homogeneous films could be produced. This research deduced a difference in surface adsorption between metal precursor species to strongly influence growth rates as well as resulting film quality. Our findings provide general guidelines for the synthesis and characterization of other SURMOFs as well. The mechanistic insights and experimental procedures developed in this work can therefore pave the way to significantly faster synthesis of defect‐free surface‐mounted MOF thin‐films.
Experimental Section
The following chemicals were used: 16‐Mercaptohexadecanoic acid (99 %, Sigma–Aldrich), absolute ethanol (99.5 %, Acros), CuIIacetate (98 %, Aldrich), Copper(II) nitrate trihydrate (99+%, Sigma–Aldrich), trimesic acid (95 %, Aldrich) and acetic acid (99.5 %, Acros). Substrates of 60 nm Au on Si, with a 5 nm Ge adhesion layer (provided by AMOLF), and 200 nm Au on mica (Phasis, Switzerland) were functionalized with a self‐assembled monolayer (SAM) by immersing in 20 μm 16‐mercaptohexadecanoic acid solution (5 % acetic acid in ethanol) for 48 h.38
Manual LbL deposition (drying): HKUST‐1 thin films were deposited by successively placing Au–MHDA substrates in separate ethanolic 1 mm precursor solutions of CuAc2 (10 min) and btc solution (20 min). Each half‐cycle, that is, after deposition of Cu‐precursor or btc, was followed by (vigorous) 5 min rinsing with absolute ethanol and immediate drying using flowing nitrogen. All syntheses were performed at room temperature.
Automated solution mediated LbL deposition (no drying): An automatic synthesis procedure (initially developed for successive ionic layer adsorption and reaction (SILAR)) was used to synthesize films in a reproducible fashion. A SILAR coating system with stirrer (HO‐TH‐03S, Holmarc)) was used to program immersion cycles in copper‐precursor, btc and ethanol. No drying step was applied. The stirring speed was kept constant at 150 rpm as well as the precursor solutions concentration (1 mm). All syntheses were performed at room temperature. General synthesis procedures have been derived—(slow) synthesis procedure 1: deposition time of 30 and 60 min in Cu‐ and btc solution, respectively, with a washing step including stirring of 5 min in ethanol; (fast) synthesis procedure 2: deposition times of 2 min in Cu‐ and btc solution, with a washing step including stirring of 20 s in ethanol.
IRRAS: Infrared reflection absorption spectroscopy (IRRAS) spectra were recorded using a PelkinElmer Spectrum 1 infrared spectrometer equipped with grazing angle specular reflectance accessory (Specac) and a mercury cadmium telluride (MCT) detector cooled with liquid nitrogen. The sample and optics compartments were purged with nitrogen. Incident IR beam was vertically polarized with a grazing incidence angle of 80°. All spectra were recorded with 4 cm−1 spectral resolution, 450–4000 cm−1 range, with typically 50 accumulations. For monolayer studies, a gold substrate functionalized with deuterated 1‐hexadecane‐d33‐thiol (C/D/N Isotopes) as SAM was used as a reference. For high‐absorbance experiments, clean gold wafers were used as reference.
AFM‐IR: AFM‐nano‐IR measurements have been performed using an Anasys nanoIR2 instrument at the facilities of Anasys Instruments (Santa Barbara, CA, USA), as well as at Oak Ridge National Laboratory (ORNL, Oak Ridge, TN, USA, i.e., Figure S5). Additionally, photo‐induced force microscopy (PiFM) measurements have been performed on a VistaScope instrument from Molecular Vista, using the facilities at Molecular Vista (San Jose, CA, USA). All machines were equipped with a quantum cascade laser (QCL) units and IR spectra were measured in the1300‐1800 cm−1 range. Prior to IR analysis, AFM topology images were made at least two sample positions in either tapping‐ or contact mode, typical AFM image sizes were 1×1 μm2, 3×5 μm2 and 5×5 μm2. IR point spectra could be collected in tapping‐ (PiFM) and contact mode (nano‐IR). AFM‐nanoIR spectra acquired using an Anasys nanoIR2 apparatus were analyzed using the Analysis Studio software (version 3.13), AFM‐IR (/PiFM) spectra were analyzed using SurfaceWorks software (version 2.3). A Savitsky–Golay filter was applied to the spectra.
AFM: AFM topology maps in 3 separate positions on each sample were obtained using a JPK NanoWizard 3 and HA NC Etalon polysilicon tips (force constant ≈3.5 N m−1, tip curvature radius <10 nm). The obtained images were post‐processed using Gwyddion. After masking larger features using the ‘Facet Analysis’ function, the images were flattened using a polynomial background subtraction, disregarding the masked features. The calculated volume was obtained by using the ‘Facet Analysis’ function of Gwyddion, marking the larger grains. Then, the volume value was given using the ‘Grain statistics’, working with the volume using Laplacian background subtraction.39
XRD: X‐ray diffraction (XRD) measurements were performed using a Bruker‐AXS D2 Phaser equipped with a Co Kα radiation (λ=1,78897 Å) source with 2θ from 6 –20°, using an increment of 0.02°, with a step measurement time of 1 s. Background subtractions were performed using Eva software and diffractograms were normalized to the (2,0,0) peak.
Conflict of interest
The authors declare no conflict of interest.
Supporting information
As a service to our authors and readers, this journal provides supporting information supplied by the authors. Such materials are peer reviewed and may be re‐organized for online delivery, but are not copy‐edited or typeset. Technical support issues arising from supporting information (other than missing files) should be addressed to the authors.
Supplementary
Acknowledgements
The authors sincerely thank Anasys Instruments (Santa Barbara, US) for providing measurement time on their nanoIR2‐FS microscope. Dr. Anirban Roy and Kevin Kjoller (Anasys Instruments) are kindly acknowledged for their technical guidance and useful discussions during the measurements. A portion of AFM‐nano‐IR measurements was conducted at the Center for Nanophase Materials Sciences of Oak Ridge National Laboratory (ORNL), which is a DOE Office of Science User Facility. Dr. Songkil Kim (ORNL) is thanked for the help with measurements. The authors would also like to express their gratitude towards Molecular Vista for allowing us measurement time on their VistaScope tool. Katie Park, Dr. Derek Nowak and Dr. Sung Park were instrumental to acquiring our results and are therefore kindly acknowledged. This work is supported by a Netherlands Organization of Scientific Research (NWO) Gravitation program (Netherlands Center for Multiscale Catalytic Energy Conversion, MCEC) and a European Research Council (ERC) Advanced Grant (no. 321140).
G. Delen, Z. Ristanović, L. D. B. Mandemaker, B. M. Weckhuysen, Chem. Eur. J. 2018, 24, 187.
References
- 1. Furukawa H., Cordova K. E., O′Keeffe M., Yaghi O. M., Science 2013, 341, 1230444. [DOI] [PubMed] [Google Scholar]
- 2. Farrusseng D., Metal-Organic Frameworks: Applications from Catalysis to Gas Storage, Wiley-VCH, Weinheim, 2011. [Google Scholar]
- 3. M. S. Denny, Jr. , Moreton J. C., Benz L., Cohen S. M., Nat. Rev. Mater. 2016, 1, 16078. [Google Scholar]
- 4. Shekhah O., Liu J., Fischer R. A., Wöll C., Chem. Soc. Rev. 2011, 40, 1081–1106. [DOI] [PubMed] [Google Scholar]
- 5. Zhao S., Wang Y., Dong J., He C.-T., Yin H., An P., Zhao K., Zhang X., Gao C., Zhang L., Lv J., Wang J., Zhang J., Khattak A. M., Khan N. A., Wie Z., ZHang J., Liu S., Tang H.Zhao. Z., Nat. Energy 2016, 1, 16184. [Google Scholar]
- 6. Heinke L., Tu M., Wannapaiboon S., Fischer R. A., Wöll C., Microporous Mesoporous Mater. 2015, 216, 200–215. [Google Scholar]
- 7. Bétard A., Fischer R. A., Chem. Rev. 2012, 112, 1055–1083. [DOI] [PubMed] [Google Scholar]
- 8. Shekhah O., Wang H., Kowarik S., Schreiber F., Paulus M., Tolan M., Sternemann C., Evers F., Zacher D., Fischer R. A., C, Wöll , J. Am. Chem. Soc. 2007, 129, 15118–15119. [DOI] [PubMed] [Google Scholar]
- 9. Kanaizuka K., Haruki R., Sakata O., Yoshimoto M., Akita Y., Kitagawa H., J. Am. Chem. Soc. 2008, 130, 15778–15779. [DOI] [PubMed] [Google Scholar]
- 10. Shekhah O., Wang H., Paradinas M., Ocal C., Schüpbach B., Terfort A., Zacher D., Fischer R. A., Wöll C., Nat. Mater. 2009, 8, 481–484. [DOI] [PubMed] [Google Scholar]
- 11. Liu J., Lukose B., Shekhah O., Arslan H. K., Weidler P., Gliemann H., Bräse S., Grosjean S., Godt A., Feng X., Müllen K., Magdau I. B., Heine T., Wöll C., Sci. Rep. 2012, 2, 921. [DOI] [PMC free article] [PubMed] [Google Scholar]
- 12. Makiura R., Motoyama S., Umemura Y., Yamanaka H., Sakata O., Kitagawa H., Nat. Mater. 2010, 9, 565–571. [DOI] [PubMed] [Google Scholar]
- 13. Shekhah O., Wang H., Zacher D., Fischer R. A., Wöll C., Angew. Chem. Int. Ed. 2009, 48, 5038–5041; [DOI] [PubMed] [Google Scholar]; Angew. Chem. 2009, 121, 5138–5142. [Google Scholar]
- 14. Zhuang J.-L., Kind M., Grytz C. M., Farr F., Diefenbach M., Tussupbayev S., Holthausen M. C., Terfort A., J. Am. Chem. Soc. 2015, 137, 8237–8243. [DOI] [PubMed] [Google Scholar]
- 15. Arslan H. K., Shekhah O., Wieland D. C. F., Paulus M., Sternemann C., Schroer M. A., Tiemeyer S., Tolan M., Fischer R. A., Wöll C., J. Am. Chem. Soc. 2011, 133, 8158–8161. [DOI] [PubMed] [Google Scholar]
- 16. Haraguchi T., Otsubo K., Sakata O., Fujiwara A., Kitagawa H., J. Am. Chem. Soc. 2016, 138, 16787–16793. [DOI] [PubMed] [Google Scholar]
- 17. Sakaida S., Otsubo K., Sakata O., Song C., Fujiwara A., Takata M., Kitagawa H., Nat. Chem. 2016, 8, 377–383. [DOI] [PubMed] [Google Scholar]
- 18. Liu J., Shekhah O., Stammer X., Arslan H. K., Liu B., Schüpbach B., Terfort A., Wöll C., Materials 2012, 5, 1581–1592. [Google Scholar]
- 19. Biemmi E., Scherb C., Bein T., J. Am. Chem. Soc. 2007, 129, 8054–8055. [DOI] [PubMed] [Google Scholar]
- 20. Stavila V., Volponi J., Katzenmeyer A. M., Dixon M. C., Allendorf M. D., Chem. Sci. 2012, 3, 1531–1540. [Google Scholar]
- 21. Ohnsorg M. L., Beaudoin C. K., Anderson M. E., Langmuir 2015, 31, 6114–6121. [DOI] [PubMed] [Google Scholar]
- 22. Summerfield A., Cebula I., Schröder M., Beton P. H., J. Phys. Chem. C 2015, 119, 23544–23551. [DOI] [PMC free article] [PubMed] [Google Scholar]
- 23. Arslan H. K., Shekhah O., Wohlgemuth J., Franzreb M., Fischer R. A., Wöll C., Adv. Funct. Mater. 2011, 21, 4228–4231. [Google Scholar]
- 24. Ameloot R., Vermoortele F., Vanhove W., Roeffaers M. B. J., Sels B. F., De Vos D. E., Nat. Chem. 2011, 3, 382–387. [DOI] [PubMed] [Google Scholar]
- 25. Xu G., Yamada T., Otsubo K., Sakaida S., Kitagawa H., J. Am. Chem. Soc. 2012, 134, 16524–16527. [DOI] [PubMed] [Google Scholar]
- 26. Stassen I., Styles M., Grenci G., Gorp H. V., Vanderlinden W., Feyter S. D., Falcaro P., De Vos D. E., Vereecken P., Ameloot R., Nat. Mater. 2016, 15, 304–310. [DOI] [PubMed] [Google Scholar]
- 27. Falcaro P., Okada K., Hara T., Ikigaki K., Tokudome Y., Thornton A. W., Hill A. J., Williams T., Doonan C., Takahashi M., Nat. Mater. 2017, 16, 342–348. [DOI] [PubMed] [Google Scholar]
- 28. Gu Z.-G., Pfriem A., Hamsch S., Breitwieser H., Wohlgemuth J., Heinke L., Gliemann H., Wöll C., Microporous Mesoporous Mater. 2015, 211, 82–87. [Google Scholar]
- 29. Zacher D., Schmid R., Wöll C., Fischer R. A., Angew. Chem. Int. Ed. 2011, 50, 176–199; [DOI] [PubMed] [Google Scholar]; Angew. Chem. 2011, 123, 184–208. [Google Scholar]
- 30. Dazzi A., Prater C. B., Chem. Rev. 2016, 116, 5146–5173. [DOI] [PubMed] [Google Scholar]
- 31.
- 31a. Nowak D., Morrison W., Wickramasinghe H. K., Jahng J., Potma E., Wan L., Ruiz R., Albrecht T. R., Schmidt K., Frommer J., Sanders D. P., Park S., Sci. Adv. 2016, 2, e1501571; [DOI] [PMC free article] [PubMed] [Google Scholar]
- 31b.D. Fu, K. Park, G. Delen, Ö. Attila, F. Meirer, D. Nowak, S. Park, J. E. Schmidt, B. M. Weckhuysen, Chem. Commun 2017, DOI: https://doi.org/10.1039/C7CC06832H. [DOI] [PubMed]
- 32. Shoaee M., Anderson M. W., Attfield M. P., Angew. Chem. Int. Ed. 2008, 47, 8525–8528; [DOI] [PubMed] [Google Scholar]; Angew. Chem. 2008, 120, 8653–8656. [Google Scholar]
- 33. Lupulescu A. I., Rimer J. D., Science 2014, 344, 729–732. [DOI] [PubMed] [Google Scholar]
- 34. Wu C.-Y., Wolf W. J., Levartovsky Y., Bechtel H. A., Martin M. C., Toste F. D., Gross E., Nature 2017, 541, 511–515. [DOI] [PubMed] [Google Scholar]
- 35. Katzenmeyer A. M., Canivet J., Holland G., Farrusseng D., Centrone A., Angew. Chem. Int. Ed. 2014, 53, 2852–2856; [DOI] [PubMed] [Google Scholar]; Angew. Chem. 2014, 126, 2896–2900. [Google Scholar]
- 36. Liu J., Wächter T., Irmler A., Weidler P. G., Gliemann H., Pauly F., Mugnaini V., Zharnikov M., Wöll C., ACS Appl. Mater. Interfaces 2015, 7, 9824–9830. [DOI] [PubMed] [Google Scholar]
- 37. Borfecchia E., Maurelli S., Gianolio D., Groppo E., Chiesa M., Bonino F., Lamberti C., J. Phys. Chem. C 2012, 116, 19839–19850. [Google Scholar]
- 38. Arnold R., Azzam W., Terfort A., Wöll C., Langmuir 2002, 18, 3980–3992. [Google Scholar]
- 39. Nečas D., Klapetek P., Cent. Eur. J. Phys. 2012, 10, 181–188. [Google Scholar]
Associated Data
This section collects any data citations, data availability statements, or supplementary materials included in this article.
Supplementary Materials
As a service to our authors and readers, this journal provides supporting information supplied by the authors. Such materials are peer reviewed and may be re‐organized for online delivery, but are not copy‐edited or typeset. Technical support issues arising from supporting information (other than missing files) should be addressed to the authors.
Supplementary


