

Abstract
Two‐dimensional shear wave elastography (2D‐SWE) has proven to be efficient for the evaluation of liver fibrosis in small to moderate‐sized clinical trials. We aimed at running a larger‐scale meta‐analysis of individual data. Centers which have worked with Aixplorer ultrasound equipment were contacted to share their data. Retrospective statistical analysis used direct and paired receiver operating characteristic and area under the receiver operating characteristic curve (AUROC) analyses, accounting for random effects. Data on both 2D‐SWE and liver biopsy were available for 1,134 patients from 13 sites, as well as on successful transient elastography in 665 patients. Most patients had chronic hepatitis C (n = 379), hepatitis B (n = 400), or nonalcoholic fatty liver disease (n = 156). AUROCs of 2D‐SWE in patients with hepatitis C, hepatitis B, and nonalcoholic fatty liver disease were 86.3%, 90.6%, and 85.5% for diagnosing significant fibrosis and 92.9%, 95.5%, and 91.7% for diagnosing cirrhosis, respectively. The AUROC of 2D‐SWE was 0.022‐0.084 (95% confidence interval) larger than the AUROC of transient elastography for diagnosing significant fibrosis (P = 0.001) and 0.003‐0.034 for diagnosing cirrhosis (P = 0.022) in all patients. This difference was strongest in hepatitis B patients. Conclusion: 2D‐SWE has good to excellent performance for the noninvasive staging of liver fibrosis in patients with hepatitis B; further prospective studies are needed for head‐to‐head comparison between 2D‐SWE and other imaging modalities to establish disease‐specific appropriate cutoff points for assessment of fibrosis stage. (Hepatology 2018;67:260‐272).
Abbreviations
- AUROC
area under the ROC curve
- DOR
diagnostic odds ratio
- 2D‐SWE
two‐dimensional shear wave elastography
- HBV
hepatitis B virus
- HCV
hepatitis C virus
- IQR
interquartile range
- MRE
magnetic resonance elastography
- NAFLD
nonalcoholic fatty liver disease
- ROC
receiver operating characteristic
- TE
transient elastography
Chronic liver diseases can cause a sustained or intermittent inflammation of the liver associated with a healing process, leading to progressive fibrosis and finally to cirrhosis.1 Patients with cirrhosis are at risk of developing complications, including esophageal varices, ascites, liver failure, encephalopathy, and hepatocellular carcinoma.2 Accurate assessment of the severity of liver fibrosis and a reliable diagnosis of cirrhosis are important steps for the management of patients with chronic liver diseases as they provide information that guides therapeutic decisions.1, 2 For decades liver biopsy has been used as the reference standard for staging liver fibrosis. Liver biopsy, however, is an invasive method associated with patient discomfort, cost, and rarely serious complications.3 In addition, its accuracy is limited due to intraobserver and interobserver variability and sampling error.4 In recent years, research has focused on the evaluation of noninvasive methods for the assessment of liver fibrosis.5 The most intensively evaluated noninvasive method is the measurement of liver stiffness, mainly with ultrasound‐based shear wave elastography. Different shear wave–based elastographic methods are available, including transient elastography (TE), point shear wave elastography, and two‐dimensional shear wave elastography (2D‐SWE).6, 7 The most extensively evaluated elastographic method for liver stiffness is TE (FibroScan; Echosens, Paris, France). It was first on the market and has good diagnostic accuracy of at least significant liver fibrosis and excellent diagnostic accuracy of liver cirrhosis.6, 8, 9, 10, 11 However, the method is limited by a high rate of unreliable results (15%‐20%).12 2D‐SWE based on supersonic shear imaging (SuperSonic Imagine; Aixplorer, Aix‐en‐Provence, France) is an elastographic technique with the following differences from TE: (1) integration into a conventional ultrasound imaging machine with conventional ultrasound probes during a routine ultrasound scan, (2) exact localization of the region of interest during B‐mode ultrasound, (3) no limitation of stiffness measurement in patients with ascites, and (4) performance of real‐time 2D‐SWE as the shear waves are generated by ultrasound pushes and their propagation is recorded at a higher frame rate than in conventional ultrasound imaging devices.13, 14 In contrast, TE has the advantage of improved portability. The real‐time imaging also allows assessement of the stability of the measurement and quantification of an average value of stiffness in a large region of interest for higher reliability. 2D‐SWE has proven to be efficient for the evaluation of liver fibrosis in several small to moderate‐sized trials, which reported equivalent to superior diagnostic accuracies compared to TE and point SWE for the assessment of liver fibrosis.15, 16, 17, 18, 19, 20
In this meta‐analysis we aimed at collecting a large pool of individual patient data in order to assess the value of 2D‐SWE for staging liver fibrosis in patients with chronic liver diseases of various etiologies using liver biopsy as a reference. As a second objective we also aimed to compare the diagnostic performance of 2D‐SWE with that of TE.
Materials and Methods
This meta‐analysis was not based on a systematic review of published results. Instead, clinical centers that have worked with Aixplorer ultrasound equipment and with known experience with it were contacted and proposed to participate in the retrospective analysis by contributing patients' data from their centers. Hereby, patients' data, which were already published as center‐based studies, were accepted.15, 16, 17, 18, 19, 20 Published data of centers not participating in this study are compared in the discussion.
Information on hepatology centers with experience in the use of 2D‐SWE for liver stiffness measurements was brought by SuperSonic Imagine and the other study contributors. Selection criteria were (1) chronic liver disease patients undergoing a liver ultrasound examination including 2D‐SWE with the Aixplorer, (2) age 18 years or older, and (3) a recent liver biopsy for histological evaluation of fibrosis. Liver biopsy and histopathological analysis were staged locally at each center with pathologists blinded to the results of 2D‐SWE in all centers. All fibrosis stages were converted to METAVIR, where stages 2 or worse is categorized as significant fibrosis, stage 3 or worse is categorized as severe fibrosis, and stage 4 corresponds to liver cirrhosis without reassessing pathological reports.21 The histological fibrosis stage was used as the gold standard for analysis. Brunt steatosis score was also used.22
Exclusion criteria included (1) age below 18 years, (2) previous liver transplantation, (3) no 2D‐SWE measurements reported or 2D‐SWE technical failures, (4) time between liver biopsy and 2D‐SWE of more than 24 weeks, and (5) liver biopsy samples smaller than 10 mm or having fewer than six portal tracts.
Centers were asked to share the following data (see also Table 1):
demographic and clinical data (gender, age, height, weight, body mass index, presence of metabolic syndrome, diabetes mellitus, ascites, fasting status, liver disease etiology)
results of 2D‐SWE measurement (date of assessment, number of measurements)
results of liver biopsy (date of liver biopsy, histological liver fibrosis stage, length of biopsy samples, number of portal tracts, grade of inflammation, and steatosis)
laboratory data, which were converted into uniform units: platelet counts (109/L), urea (millimoles per liter), creatinine (micromoles per liter), aspartate aminotransferase (international units per liter), alanine aminotransferase (international units per liter), gamma‐glutamyltransferase (international units per liter), alkaline phosphatases (international units per liter), α2‐macroglobulin (grams per liter), apolipoprotein A1 (grams per liter), triglyceride (millimoles per liter), fasting blood glucose (millimoles per liter), high‐density lipoprotein cholesterol (millimoles per liter), low‐density lipoprotein cholesterol (millimoles per liter), total cholesterol (millimoles per liter), bilirubin (micromoles per liter), haptoglobin (grams per liter), albumin (grams per deciliter), prothrombin index, international normalized ratio, C‐reactive protein
if available, results on TE measurement (date, number of measurements, median of measurements, interquartile range [IQR])
Table 1.
Patient Characteristics
| All | HCV | HBV | NAFLD | Other | |
|---|---|---|---|---|---|
| (n = 1,134) | (n = 379, 33.4%) | (n = 400, 35.5%) | (n = 156, 13.8%) | (n = 199, 17.5%) | |
| Gender M/n (%) | 685/1,114 (61.5%) | 245/379 (64.6%) | 248/380 (65.3%) | 72/156 (53.8%) | 108/199 (54.3%) |
| Age (years)b (n = 1,116) | 48.9 (13, 18‐85) | 48.7 (12, 19‐79) | 46.5 (13, 20‐82) | 53.7 (13, 20‐83) | 49.9 (14, 18‐85) |
| Body mass index (kg/m2)b (n = 839) | 25.9 (5.2, 16‐59) | 25.2 (4.1, 16‐37) | 24.9 (4.9, 16‐59) | 31.2 (5.8, 20‐52) | 24.5 (4.6, 18‐59) |
| Metabolic syndrome/n (%) | 71/348 (20.4%) | 24/158 (15.2%) | 3/38 (7.9%) | 39/59 (66.1%) | 5/93 (5.4%) |
| Ascites/n (%) | 1/71 (1.4%) | 0/26 (0%) | 0/6 (0%) | 0/27 (0%) | 1/12 (8.3%) |
| Fibrosis stagea | |||||
| 0, 1 (%) | 519 (45.8%) | 158 (41.7%) | 192 (48.0%) | 65 (41.7%) | 104 (52.3%) |
| 2 (%) | 251 (22.1%) | 94 (24.8%) | 89 (22.2%) | 41 (26.3%) | 27 (13.6%) |
| 3 (%) | 180 (15.9%) | 58 (25.4%) | 67 (16.8%) | 31 (19.9%) | 24 (12.1%) |
| 4 (%) | 184 (16.2%) | 69 (18.2%) | 52 (13.0%) | 19 (12.2%) | 44 (22.1%) |
| Activity stagea | (n = 809) | (n = 368) | (n = 102) | (n = 151) | (n = 188) |
| 0 (%) | 112 (13.8%) | 16 (4.3%) | 22 (21.6%) | 22 (14.6%) | 52 (27.7%) |
| 1 (%) | 379 (46.8%) | 164 (44.6%) | 57 (55.9%) | 80 (53.0%) | 78 (41.5%) |
| 2 (%) | 238 (29.4%) | 140 (38.0%) | 14 (13.7%) | 40 (26.5%) | 44 (23.4%) |
| 3 (%) | 80 (9.9%) | 9 (13.0%) | 9 (8.8%) | 9 (6.0%) | 14 (7.4%) |
| Brunt steatosis score | (n = 732) | (n = 342) | (n = 94) | (n = 121) | (n = 175) |
| 0 (%) | 310 (42.3%) | 152 (44.4%) | 57 (61%) | 2 (1.7%) | 99 (56.6%) |
| 1 (%) | 253 (34.6%) | 141 (41.2%) | 30 (32%) | 28 (23.1%) | 54 (30.9%) |
| 2 (%) | 103 (14.1%) | 38 (11.1%) | 5 (5%) | 43 (35.5%) | 17 (9.7%) |
| 3 (%) | 66 (9.0%) | 11 (3.2%) | 2 (2%) | 48 (39.7%) | 5 (2.9%) |
| AST (IU/L)b (n = 779) | 72.5 (103, 8‐1,583) | 85.2 (119, 9‐1,583) | 52.0 (75, 11‐758) | 48.4 (29, 15‐222) | 83.6 (120, 8‐872) |
| ALT (IU/L)b (n = 997) | 91.8 (109, 9‐1,473) | 110.1 (118, 10‐824) | 76.4 (82, 9‐900) | 70.0 (48, 11‐332) | 100.7 (151, 9‐1,473) |
| GGT (IU/L)b (n = 760) | 156.5 (281, 8‐4,244) | 157.9 (334, 8‐4,244) | 60.8 (92, 9‐690) | 152.0 (245, 19‐1,632) | 225.9 (278, 9‐1,788) |
| Platelet count (count 109/L)b (n = 936) | 199.6 (70, 6‐653) | 201.5 (73, 21‐437) | 192.0 (54, 49‐392) | 213.4 (70, 60‐440) | 199.8 (87, 6‐653) |
| Fasting/n (%) | 618/620 (99.7%) | 89/91 (97.8%) | 283/283 (100%) | 119/119 (100%) | 127/127 (100%) |
| Creatinine (mmol/L)b (n = 384) | 75.7 (67, 20‐901) | 77.7 (92, 38‐901) | 93.6 (111, 45‐650) | 69.3 (23, 30‐170) | 74.9 (56, 20‐559) |
| Albumin (g/dL)b (n = 759) | 4.25 (0.48, 1.3‐5.3) | 4.18 (0.50, 2.5‐5.3) | 4.43 (0.37, 3.1‐5.3) | 4.22 (0.51, 1.3‐5.2) | 3.94 (0.51, 2.6‐5.0) |
| Triglyceride (mmol/L)b (n = 586) | 1.41 (0.99, 0.3‐13.1) | 1.26 (0.89, 0.4‐6.3) | 1.35 (1.03, 0.3‐13.1) | 1.93 (1.12, 0.6‐7.1) | 1.20 (0.68, 0.4‐5.2) |
| Fasting blood glucose (mmol/L)b (n = 614) | 5.7 (1.9, 2.6‐23.9) | 5.7 (2.5, 3.1‐23.9) | 5.5 (1.7, 3.7‐17.5) | 6.3 (1.8, 2.6‐12.1) | 5.4 (1.7, 3.3‐17.8) |
| Total bilirubin (μmol/L)b (n = 893) | 18.0 (40, 4‐900) | 25.3 (72, 4‐900) | 14.4 (11, 4‐139) | 12.2 (12, 4‐126) | 19.3 (24, 4‐143) |
These analyses use METAVIR stage or comparative histological assessment of liver fibrosis categorized as none or mild fibrosis (stage 0, 1), significant fibrosis (2), severe fibrosis (3), and cirrhosis (4). Correspondingly, activity stages are categorized.
This overview does not account for the heterogeneity between sites. Continuous markers are given as mean (standard deviation, minimum‐maximum).
Abbreviations: ALT, alanine aminotransferase; AST, aspartate aminotransferase; GGT, gamma‐glutamyltransferase;
All data were checked for using the same scaling. Inconsistencies were found for albumin and IQR of TE and corrected accordingly.
The database was cleared by the French National Commission on Information Technology and Liberties, and the study was registered on clinicaltrials.gov (NCT02181452).
All patients received 2D‐SWE by examiners blinded to the results of liver biopsy.
2D‐SWE USING SUPERSONIC SHEAR WAVE ELASTOGRAPHY
2D‐SWE was performed using the Aixplorer ultrasound system with the SC6‐1 abdominal convex probe. The technique used to perform 2D‐SWE has been described23 and combines an acoustic radiation force‐induced supersonic push in tissue by focused ultrasonic beams, followed by an ultrafast ultrasound imaging sequence. Elasticity values are displayed as a real‐time color‐coded 2D quantitative SWE map of tissue stiffness expressed in kilopascals or of shear wave velocity in tissue expressed in meters per second. This map is displayed in color over a conventional gray‐scale B‐mode image. The size and position of the SWE map and the circular region of interest used for stiffness/velocity measurement are operator‐adjustable.7, 17, 19, 20 2D‐SWE acquisitions were performed on fasting patients at all sites, with patients in the supine position. For each patient, 1‐10 2D‐SWE measurements (depending on the standard procedure at each center) were performed in the right liver lobe with an intercostal approach. As suggested by the manufacturer, the measurement was performed 1‐2 cm under the liver capsule, in an area of parenchyma. The mean and standard deviation within the region of interest were recorded. Technical failure was defined as the inability to obtain a successful SWE measurement. If more than one 2D‐SWE measurement were reported, the median was used for further evaluations.
TRANSIENT ELASTOGRAPHY
One‐dimensional TE was carried out using the FibroScan. This technique uses low‐frequency (50 Hz) mechanically generated shear waves whose propagation velocity is measured with an ultrasound beam. The pulse‐echo ultrasound captures the shear wave propagation velocity and provides an average stiffness measurement. The procedure was performed through the intercostal space in the right liver lobe at a measurement depth of 25‐65 mm (M probe) or 35‐75 mm (XL probe) in all but two sites (GR, FR2), where only the M probe was used. Details have been published.6, 7, 8, 9, 10, 11 We used only TE results reported as successful measurements and which had an IQR/median ≤0.3.24
STATISTICAL ANALYSIS
The evaluated population is neither per‐protocol nor intention‐to‐diagnose in a strict sense due to the retrospective nature of this meta‐analysis.
In order to optimize cutoff points, a random effect model was used to estimate the receiver operating characteristic (ROC) curve and the area under the ROC curve (AUROC). Therefore, we estimated sensitivity and specificity for each potential cutoff point. A DerSimonian and Laird random effect model using arcsin transformations of proportions was performed to obtain the ROC curve and the AUROC. As usual, we categorized the AUROC as excellent if it was above 90%, as good for values between 80% and 90%, and as fair for values between 70% and 80%. For estimating the AUROC values, we used this random effect estimator with all data. To assess risk of bias and small study effects, we analyzed individual AUROC values for potential trends. Furthermore, risk of bias from selecting data with liver biopsy only was assessed by comparing the results including data from patients with known liver cirrhosis from their clinical history.
In addition, nonparametric rank correlation between 2D‐SWE measurements and fibrosis stages were calculated at each site, and a stratified test was used to test for statistical significance.
Nevertheless, because of the relatively large data set and the high heterogeneity in the prevalence of the different fibrosis stages, we included aspects of an Obuchowski analysis25 for diagnosing an ordinal but nonbinary scaled endpoint when optimizing cutoff points as follows: to estimate an optimal cutoff point for diagnosing significant fibrosis, only data from patients with fibrosis stage 0‐2 were used. Similarly, only data from patients with fibrosis stage 2‐3 were used to optimize a cutoff point for diagnosing severe fibrosis, and only data from patients with fibrosis stage 3 or cirrhosis were used to optimize a cutoff point for diagnosing cirrhosis. In all three cases, again random effect models of the ROC curve directly associated with specific cutoff points were used, allowing optimization of the Youden index as in single‐center ROC analyses. In addition, we used the same values across etiologies as long as this harmonization had only a minor effect on sensitivities and specificities.
Sensitivity, specificity, and diagnostic odds ratio (DOR) of the proposed cutoff points were then evaluated with random effect estimators. Furthermore, the hierarchical summary ROC approach of Reitsma et al.26 was calculated. Prediction failures according to the proposed cutoff points were analyzed with mixed effect univariate and multivariable logistic regression.
For a paired analysis of AUROCs of 2D‐SWE and TE, the method of DeLong et al.27 was used to estimate differences and standard error of the differences between the paired AUROCs at each site, and a random effect model was used to summarize the single estimates and obtain an overall P value and 95% confidence interval. As hepatitis B virus (HBV) patients may need different cutoff levels, analysis was stratified according to HBV and non‐HBV patients at the single sites. Risk of bias at the individual sites was optimized by using only TE results reported as successful measurements and which had an IQR/median ≤0.3. Furthermore, funnel plots were analyzed for asymmetries.
All statistical tests were two‐sided with a significance level of α = 5%. Analysis was performed with R (version 3.0.2; R Foundation for Statistical Computing, Vienna, Austria) using especially the meta package of Guido Schwarzer (version 4.1‐0), the coin package of Hothorn et al. (version 1.0‐23), the pROC package of Robin et al.28 (version 1.5.4), and the mada package of Philipp Doebler (version 0.5.4).
Results
A total of 1,134 patients from 13 clinical sites were included in the final analysis (Fig. 1). The 2D‐SWE data acquisition time spanned from February 2010 until July 2014. Additional data on TE were available in the majority of patients, of whom 665 had confirmed valid measurements (IQR/median <0.3). Main clinical characteristics are given in Table 1 and Supporting Table S1. Liver disease etiologies were categorized into chronic hepatitis C virus (HCV, n = 379) or HBV (n = 400) infection, nonalcoholic fatty liver disease (NAFLD, n = 156), and a group of “other liver diseases” (n = 199), where the latter mainly included patients with alcoholic liver disease. Figure 2 illustrates that there was a high diversity in the etiologies of liver diseases and in the prevalence of fibrosis stages among the different contributing centers (P < 0.001 in both comparisons).
Figure 1.
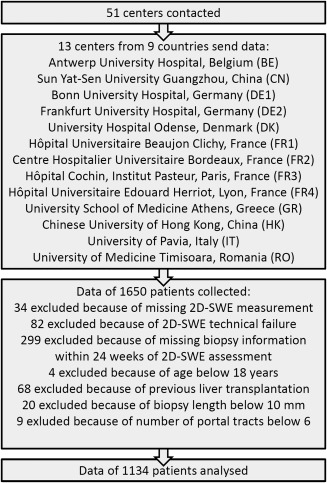
Flowchart of data collection and individual patient data selection.
Figure 2.
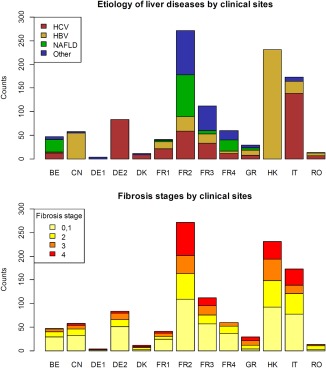
Illustration of the heterogeneity of the etiologies of liver diseases (upper panel) as well as of the prevalence of the different fibrosis stages (lower panel) between the clinical sites.
2D‐SWE MEASUREMENTS
There was a strong correlation between fibrosis stages and 2D‐SWE measurements (Supporting Fig. S1). Spearman rank correlation coefficients varied between 0.45 and 0.80 in all clinical sites, except for one sites with a small number of cases and a correlation coefficient of 0.27 (P < 0.001 for the overall correlation by a stratified permutation test using all centers).
DIAGNOSTIC PERFORMANCE OF 2D‐SWE
The diagnostic performance of 2D‐SWE was assessed with different random effect methods, which all account for the heterogeneity between the sites. See Supporting Fig. S2 for an illustration of this heterogeneity by showing ROC curves for each site. As assessment of risk of bias from small sites, we analyzed funnel plots of individual AUROC estimates. There were no indications of larger individual AUROCs in sites with small numbers of cases (data not shown). We estimated ROC curves and AUROC for diagnosing significant fibrosis, severe fibrosis, and cirrhosis, respectively. Diagnostic performances according to the AUROC values were good to excellent for the diagnosis of significant fibrosis and excellent for the diagnosis of severe fibrosis and cirrhosis. See Fig. 3 for more details including the AUROC values in the whole population as well as for the different liver disease etiologies.
Figure 3.
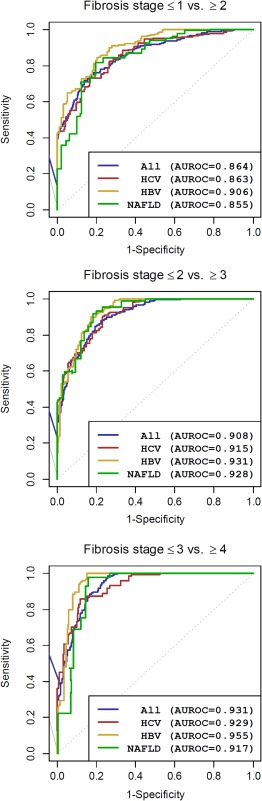
Summarized ROC curves and diagnostic performance by AUROC estimated using a random effect approach for all patients and for HCV, HBV, and NAFLD patients.
Some centers did not perform liver biopsy in patients with known liver cirrhosis from the patient's clinical history. We did not include these patients (n = 147), but excluding them may lead to focusing on less severe cirrhosis patients here. To analyze a potential bias, we performed an additional analysis including these patients and obtained AUROCs for diagnosing cirrhosis above 95% for all liver disease etiologies (results not shown).
When selecting suitable cutoff points, we focused on the differentiation between neighboring fibrosis stages to account for the ordinal scale. This data selection was only done in the context of cutoff point selection and not when evaluating them afterward. The optimized cutoff points as well as sensitivity, specificity, and DOR of the corresponding proposed cutoff points are shown in Table 2. The proposed cutoff points slightly differ from the optimal ones. In NAFLD patients, sample size was too low to reliably optimize cutoff values. Nevertheless, sample size was still large enough to show that 2D‐SWE results in the specific fibrosis stages in NAFLD patients were comparable to those in HCV patients. For all other patients, the proposed overall cutoff point for diagnosing significant fibrosis was 7.1 kPa, regardless of disease etiology. For diagnosing severe fibrosis and cirrhosis, a slightly lower cutoff point was found for patients infected with HBV (8.1 kPa and 11.5 kPa, respectively) compared to all other patients (9.2 kPa and 13.0 kPa, respectively). These cutoff points lead to estimated DORs of 7.3‐15.4 for significant fibrosis, 8.9‐18.6 for severe fibrosis, and 7.5‐37.5 for cirrhosis. Overall, diagnostic performance was better in HBV and HCV patients than in patients without viral hepatitis.
Table 2.
Evaluation of Cutoff Points for 2D‐SWE
| Fibrosis Stage | Estimates of Optimal Cutoff (kPa) | |||
|---|---|---|---|---|
|
All (n = 1,134) |
HCV (n = 379) |
HBV (n = 400) |
NAFLD (n = 156) |
|
| 0, 1 versus 2 | 8.25 | 7.095 | 6.95 | 7.15 |
| 2 versus 3 | 9.15 | 9.15 | 8.15 | 9.15 |
| 3 versus 4 | 9.89 | 13.3 | 10.90 | 11.0 |
| Proposed Cutoff (kPa) | |||||
|---|---|---|---|---|---|
| Other | HCV | HBV | NAFLD | ||
| ≤1 versus ≥2 | 7.1 | 7.1 | 7.1 | 7.1 | |
| Sensitivity (95% CI) | 94.8% (85.8%‐99.9%) | 94.7% (85.1%‐99.9%) | 87.6% (81.2%‐93.1%) | 93.8% (84.6%‐99.5%) | |
| Specificity (95% CI) | 39.9% (14.0%‐68.3%) | 52.0% (27.2%‐76.5%) | 73.6% (61.7%‐84.3%) | 52.0% (23.0%‐80.4) | |
| DOR (95% CI) | 7.3 (2.3‐22.7) | 15.4 (8.0‐29.5) | 13.9 (8.3‐23.1) | 12.1 (5.1‐28.6) | |
| ≤2 versus ≥3 | 9.2 | 9.2 | 8.1 | 9.2 | |
| Sensitivity (95% CI) | 95.1% (84.7%‐100%) | 90.3% (72.0%‐100%) | 94.9% (87.0%‐99.6%) | 93.1% (84.6%‐99.5%) | |
| Specificity (95%CI) | 86.6% (75.8%‐95.1%) | 76.8% (58.5%‐91.6%) | 73.1% (62.6%‐82.7%) | 80.9% (71.1%‐89.4%) | |
| DOR (95% CI) | 14.8 (6.5‐33.9) | 17.9 (5.5‐58.8) | 18.6 (10.3‐33.7) | 8.9 (2.8‐28.6) | |
| ≤3 versus 4 | 13.0 | 13.0 | 11.5 | 13.0 | |
| Sensitivity (95% CI) | 79.4% (61.0%‐94.0%) | 85.8% (74.0%‐95.1%) | 79.9% (41.4%‐100%) | 75.3% (45.2%‐97.5%) | |
| Specificity (95%CI) | 83.6% (62.5%‐98.2%) | 87.8% (72.5%‐98.1%) | 93.3% (87.6%‐97.6%) | 87.8% (78.0%‐95.5%) | |
| DOR (95% CI) | 7.5 (1.8‐31.8) | 37.5 (11.7‐120.4) | 22.5 (3.9‐128.9) | 9.6 (3.2‐28.4) | |
Abbreviation: CI, confidence interval.
The positive and negative predictive values and the overall correct classification rate could be estimated only indirectly as they depend on the prevalence of fibrosis stages. Assuming a prevalence of 22.1% significant fibrosis, 15.9% severe fibrosis, and 16.2% cirrhosis as in our total study population, the overall correct classification rates were 69.7%, 89.3%, and 82.9% for significant fibrosis, severe fibrosis, and liver cirrhosis, respectively. Analogously, the positive predictive value was estimated at 65.1%, 77.0%, and 48.3% and the negative predictive value at 86.7%, 97.4%, and 95.4%, respectively.
As an alternative method, a parametric hierarchical summary ROC analysis is shown in Supporting Table S2 and Fig. S3. In summary, sensitivities and, especially, specificities were less optimistic.
DISCORDANT CASES
In order to assess potential factors for prediction failure (discordant results between 2D‐SWE and liver biopsy as reference method), univariate and multivariable random effect logistic regression analyses were used (see Supporting Information). These analyses demonstrate that the respective factors when combined with 2D‐SWE prediction may lead to a slight but significant improvement of predicting significant fibrosis, severe fibrosis, or cirrhosis, respectively.
COMPARISON OF DIAGNOSTIC PERFORMANCE OF 2D‐SWE AND TE
Paired measurements of 2D‐SWE and TE were available in the majority of patients. The statistical analysis was restricted to the 665 patients with confirmed TE success and IQR/median <0.3 (Supporting Table S3 for patient characteristics of this subcohort which includes 271 patients with HCV, 206 with HBV, 91 with NAFLD, and 97 with other liver disease etiologies). In HCV, HBV, or NAFLD patients, AUROCs were 4.2%‐11.2% larger using 2D‐SWE for the diagnosis of significant fibrosis (absolute differences, P < 0.001 in HBV patients, P = 0.001 for combining data from all etiologies; Supporting Table S3). AUROCs were 1.4%‐12.8% larger using 2D‐SWE for the diagnosis of severe fibrosis (P = 0.003 in NAFLD patients, P = 0.035 for all patients). For the diagnosis of cirrhosis, AUROCs were about 1.4%‐6.7% larger using 2D‐SWE versus TE (P = 0.007 in HBV patients, P = 0.022 for all patients). In general, the gain in AUROC with 2D‐SWE when compared with TE was largest in HBV patients and smallest in HCV patients. More detailed data are given in Table 3. In all reported situations, the diagnostic performance of 2D‐SWE was better than that of TE even if the differences were mostly small and not significant in several subanalyses. Figure 4 shows the forest plots for the difference in AUROC between 2D‐SWE and TE for the different sites and the overall estimates in HBV and HCV patients. Although the largest HBV patient cohorts were from Asia, the European sites showed very comparable performance. Funnel plots did not show any indication of bias effects for sites with small sample sizes (data not shown).
Table 3.
Differences in AUROC (2D‐SWE–TE) With 95% Confidence Intervals and P Values in Patients With Paired Comparisons: Only Results From All Patients With Paired Measurements, Reported TE Success, and IQR <0.3 Median TE Are Shown
| Fibrosis Stage |
All Patients (n = 665) |
HCV Patients (n = 271) |
HBV Patients (n = 206) |
NAFLD Patients (n = 91) |
|---|---|---|---|---|
| ≤1 versus ≥2 |
5.3% 2.2% to 8.4% P = 0.001 |
4.2% −0.2% to 8.6% P = 0.063 |
11.2% 5.1% to 17.4% P < 0.001 |
6.4% −2.6% to 15.4% P = 0.162 |
| ≤2 versus ≥3 |
3.4 0.2% to 6.5% P = 0.035 |
1.4% −2.0% to 4.7% P = 0.424 |
5.5% −1.3% to 12.4% P = 0.115 |
12.8% 4.4% to 21.1% P = 0.003 |
| ≤3 versus 4 |
1.8% 0.3% to 3.4% P = 0.022 |
1.4% −0.6% to 3.4% P = 0.159 |
6.5% 1.7% to 11.3% P = 0.007 |
6.7% −3.0% to 16.3% P = 0.175 |
Figure 4.

Forest plots for the comparison of AUROC as a marker of diagnostic performance between 2D‐SWE and TE. Only results from patients with reported TE success and IQR <0.3 median TE in HCV patients and in HBV patients are shown. Abbreviations: CI, confidence interval; Diff, difference.
Discussion
Because of the known drawbacks of liver biopsy,4 noninvasive assessment of liver fibrosis is of increasing importance.
At present, the accuracy of 2D‐SWE for the noninvasive assessment of liver fibrosis was evaluated in studies including patients infected with chronic hepatitis C14, 17 or chronic hepatitis B19, 20 and in NAFLD patients29, 30 and studies pooling patients with different chronic liver diseases.15, 16, 19 Nevertheless, no results from a large‐scale multicenter study using liver biopsy as a reference are available. We performed a retrospective individual patient data meta‐analysis based on a data set of 1,134 patients. Nevertheless, just pooling the data would not be reasonable because of the heterogeneity between the clinical sites and different liver disease etiologies, which reflects different implicit or explicit inclusion and exclusion criteria at the single sites. Therefore, we assessed the diagnostic performance using refined statistical methods that account for the inherent heterogeneity. The large sample size also enabled us to perform subgroup analyses for single liver diseases and optimization of cutoff levels to estimate the different stages of liver fibrosis. Nevertheless, when comparing 2D‐SWE with TE in the present study, the limitation of its retrospective nature with partially incomplete information on examination quality and characteristics has to be considered. To account for this limitation, we only used TE assessments with reported success and IQR/median <0.3 for the comparisons.
In a previous study among 121 HCV patients with a liver biopsy as a reference method, 2D‐SWE demonstrated excellent diagnostic accuracies for all fibrosis stages (AUROC, 92%, 98%, and 98% for the diagnosis of significant fibrosis, severe fibrosis, and liver cirrhosis, respectively) and was superior to TE for the diagnosis of significant fibrosis.17 This corresponds reasonably well with our results with AUROCs of 86%, 92%, and 93% for the diagnosis of significant or severe fibrosis and liver cirrhosis in HCV patients, respectively. Overall, 2D‐SWE performed well and showed noninferior performance compared to TE in our study in this patient group.
More recent studies have evaluated 2D‐SWE in patients infected with chronic hepatitis B (n = 226 and n = 303) and revealed diagnostic accuracies according to AUROC levels of 88%‐92%, 93%‐95%, and 95%‐98% for significant fibrosis, severe fibrosis, and liver cirrhosis, respectively.19, 20 Again, this corresponds very well with our results, where AUROCs were 91%, 93%, and 96% for the diagnosis of significant fibrosis, severe fibrosis, and liver cirrhosis in HBV patients, respectively. In one study, 2D‐SWE was compared to TE, and the diagnostic accuracies were significantly superior to TE for all fibrosis stages.20 In our study, 2D‐SWE was also better than TE for the diagnosis of all fibrosis stages and significantly better for the diagnosis of significant fibrosis and liver cirrhosis (P < 0.001 and P = 0.007, respectively).
The assessment of liver fibrosis with elastographic methods in general can be challenging in NAFLD patients.30 Our data set was sparse in patients with NAFLD. A recent study enrolled 291 NAFLD patients and compared the performance of 2D‐SWE, TE, and virtual touch quantification using liver biopsy as a reference method.29 2D‐SWE had AUROCs of 86%, 89%, and 88% for the diagnosis of significant fibrosis, severe fibrosis and liver cirrhosis, respectively. This is slightly less favorable than the AUROCs of 86%, 93%, and 92% observed in our study in this patient group for the diagnosis of significant fibrosis, severe fibrosis, and liver cirrhosis, respectively. Nevertheless, 2D‐SWE results were, overall, comparable to those derived from TE in NAFLD patients in our subgroup as well as in the study of Cassinotto et al.29
In three previous studies including patients with mixed chronic liver disease with 170‐349 patients, diagnostic accuracies of 81%‐90%, 80%‐96%, and 85%‐99% were reported for significant fibrosis, severe fibrosis, and liver cirrhosis, respectively.15, 16, 18 We estimated AUROCs over all liver disease etiologies of 86%, 91%, and 93% for the diagnosis of significant fibrosis, severe fibrosis, and liver cirrhosis, respectively. While 2D‐SWE was superior to TE for the diagnosis of severe fibrosis in the larger study,15 it was equivalent in the smaller study.18 In our study, analyzing the whole patient group but stratifying for HBV and non‐HBV patients, 2D‐SWE was significantly better than TE for diagnosing significant fibrosis, severe fibrosis, and liver cirrhosis (P = 0.001, P = 0.035, and P = 0.022, respectively).
In NAFLD patients, sample size was too low to optimize cutoff values. For all other patients, we propose a cutoff value for diagnosing significant fibrosis of 7.1 kPa, a value for diagnosing severe fibrosis of 9.2 kPa in all but HBV patients, and a value of 8.1 in HBV patients. Furthermore, we propose a cutoff value for diagnosing cirrhosis of 13.0 kPa in all but HBV patients and 11.5 kPa in HBV patients. These values are, overall, similar to that proposed previously. It may simplify the noninvasive assessment of liver fibrosis with 2D‐SWE to choose identical cutoff values between most of the liver diseases and potentially prevent mistakes by ignoring the specific liver disease etiology. Nevertheless, according to the relatively low number of patients with NAFLD and the potentially suboptimal liver staging method in these patients, the cutoff values have to be evaluated in further multicenter trials in NAFLD patients.
Meanwhile, alternative 2D‐SWEs from other companies are on the market. However, the results and especially the cutoffs of the present study only account for 2D‐SWE based on supersonic shear imaging (Aixplorer).
When evaluating factors associated with discordant results of 2D‐SWE and the reference method, especially in NAFLD, clinical variables such as age, aspartate aminotransferase, alanine aminotransferase, and platelet counts were found to be significant. Nevertheless, refining prediction by including these factors has to be analyzed in a larger study with more homogeneous data.
Our individual patient data‐based meta‐analysis used patient data from 13 different sites to perform a larger‐scale analysis including optimization and evaluation of cutoff values for 2D‐SWE. Even though 2D‐SWE is a promising approach and this individual patient data meta‐analysis allows a more detailed assessment of the data when compared with literature‐based meta‐analyses, our study has, of course, limitations. There may be a risk of bias that the study was not based on a systematic literature review and mainly expert centers participated. Nevertheless, no small sample effect was observed. Further limitations are caused by the retrospective nature of this study and small patient numbers for some sites and etiologies. Also, the majority of HBV patients were from one site (HK), but the heterogeneity for HBV patients between sites is comparably small. Furthermore, we have only incomplete information about the quality of liver biopsy, the interval between liver biopsy and the 2D‐SWE assessment, the quality of the 2D‐SWE measurements themselves, technical failure rates, the experience of the examiners, as well as on quality parameters such as IQR and success rate for TE. Up to now, there has been limited information on recommendations for obtaining high‐quality 2D‐SWE measurements and the necessary number of acquisitions. First, evaluations show a favorable reproducibility.31, 32 A preliminary analysis of a subset of our data set with more detailed data on single acquisitions indicates that reliability is high even for single measurements. Overall, it may not be reasonable to apply the recommendations from TE to the assessment with 2D‐SWE. Further detailed analysis and future studies are needed to answer this important question.
In addition, we used liver biopsy as a reference method with liver histology read by local pathologists, which was transformed to a fibrosis staging with five stages. The latter is especially problematic in patients with NAFLD. Liver histology is well known to be prone to errors by itself. Overall, potentially lower quality of liver biopsy or 2D‐SWE assessments can be expected to lead to an underestimation of the true diagnostic performance of the evaluated noninvasive methods.4, 33 Technical failure rates of 2D‐SWE could not be analyzed here as the information is not included in the data set. Nevertheless, failure rates or unreliable results reported in the publications are not larger than for TE even in NAFLD patients.29
In the present study only the two elastographic methods, 2D‐SWE based on supersonic shear imaging and TE, were evaluated and compared. Nevertheless other ultrasound‐based elastographic techniques have been evaluated for the assessment of liver fibrosis as well as other noninvasive methods such as serum biomarkers, diffusion‐weighted computer tomography, and magnetic resonance elastography (MRE).5, 34 Meta‐analyses of point SWE using virtual touch quantification imaging reported diagnostic accuracies of 84%‐87% for the diagnosis of significant fibrosis (F≥2), 89%‐91% for the diagnosis of severe fibrosis (F≥3), and 92%‐93% for the diagnosis of liver cirrhosis (F = 4).35, 36 Meta‐analyses of MRE have reported diagnostic accuracies of 93%‐98% for the diagnosis of advanced liver fibrosis (F≥3) with sensitivities of 85%‐92% and specificities of 85%‐96%.37, 38 In addition, recent studies evaluating MRE in NALFD patients revealed a diagnostic accuracy of 88%‐92% for the diagnosis of significant fibrosis.39, 40, 41, 42 For diagnosing severe fibrosis, 3D‐MRE even reached 98% compared to 92% in 2D‐MRE in NAFLD patients.41 Comparison of MRE with diffusion‐weighted imaging showed superior results for MRE.37 However, only few studies have directly compared MRE to ultrasound‐based elastography and revealed comparable43 or superior44, 45 results of MRE to TE. In recent studies in patients with NAFLD, MRE was significantly better than TE and better than virtual touch quantification for the diagnosis of liver fibrosis.40, 42, 46 Direct comparison of 2D‐SWE with MRE showed similar diagnostic performance.47
In conclusion, 2D‐SWE has good to excellent performance for the noninvasive assessment of liver fibrosis in patients with hepatitis B. Further prospective studies are needed for head‐to‐head comparison between 2D‐SWE and other imaging modalities to establish disease‐specific appropriate cutoff points for assessment of fibrosis stage.
Author names in bold designate shared co‐first authorship.
Supporting information
Additional Supporting Information may be found at onlinelibrary.wiley.com/doi/10.1002/hep.29179/suppinfo.
Supporting Information 1
Potential conflict of interest: Dr. Ferraioli is on the speakers' bureau for Philips Medical Systems, Toshiba Medical Systems, and Hitachi Ltd. Dr. Filice is on the speakers' bureau for Philips Medical Systems and received grants from Esaote, Toshiba Medical Systems, and Hitachi Ltd. Dr. Pol consults, advises, is on the speakers' bureau, and received grants from AbbVie, Bristol‐Myers Squibb, MSD, Gilead, Janssen, and Roche. Dr. Thiele is on the speakers' bureau for SuperSonic Imagine. Dr. Criton is employed by Supersonic Imagine. Mr. Gay is employed by SuperSonic Imagine. Dr. de Ledinghen consults and received grants from SuperSonic Imagine. He is on the speakers' bureau for Echosens. Dr. Castera advises Echosens. Dr. Cohen‐Baerie is employed by Supersonic Imagine.
Part of this study was presented at the International Liver Congress 2015 in Vienna, Austria.
Supported by SuperSonic Imagine, in data collection and organization of study meetings.
REFERENCES
- 1. Lefton HB, Rosa A, Cohen M. Diagnosis and epidemiology of cirrhosis. Med Clin North Am 2009;93:787‐799. [DOI] [PubMed] [Google Scholar]
- 2. O'Leary JG, Lepe R, Davis GL. Indications for liver transplantation. Gastroenterology 2008;134:1764‐1776. [DOI] [PubMed] [Google Scholar]
- 3. Castera L, Negre I, Samii K, Buffet C. Pain experienced during percutaneous liver biopsy. Hepatology 1999;30:1529‐1530. [DOI] [PubMed] [Google Scholar]
- 4. Bedossa P, Dargere D, Paradis V. Sampling variability of liver fibrosis in chronic hepatitis C. Hepatology 2003;38:1449‐1457. [DOI] [PubMed] [Google Scholar]
- 5. Friedrich‐Rust M, Poynard T, Castera L. Critical comparison of elastography methods to assess chronic liver disease. Nat Rev Gastroenterol Hepatol 2016;13:402‐411. [DOI] [PubMed] [Google Scholar]
- 6. Castera L, Chan HLY, Arrese M; for the Clinical Practice Guideline Panel . EASL‐ALEH clinical practice guidelines: non‐invasive tests for evaluation of liver disease severity and prognosis. J Hepatol 2015; 63:237‐264. [DOI] [PubMed] [Google Scholar]
- 7. Bamber J, Cosgrove D, Dietrich CF, Fromageau J, Bojunga J, Calliada F, et al. EFSUMB guidelines and recommendations on the clinical use of ultrasound elastography. Part 1: Basic principles and technology. Ultraschall Med 2013;34:169‐184. [DOI] [PubMed] [Google Scholar]
- 8. Friedrich‐Rust M, Ong MF, Martens S, Sarrazin C, Bojunga J, Zeuzem S, et al. Performance of transient elastography for the staging of liver fibrosis: a meta‐analysis. Gastroenterology 2008;134:960‐974. [DOI] [PubMed] [Google Scholar]
- 9. Chon YE, Choi EH, Song KJ, Park JY, Kim DY, Han KH, et al. Performance of transient elastography for the staging of liver fibrosis in patients with chronic hepatitis B: a meta‐analysis. PloS One 2012;7:e44930. [DOI] [PMC free article] [PubMed] [Google Scholar]
- 10. Tsochatzis EA, Gurusamy KS, Ntaoula S, Cholongitas E, Davidson BR, Burroughs AK. Elastography for the diagnosis of severity of fibrosis in chronic liver disease: a meta‐analysis of diagnostic accuracy. J Hepatol 2011;54:650‐659. [DOI] [PubMed] [Google Scholar]
- 11. Talwalkar JA, Kurtz DM, Schoenleber SJ, West CP, Montori VM. Ultrasound‐based transient elastography for the detection of hepatic fibrosis: systematic review and meta‐analysis. Clin Gastroenterol Hepatol 2007;5:1214‐1220. [DOI] [PubMed] [Google Scholar]
- 12. Castera L, Foucher J, Bernard PH, Carvalho F, Allaix D, Merrouche W, et al. Pitfalls of liver stiffness measurement: a 5‐year prospective study of 13,369 examinations. Hepatology 2010;51:828‐835. [DOI] [PubMed] [Google Scholar]
- 13. Bercoff J, Tanter M, Fink M. Supersonic shear imaging: a new technique for soft tissue elasticity mapping. IEEE Trans Ultrason Ferroelectr Freq Control 2004;51:396‐409. [DOI] [PubMed] [Google Scholar]
- 14. Bavu E, Gennisson J‐L, Couade M, Bercoff J, Mallet V, Fink M, et al. Noninvasive in vivo liver fibrosis evaluation using supersonic shear imaging: a clinical study on 113 hepatitis C virus patients. Ultrasound Med Biol 2011;37:1361‐1373. [DOI] [PubMed] [Google Scholar]
- 15. Cassinotto C, Lapuyade B, Mouries A, Hiriart JB, Vergniol J, Gaye D, et al. Non‐invasive assessment of liver fibrosis with impulse elastography: comparison of supersonic shear imaging with ARFI and FibroScan®. J Hepatol 2014;61:550‐557. [DOI] [PubMed] [Google Scholar]
- 16. Deffieux T, Gennisson JL, Bousquet L, Corouge M, Cosconea S, Amroun D, et al. Investigating liver stiffness and viscosity for fibrosis, steatosis and activity staging using shear wave elastography. J Hepatol 2015;62:317‐324. [DOI] [PubMed] [Google Scholar]
- 17. Ferraioli G, Tinelli C, Dal BB, Zicchetti M, Filice G, Filice C. Accuracy of real‐time shear wave elastography for assessing liver fibrosis in chronic hepatitis C: a pilot study. Hepatology 2012;56:2125‐2133. [DOI] [PubMed] [Google Scholar]
- 18. Guibal A, Renosi G, Rode A, Scoazec JY, Guillaud O, Chardon L, et al. Shear wave elastography: an accurate technique to stage liver fibrosis in chronic liver diseases. Diagn Interv Imaging 2016;97:91‐99. [DOI] [PubMed] [Google Scholar]
- 19. Leung VY, Shen J, Wong VW, Abrigo J, Wong GL, Chim AM, et al. Quantitative elastography of liver fibrosis and spleen stiffness in chronic hepatitis B carriers: comparison of shear‐wave elastography and transient elastography with liver biopsy correlation. Radiology 2013;269:910‐918. [DOI] [PubMed] [Google Scholar]
- 20. Zeng J, Liu GJ, Huang ZP, Zheng J, Wu T, Zheng RQ, et al. Diagnostic accuracy of two‐dimensional shear wave elastography for the non‐invasive staging of hepatic fibrosis in chronic hepatitis B: a cohort study with internal validation. Eur Radiol 2014;24:2572‐2581. [DOI] [PubMed] [Google Scholar]
- 21. Goodman ZD. Grading and staging systems for inflammation and fibrosis in chronic liver diseases. J Hepatol 2007;47:598‐607. [DOI] [PubMed] [Google Scholar]
- 22. Brunt EM, Janney CG, Di Bisceglie AM, Neuschwander‐Tetri BA, Bacon BR. Nonalcoholic steatohepatitis: a proposal for grading and staging the histological lesions. Am J Gastroenterol 1999;94:2467‐2474. [DOI] [PubMed] [Google Scholar]
- 23. Muller M, Gennisson J‐L, Deffieux T, Tanter M, Fink M. Quantitative viscoelasticity mapping of human liver using supersonic shear imaging: preliminary in vivo feasibility study. Ultrasound Med Biol 2009;35:219‐229. [DOI] [PubMed] [Google Scholar]
- 24. Castera L, Forns X, Alberti A. Non‐invasive evaluation of liver fibrosis using transient elastography. J Hepatol 2008;48: 835‐847. [DOI] [PubMed] [Google Scholar]
- 25. Obuchowski NA. Estimating and comparing diagnostic tests' accuracy when the gold standard is not binary. Acad Radiol 2005;12:1198‐1204. [DOI] [PubMed] [Google Scholar]
- 26. Reitsma JB, Glas AS, Rutjes AW, Scholten RJ, Bossuyt PM, Zwinderman AH. Bivariate analysis of sensitivity and specificity produces informative summary measures in diagnostic reviews. J Clin Epidemiol 2005;58:982‐990. [DOI] [PubMed] [Google Scholar]
- 27. DeLong ER, DeLong DM, Clarke‐Pearson DL. Comparing the areas under two or more correlated receiver operating characteristic curves: a nonparametric approach. Biometrics 1988;44:837‐845. [PubMed] [Google Scholar]
- 28. Robin X, Turck N, Hainard A, Tiberti N, Lisacek F, Sanchez JC, et al. pROC: an open‐source package for R and S+ to analyze and compare ROC curves. BMC Bioinformatics 2011;12:77. [DOI] [PMC free article] [PubMed] [Google Scholar]
- 29. Cassinotto C, Boursier J, De Ledinghen V, Lebigot J, Lapuyade B, Cales P, et al. Liver stiffness in nonalcoholic fatty liver disease: a comparison of supersonic shear imaging, FibroScan and ARFI with liver biopsy. Hepatology 2016;63:1817‐1827. [DOI] [PubMed] [Google Scholar]
- 30. Petta S, Maida M, Macaluso FS, Di Marco V, Cammà C, Cabibi D, et al. The severity of steatosis influences liver stiffness measurement in patients with nonalcoholic fatty liver disease. Hepatology 2015;62:1101‐1110. [DOI] [PubMed] [Google Scholar]
- 31. Ferraioli G, Tinelli C, Zicchetti M, Above E, Poma G, Di Gregorio M, et al. Reproducibility of real‐time shear wave elastography in the evaluation of liver elasticity. Eur J Radiol 2012;81:3102‐3106. [DOI] [PubMed] [Google Scholar]
- 32. Hudson JM, Milot L, Parry C, Williams R, Burns PN. Inter‐ and intra‐operator reliability and repeatability of shear wave elastography in the liver: a study in healthy volunteers. Ultrasound Med Biol 2013;39:950‐955. [DOI] [PubMed] [Google Scholar]
- 33. Mehta SH, Lau B, Afdhal NH, Thomas DL. Exceeding the limits of liver histology markers. J Hepatol 2009;50:36‐41. [DOI] [PMC free article] [PubMed] [Google Scholar]
- 34. Talwalkar JA, Yin M, Fidler JL, Sanderson SO, Kamath PS, Ehman RL. Magnetic resonance imaging of hepatic fibrosis: emerging clinical applications. Hepatology 2008;47:332‐342. [DOI] [PubMed] [Google Scholar]
- 35. Friedrich‐Rust M, Nierhoff J, Lupsor M, Sporea I, Fierbinteanu‐Braticevici C, Strobel D, et al. Performance of acoustic radiation force impulse imaging for the staging of liver fibrosis: a pooled meta‐analysis. J Viral Hepat 2012;19:e212‐e219. [DOI] [PubMed] [Google Scholar]
- 36. Nierhoff J, Chavez Ortiz AA, Herrmann E, Zeuzem S, Friedrich‐Rust M. The efficiency of acoustic radiation force impulse imaging for the staging of liver fibrosis: a meta‐analysis. Eur Radiol 2013;23:3040‐3053. [DOI] [PubMed] [Google Scholar]
- 37. Wang QB, Zhu H, Liu HL, Zhang B. Performance of magnetic resonance elastography and diffusion‐weighted imaging for the staging of hepatic fibrosis: a meta‐analysis. Hepatology 2012;56:239‐247. [DOI] [PubMed] [Google Scholar]
- 38. Singh S, Venkatesh SK, Wang Z, Miller FH, Motosugi U, Low RN, et al. Diagnostic performance of magnetic resonance elastography in staging liver fibrosis: a systematic review and meta‐analysis of individual participant data. Clin Gastroenterol Hepatol 2015;13:440‐451. [DOI] [PMC free article] [PubMed] [Google Scholar]
- 39. Loomba R, Wolfson T, Ang B, Hooker J, Behling C, Peterson M, et al. Magnetic resonance elastography predicts advanced fibrosis in patients with nonalcoholic fatty liver disease: a prospective study. Hepatology 2014;60:1920‐1928. [DOI] [PMC free article] [PubMed] [Google Scholar]
- 40. Imajo K, Kessoku T, Honda Y, Tomeno W, Ogawa Y, Mawatari H, et al. Magnetic resonance imaging more accurately classifies steatosis and fibrosis in patients with nonalcoholic fatty liver disease than transient elastography. Gastroenterology 2016;150:628‐637. [DOI] [PubMed] [Google Scholar]
- 41. Loomba R, Cui J, Wolfson T, Haufe W, Hooker J, Szeverenyi N, et al. Novel 3D magnetic resonance elastography for the noninvasive diagnosis of advanced fibrosis in NAFLD: a prospective study. Am J Gastroenterol 2016;111:986‐994. [DOI] [PMC free article] [PubMed] [Google Scholar]
- 42. Park CC, Nguyen P, Hernandez C, Bettencourt R, Ramirez K, Fortney L, et al. Magnetic resonance elastography versus transient elastography in detection of fibrosis and noninvasive measurement of steatosis in patients with biopsy‐proven nonalcoholic fatty liver disease. Gastroenterology 2017;152:598‐607. [DOI] [PMC free article] [PubMed] [Google Scholar]
- 43. Bohte AE, de Niet A, Jansen L, Bipat S, Nederveen AJ, Verheij J, et al. Non‐invasive evaluation of liver fibrosis: a comparison of ultrasound‐based transient elastography and MR elastography in patients with viral hepatitis B and C. Eur Radiol 2014;24:638‐648. [DOI] [PubMed] [Google Scholar]
- 44. Ichikawa S, Motosugi U, Morisaka H, Sano K, Ichikawa T, Tatsumi A, et al. Comparison of the diagnostic accuracies of magnetic resonance elastography and transient elastography for hepatic fibrosis. Magn Reson Imaging 2015;33:26‐30. [DOI] [PubMed] [Google Scholar]
- 45. Huwart L, Sempoux C, Vicaut E, Salameh N, Annet L, Danse E, et al. Magnetic resonance elastography for the noninvasive staging of liver fibrosis. Gastroenterology 2008;35:299‐302. [DOI] [PubMed] [Google Scholar]
- 46. Cui J, Heba E, Hernandez C, Haufe W, Hooker J, Andre MP, et al. Magnetic resonance elastography is superior to acoustic radiation force impulse for the diagnosis of fibrosis in patients with biopsy‐proven nonalcoholic fatty liver disease: a prospective study. Hepatology 2016;63:453‐461. [DOI] [PMC free article] [PubMed] [Google Scholar]
- 47. Yoon JH, Lee JM, Joo I, Lee ES, Sohn JY, Jang SK, et al. Hepatic fibrosis: prospective comparison of MR elastography and US shear‐wave elastography for evaluation. Radiology 2014;273:772‐782. [DOI] [PubMed] [Google Scholar]
Associated Data
This section collects any data citations, data availability statements, or supplementary materials included in this article.
Supplementary Materials
Additional Supporting Information may be found at onlinelibrary.wiley.com/doi/10.1002/hep.29179/suppinfo.
Supporting Information 1