Abstract
Acetamide has been classified as a possible human carcinogen, but uncertainties exist about its levels in foods. This report presents evidence that thermal decomposition of N-acetylated sugars and amino acids in heated gas chromatograph injectors contributes to artifactual acetamide in milk and beef. An alternative gas chromatography/mass spectrometry protocol based on derivatization of acetamide with 9-xanthydrol was optimized and shown to be free of artifactual acetamide formation. The protocol was validated using a surrogate analyte approach based on d3-acetamide and applied to analyze 23 pasteurized whole milk, 44 raw sirloin beef, and raw milk samples from 14 different cows, and yielded levels about 10-fold lower than those obtained by direct injection without derivatization. The xanthydrol derivatization procedure detected acetamide in every food sample tested at 390 ± 60 ppb in milk, 400 ± 80 ppb in beef, and 39 000 ± 9000 ppb in roasted coffee beans.
Keywords: analytical artifacts, food safety, method validation, N-acetylated sugars, surrogate analyte validation, thermal degradation, acetamide
Introduction
Acetamide is a simple amide with the chemical formula CH3CONH2 formed by dehydration of ammonium acetate, hydrolysis of acetonitrile,1,2 or ammonolysis of acetate esters from plant cell walls.3,4 Acetamide has been classified by the International Agency for Research on Cancer (IARC) as a Group 2B possible human carcinogen,5 as feeding trials on rats have shown an increase in liver carcinoma.6,7 The simplicity of the molecule suggests that it may be formed naturally or as a byproduct of other processes. Acetamide has been found in tobacco smoke,8 industrial water,9 and in beef and poultry liver.10,11 Two previous studies measured acetamide in milk to determine exposure due to insecticides (thiodicarb and methomyl) and surprisingly found acetamide in the milk of control animals as well.10−12 Furthermore, measured acetamide levels in controls varied greatly between the two tests: in the methomyl test, it ranged from 2–8 ppm in milk, while it was only 0.3–0.5 ppm in the thiodicarb study. Both tests used gas chromatography (GC) to measure the acetamide in milk, but neither report described the method validation in detail.
Artifacts may be anticipated during GC analysis of acetamide in foods and particularly in milk because of the abundance of N-acetylated (or acetamido) moieties on sugars, amino acid metabolites, and proteins. Commonly occurring N-acetylated compounds include the monosaccharides N-acetylglucosamine and N-acetylneuraminic acid (commonly known as sialic acid) and acetylated amino acids such as N-acetylcysteine. Furthermore, abundant glycoproteins in milk including κ-casein and lactoferrin also contain N-acetyl sugars.13 A 2001 report14 measured N-acetylglucosamine and N-acetylgalactosamine in milk following brief ultrahigh temperature (∼5 s at ∼150 °C) pasteurization and found combined levels of approximately 100 ppm. These N-acetylated compounds are potential sources of artifacts in acetamide analysis by releasing acetamide. Further support for this idea comes from a recent NMR investigation of products released from roasting chicory root, which demonstrated that levels of acetamide were dramatically increased upon roasting to levels detectable using NMR spectroscopy.15
One may postulate that the presence of acetamide in milk as well as the discrepancy between the thiodicarb and methomyl studies arises from the thermal breakdown of endogenous N-acetylated metabolites and glycans into acetamide and the parent sugar molecule during vaporization of milk extracts.16 For example, Köll et al.17 found that acetamide was the main volatile degradation product resulting from the thermal decomposition of chitin, a polymer of N-acetylglucosamine. Thermal degradation commenced at 200 °C, below the boiling point of acetamide (221 °C). These results suggest that in hot (>200 °C) GC injectors, N-acetylated compounds decompose to form acetamide and thus obscure accurate quantitation of native acetamide.
Alternatives to hot GC injection have been considered but can often result in other disadvantages. In liquid chromatography, acetamide has low electrospray ionization efficiency, and it is challenging to retain and separate acetamide from a complex mixture using reverse-phase HPLC columns. Elias et al. used HPLC-UV to quantitate acetamide in hydrogeothermal waters.18 Although the reported detection limit for acetamide was low (7.7 ppb), acetamide peaks were broad and showed minimal separation from other analytes in a water matrix, which is considered less complex than food extracts. Furthermore, our initial investigations detected trace levels of acetamide as a contaminant in HPLC-grade acetonitrile, and this finding steered us away from using LC/mass spectrometry (MS) for its analysis. To prevent possible artifact formation from thermal degradation, Diekmann et al.8 used on-column (also known as cool-on-column) injection GC/MS for measuring acetamide and acrylamide in cigarette mainstream smoke. Cool-on-column injection is not applicable to all samples. In cool-on-column injection, everything in the extracts is introduced into the column, and thus, complex matrixes have the potential to degrade chromatographic performance. Extracts of food matrixes probably need extensive cleanup before injection to minimize irreproducibility and avoid long analysis times.
One approach to reduce matrix effects and artifacts in direct GC injection is to derivatize acetamide before injection. In 2013, Cho and Shin19 successfully used derivatization with 9-xanthydrol to measure acetamide in drinking water. 9-Xanthydrol has also been used to derivatize acrylamide20 in processed foods such as potato chips.21,22 9-Xanthydrol reacts with acetamide in aqueous solutions at mildly acidic conditions and forms xanthyl-acetamide, which can be detected and quantitated using hot GC injection.
In this manuscript, we assess the suitability of 9-xanthydrol derivatization and direct GC/MS injection to measure acetamide in food matrixes, particularly milk and beef. The method was compared to direct GC/MS injection without derivatization. We also performed experiments to evaluate whether this protocol generates artifactual acetamide from N-acetylated compounds. Using this method, we demonstrate the abundance of acetamide in milk and beef products marketed in the United States.
Materials and Methods
Reagents and Stock Solutions
Acetamide, d3-acetamide, propionamide, 9-xanthydrol, and methanol were purchased from Sigma-Aldrich (St. Louis, MO). Ethyl acetate and hexane were purchased from Fisher Chemicals (Fair Lawn, NJ). Sodium chloride and acetone were purchased from Macron Fine Chemicals (Center Valley, PA). Acetone was confirmed by GC/MS to be free of detectable acetamide.
Water was prepared using a Millipore Milli-Q purification system, and hydrochloric acid was purchased from EMD Millipore (Burlington, MA).
HCl solution (0.5 M) was prepared in methanol by adding 8.25 mL of HCl stock solution (12.1 M) to 191.75 mL methanol in a 200 mL volumetric flask. KOH solution (0.7 M) was prepared by dissolving 0.39 g of KOH in 10 mL water. 9-Xanthydrol solution (5%) was prepared by dissolving 2.5 g of 9-xanthydrol in 50 mL of methanol. Stock solutions of acetamide, propionamide, and d3-acetamide were prepared in methanol at 1 g/L by dissolving 10 mg of the chemicals in 10 mL of methanol. Working solutions (10, 50, and 100 ppm) of each chemical were prepared by dilution of 1 g/L stock solution accordingly.
Milk, Meat, and Coffee Samples
Twenty-three pasteurized whole milk and 44 raw sirloin beef samples were purchased from different grocery stores within Michigan, United States. In addition, raw, unprocessed milk was collected from 14 individual cows over a period of 4 weeks. Samples were stored in centrifuge tubes in a freezer (below −20 °C) until analysis (within 2–3 d of collection).
Coffee samples were purchased from different stores in Michigan and were comprised of 18 different varieties of roasted coffee beans, 3 varieties of green (raw) coffee beans, and 8 varieties of instant coffee.
Preparation of Standards and Calibration Curves
Standards for calibration curves were prepared by spiking matrix (milk, coffee, and beef) with d3-acetamide as the surrogate analyte and propionamide as the internal standard. The surrogate analyte d3-acetamide was used to account for the variable and nonzero presence of native acetamide in food matrixes. Neither d3-acetamide nor propionamide were detected in all unspiked food matrixes tested. For milk analysis, standards were prepared by spiking 9.0 mL milk with 0.0, 0.1, 0.25, 0.5, 1.0, 2.5, and 5.0 μg/mL of d3-acetamide as surrogate analyte and 0.5 μg/mL of propionamide as internal standard. The spiked milk samples were processed and derivatized as described below. Linear calibration curves based on equal weighting were then prepared from responses of xanthyl-d3-acetamide (relative peak areas of xanthyl-d3-acetamide to xanthyl-propionamide) on the spiked concentration of d3-acetamide. For beef analyses, standards were prepared by spiking 5 g of raw beef with 0.0, 0.1, 0.25, 0.5, 1.0, 2.5, and 5.0 ppm of d3-acetamide as surrogate analyte and 0.5 ppm of propionamide as internal standard. The spiked beef samples were processed using the extraction and derivatization protocol.
For analysis of coffee samples, standards were prepared by spiking 9.0 mL of aqueous coffee bean extract with 0.0, 0.1, 0.25, 0.5, 1.0, 2.5, and 5.0 μg/mL of d3-acetamide as surrogate analyte and 0.5 μg/mL of propionamide as internal standard. The spiked coffee samples were processed using the extraction and derivatization protocol.
Calibration curves were then prepared from dependence of responses of xanthyl-d3-acetamide as the surrogate analyte (relative peak areas of xanthyl-d3-acetamide to xanthyl-propionamide) on the spiked concentration of d3-acetamide. Slopes for the calibration curves were approximately 0.64/ppm for milk, 0.59/ppm for beef, and 0.42/ppm for coffee, respectively. Regression coefficients of the calibration curves were all greater than 0.98.
Derivatization Procedure
A 9.0 mL aliquot of milk was spiked with internal standard (100 μL from a 50 ppm stock solution of propionamide), and 900 μL of water was added to each milk sample in 15 mL polypropylene centrifuge tubes. Tubes were centrifuged at 16 420g for 10 min, and the fat layer on top was removed. A 5 mL volume of the defatted milk was then transferred to a new 15 mL tube, and 5 mL of 0.5 M HCl solution was added to precipitate proteins. Tubes were centrifuged as before, and 5 mL of the supernatant was transferred to new tubes, followed by addition of 200 μL of 9-xanthydrol solution in methanol (5%). Tubes were incubated at 40 °C for 1.5 h, after which 2 mL of 0.7 M KOH solution, 3 g of NaCl, and 3 mL of ethyl acetate were added in turn. Tubes were vortexed and centrifuged, and 1.5 mL of the ethyl acetate phase was transferred to a 2 mL microcentrifuge tube. Ethyl acetate was evaporated to dryness using a SpeedVac and analytes were dissolved in 150 μL of ethyl acetate. Microcentrifuge tubes were vortexed and then centrifuged at 20 817g for 10 min. A 100 μL aliquot of the supernatant was transferred to vials for GC/MS analysis.
Raw beef samples were ground using a meat grinder, frozen by immersion in liquid nitrogen, and processed using a Ninja blender. Five grams of the homogenized beef were placed in 50 mL polypropylene centrifuge tubes, and 3 mL of water, 11.95 mL of methanol, and 50 μL of 50 ppm propionamide solution were added to each tube. Samples were then shaken for 2 h at 50 °C. After 2 h, tubes were centrifuged at 8045g for 10 min. Supernatants were transferred to new tubes, and 15 mL of hexane was added to remove lipids. Tubes were vortexed and centrifuged, hexane layers were removed, and the lower layer was placed in a −80 °C freezer overnight for protein precipitation. The next day, samples were thawed at room temperature and centrifuged, and supernatant was used for the derivatization. The supernatant (1.2 mL), 50 μL of 1 M HCl, and 200 μL of 5% 9-xanthydrol solution were then added to 2 mL microcentrifuge tubes and incubated at 40 °C for 2.5 h with shaking. Solvents were evaporated from the tubes using a SpeedVac. An 800 μL volume of saturated NaCl in water, 60 μL of 0.7 M KOH, and 800 μL of ethyl acetate were added in turn to each tube. Tubes were vortexed for 3 min using a multitube vortexer. A 500 μL aliquot of the ethyl acetate layer was transferred to a new tube, and another 800 μL of ethyl acetate was added to the original tube for a second extraction. This time, 700 μL of the ethyl acetate was removed and added to the initial 500 μL. Ethyl acetate then was evaporated using a SpeedVac system, and analytes were dissolved in 100 μL of ethyl acetate. Tubes were centrifuged, and 60 μL of the supernatant were transferred to GC/MS vials with glass inserts for GC/MS analysis.
Finely ground coffee bean samples (12 g) were Soxhlet extracted with 250 mL of water for 16 h. The resulting extract was used for the derivatization procedure. Instant coffee samples (4 of which were preportioned by the manufacturer) ranged from 4.0–6.6 g and were each dissolved in 250 mL of boiling water. The resulting matrix was used for the derivatization procedure. A 9.0 mL aliquot of coffee was spiked with internal standard (100 μL from a 50 ppm stock solution of propionamide), and 900 μL of water was added to each coffee sample in 15 mL polypropylene centrifuge tubes. Tubes were centrifuged at 16 420g for 10 min. A 5 mL volume of the coffee supernatant was then transferred to a new 15 mL tube, and 5 mL of 0.5 M HCl solution was added. Tubes were centrifuged as before, and 5 mL of the supernatant was transferred to new tubes, followed by addition of 200 μL of 9-xanthydrol solution in methanol (5%). Tubes were incubated at 40 °C for 1.5 h, after which 2 mL of 0.7 M KOH solution, 3 g of NaCl, and 3 mL of ethyl acetate were added in turn. Tubes were vortexed and centrifuged, and 1.5 mL of the ethyl acetate phase was transferred to a 2 mL microcentrifuge tube. Ethyl acetate was evaporated to dryness using a SpeedVac, and analytes were dissolved in 150 μL of ethyl acetate. Microcentrifuge tubes were vortexed and then centrifuged at 20 817g for 10 min. A 100 μL aliquot of the supernatant was transferred to vials for GC/MS analysis.
GC/MS Method
GC/MS analyses were carried out using a 7890A GC system equipped with 7683 autosampler and interfaced to a 5973C single quadrupole mass spectrometer (Agilent, Santa Clara, CA). The capillary column used for separation of xanthyl derivatives was a 30 m × 0.25 mm i.d., 0.25 μm film VF5 with 10 m EZ guard (Agilent, Santa Clara, CA). The capillary column used for quantitation of acetamide (no derivatization) was a 30 m × 0.25 mm i.d., 0.25 μm film DB-WAX (Agilent, Santa Clara, CA). Helium was used as the carrier gas. For the 9-xanthydrol derivatization method, the flow rate was set at 1.2 mL/min. Injection volume was 1.0 μL using split mode (1:8) at 240 °C with the following temperature profile: initial column temperature: 40 °C and hold for 2 min; increase to 300 °C at 20 °C/min and hold for 15 min. The total run time was 40 min per sample. The mass spectrometer was operated in electron ionization (EI) mode at 70 eV. The analytes were detected using selected ion monitoring (SIM) mode for the molecular ions (m/z 239, 242, and 253 for xanthyl-acetamide, xanthyl-d3-acetamide, and xanthyl-propionamide, respectively). The dwell time for each channel was 120 ms. For initial compound characterizations, the mass spectrometer was operated in full scan mode (m/z 30–400).
For measurements of acetamide without derivatization, the carrier flow rate was set at 1.5 mL/min. Splitless injection of 1.0 μL was made at 240 °C with the following column temperature profile: initial column temperature at 50 °C and hold for 1 min; increase to 250 °C at 15 °C/min, and hold for 2 min. The total run time was 16.3 min/sample. The mass spectrometer was operated in EI mode at 70 eV. The analytes were detected using SIM of molecular ions m/z 59 and 62 for acetamide and d3-acetamide, respectively. For initial compound characterization, the mass spectrometer was operated in full scan mode (m/z 30–400) to generate full EI mass spectra.
Results and Discussion
Artifactual Acetamide Formation During GC/MS
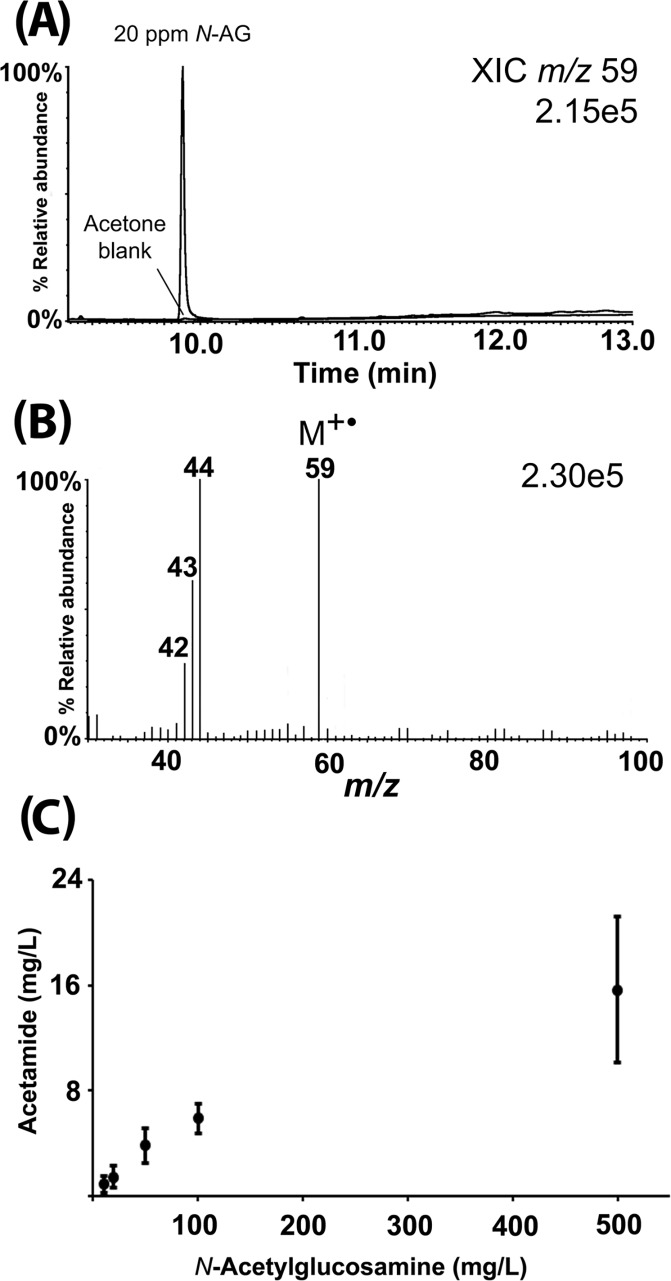
To evaluate artifactual formation of acetamide from N-acetylated compounds, we injected solutions of selected N-acetylated compound standards (at various concentrations) directly into the heated injector (240 °C) for GC/MS analysis. Compounds injected were N-acetylglucosamine, sialic acid, N-acetylcysteine, and two trisaccharides: 3-sialyllactose (one of the most abundant sugars in bovine milk and colostrum) and 6-sialyl-N-acetyllactosamine. As anticipated, we detected acetamide in each of the samples, thereby demonstrating artifactual formation of acetamide via thermal degradation. Illustrative data for N-acetylglucosamine are shown in Figure 1. On a molar basis, approximately 15–20% of each precursor was converted to acetamide. On the basis of these observations, we expect artifactual detection of acetamide when milk or beef extracts are analyzed using direct-injection GC/MS because N-acetylated compounds persist even after sample processing.
Figure 1.
Illustration of artifactual formation of acetamide from N-acetylglucosamine during GC/MS analysis. (A) Appearance of an acetamide peak in the chromatogram when a 20 ppm standard solution of N-acetylglucosamine was injected directly into the heated injector of the GC/MS. The acetone blank is shown for comparison. (B) EI mass spectrum of the peak from panel A, confirming that the peak is acetamide. (C) Amount of acetamide generated via thermal degradation when N-acetylglucosamine is injected into a heated injector of the GC/MS at 10, 20, 50, 100, and 500 ppm. Error bars show standard deviations for three separate samples prepared at the same concentrations.
Approaches to Circumvent Artifacts in Acetamide Analysis
To minimize artifacts, we tried several approaches that proved to be unsuccessful:
We performed cool-on-column injection into the GC/MS to circumvent artifactual formation of acetamide. In this technique, the milk extract was injected directly into the column at 50 °C instead of 240 °C. Although this technique eliminated the breakdown of N-acetylated compounds in the GC inlet, the method proved impractical because the acetamide peak became broader following multiple injections of milk extract, and components in the milk acetone extract plugged the column after only a few samples. We also evaluated a purge-and-trap technique in which acetamide is purged from the solution into the vapor phase using helium at up to 70 °C. Acetamide was first adsorbed from the vapor phase onto a sorbent and then thermally desorbed onto the GC column. In principal, this technique could have avoided interference from N-acetylated compounds due to their low vapor pressure, but the technique proved impractical due to an unacceptably low purge efficiency (less than 5%) of acetamide.
Artifacts may be eliminated if acetamide is separated from other interfering compounds before GC/MS analysis. We tested this approach using phenylboronic acid (PBA) resins to covalently bind to sugars, which could remove N-acetylated sugars from the sample prior to GC/MS injection. However, the high levels of lactose in milk overloaded the resin, making this approach infeasible. A membrane nanofiltration technique to remove sugars was also not successful for the same reason. Charcoal and other sorbents also failed to selectively adsorb the N-acetylated sugars.
The most promising method to date exploited derivatizing acetamide using 9-xanthydrol, a derivatizing reagent that was previously used for successful analysis of acrylamide in food matrixes21,22 and to detect acetamide in environmental water samples21 where matrix effects were less severe than for milk and beef. Our experiments, described below, showed that the 9-xanthydrol derivatization method was successful for analyzing acetamide in milk and beef, two matrixes considered likely to present high concentrations of N-acetylated compounds. An overview of the 9-xanthydrol derivatization reaction is shown in Figure 2.
Figure 2.
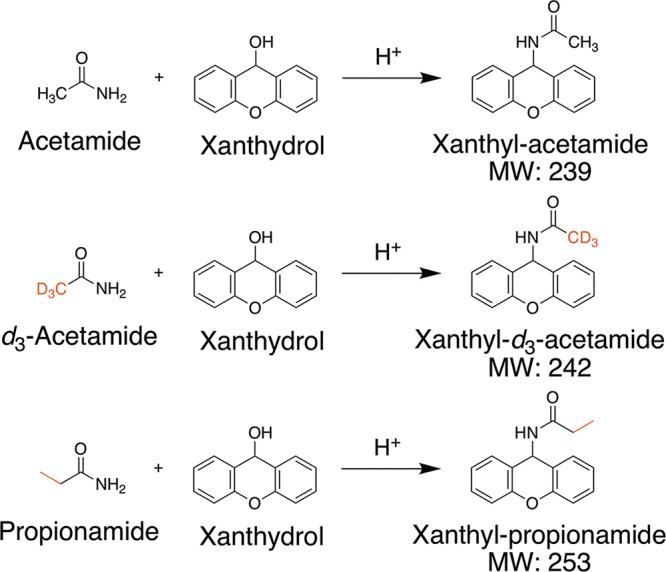
Overview of the 9-xanthydrol derivatization principle.
Excess 9-xanthydrol was added to sample containing acetamide. Derivatization proceeded at 40 °C at pH < 2 for at least 1.5 h, during which xanthyl-acetamide was produced. Deuterated acetamide and propionamide were used as the reference standard and internal standard, respectively. Prior to derivatization, fats and proteins were removed from the extracts by differential solubility.
Derivatization
The derivatization reaction between 9-xanthydrol and amides requires acidic conditions and mild temperatures and occurs in aqueous solution. We found that the important parameters affecting the reaction yield are temperature, reaction time, and the amount of 9-xanthydrol. This is consistent with findings of Casal et al., who optimized the derivatization conditions through a statistical design for derivatizing acrylamide in French fry extract.22 Cho and Shin19 showed that increasing 9-xanthydrol concentration from 2 to 10 mM increased the reaction yield between acetamide, propionamide, and butyramide with 9-xanthydrol in water. They also showed that an increase in temperature from 30 to 70 °C had an adverse effect on the reaction yield. In another study on acrylamide, Shin and Lim20 showed that an increase in reaction time from 5 to 40 min increased reaction yield only at 20 °C and not at 40, 60, or 80 °C. We found that the reaction between 9-xanthydrol and acetamide under acidic conditions had 15–20% higher yield and improved reproducibility at 40 °C compared to room temperature (25 °C). We recommend that the derivatization temperature be controlled for reproducibility. Casal et al.21 and Urushiyama et al.22 used 40 °C for 50 min for acrylamide derivatization in food extract. Xanthyl-amides showed 15–20% higher yield when we increased the reaction time to 1.5 h for milk and 2.5 h for beef.
We increased the volume of xanthydrol solution (5% in methanol) added to both beef and milk extracts from 50 μL to 2 mL for milk and from 50 to 250 μL for beef extract. Xanthyl-amide peak areas increased when adding more 9-xanthydrol solution up to 200 μL. Reaction conditions were optimized for integrated GC/MS peak areas subject to volume limitation of 2 mL microcentrifuge tubes, with best results obtained at 200 μL of 9-xanthydrol solution for both milk and beef.
Reaction yield was not affected by the concentration of HCl as long as the pH was below two. We also kept the reaction in the dark, as suggested by Cho and Shin19 by covering the incubator door during the reaction time and by transferring derivatized products to amber GC/MS vials.
GC/MS Detection of Xanthyl-Amides
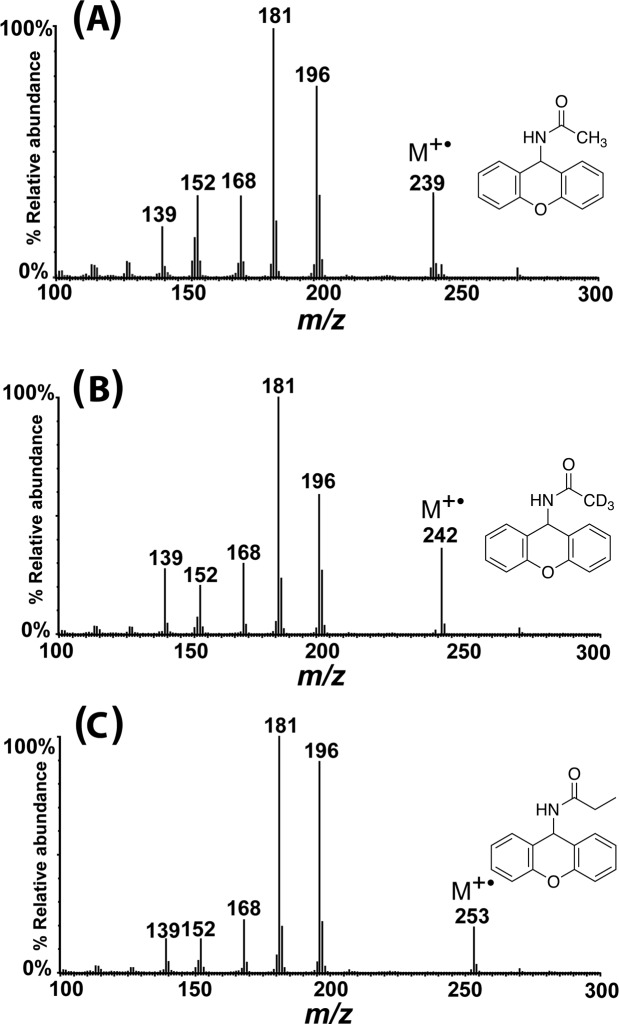
The EI mass spectra of xanthyl-amides are presented in Figure 3.
Figure 3.
EI mass spectra of xanthyl-acetamide, xanthyl-d3-acetamide, and xanthyl-propionamide from a derivatized milk sample previously spiked with 0.5 ppm each of d3-acetamide and propionamide prior to derivatization.
Molecular ions (M+•) were observed in mass spectra for each of the xanthyl-amides. Detection of the analytes was performed using SIM for corresponding molecular ions at m/z 239, 242, and 253 for xanthyl-acetamide, xanthyl-d3-acetamide, and xanthyl-propionamide, respectively. Confirmation of each analyte was based on common fragment ions at m/z 196 (M+•-COR) and ions at m/z 181, 168, and 152, all from fragmentation of the 9-xanthydrol. The main differences among the EI mass spectra of the xanthyl-amides are the masses of the molecular ions.
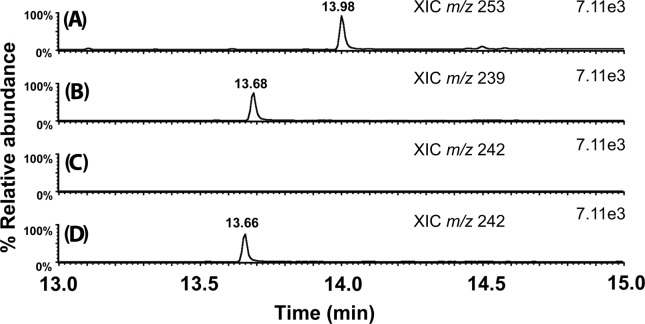
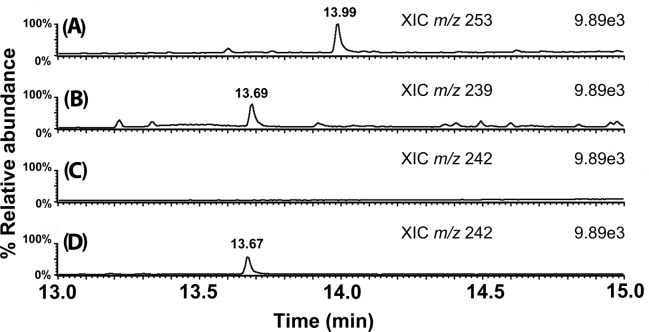
Xanthyl-amide peaks eluted between 13 and 14 min. Figure 4 shows the extracted ion chromatograms of xanthyl-amides from a derivatized market milk sample. Xanthyl-acetamide comes from the acetamide present in milk, and xanthyl-propionamide is the internal standard spiked into milk before derivatization. Figure 4C also shows no peak for m/z 242, corresponding to xanthyl-d3-acetamide, was detected in the milk extract after derivatization. One of the benefits of 9-xanthydrol derivatization is that it creates analytes with high molecular weights relative to acetamide and therefore shifts the masses upward to where there is less interference from underivatized components of the matrix. Figure 4D shows the m/z 242 chromatogram when the milk sample was spiked with 250 μg/kg d3-acetamide before derivatization. Figure 5 shows similar extracted ion chromatograms from a derivatized market beef (sirloin) sample.
Figure 4.
Example GC/MS extracted ion chromatograms from a derivatized market milk sample: (A) internal standard xanthyl-propionamide (m/z 253), (B) xanthyl-acetamide (m/z 239), (C) xanthyl-d3-acetamide (m/z 242), which was not added or detected, and (D) xanthyl-d3-acetamide in the same market milk sample after spiking with 250 ppb d3-acetamide before derivatization with 9-xanthydrol. All peaks are normalized to the same highest ion count (internal standard) to facilitate comparison.
Figure 5.
Example GC/MS extracted ion chromatograms from a derivatized market beef (sirloin) sample. (A) Chromatogram showing the peak of internal standard; xanthyl-propionamide (m/z 253); (B) chromatogram showing the peak for xanthyl-acetamide (m/z 239); (C) chromatogram showing the peak for xanthyl-d3-acetamide (m/z 242); and (D) chromatogram showing xanthyl-d3-acetamide in the same market beef sample spiked with 250 ppb d3-acetamide before derivatization with 9-xanthydrol. All peaks are normalized to the highest ion count (internal standard) to facilitate comparison.
To demonstrate that N-acetylated sugars do not decompose and generate acetamide under the reaction conditions, pure standards of sialic acid and N-acetylglucosamine at concentrations of 50–500 ppm were derivatized, and no xanthyl-acetamide peak was detected (detection limit was approximately 20 ppb). These results confirmed that N-acetylated compounds do not degrade during the derivatization procedure, and therefore, the method successfully circumvents artifactual formation of acetamide from these substances.
Surrogate Analyte Approach
Using xanthydrol derivatization, we found that acetamide is endogenously present at a range of 200–700 ppb in all beef and cow milk samples analyzed. Because all milk and beef samples tested positive for acetamide, no acetamide-free matrix was available for method validation, and a surrogate analyte approach was taken. The concept of using a surrogate analyte is to calculate the sample concentration of an endogenous analyte based on the regression equation from the stable isotope labeled standard spiked in matrix. In this approach, the isotope-labeled analyte functions not as an internal standard but as a surrogate analyte.23,24
For method validation, d3-acetamide was spiked in milk and beef at various concentrations for generating a calibration curve, and propionamide was used as an internal standard. When using a surrogate analyte, the ratio of the peak areas of analyte (xanthyl-acetamide) and surrogate analyte (xanthyl-d3-acetamide) must be assessed for equivalent response ratios (RR1) and compared to the response ratio of the internal standard (RR2). The ratio RR1 is factored in when calculating the final concentration of the analyte.
The following calculations must be used for calculating the concentration of analyte:
Where a is the slope and b is the intercept of the calibration regression line. Final concentration of acetamide in the sample (which is calculated based on the xanthyl-acetamide) is calculated based on the following equation:
We compared the response ratios of xanthyl-acetamide and xanthyl-d3-acetamide at 5 different concentrations (0.1, 0.25, 0.5, 1.0, 2.5, and 5.0) with 2 replicates each. The mean value for RR1 was 1.01 (range 0.96–1.07) showed that acetamide and d3-acetamide yielded the same response without significant isotope effects. A paired Student’s t-test was performed on the normalized peak areas of xanthyl-acetamide and xanthyl-d3-acetamide, and the p-value was determined to be 0.81. On the basis of the p-value, the response ratios of the labeled and unlabeled acetamide derivatives are concluded to be indistinguishable across the calibration range.
Validation of the 9-Xanthydrol Derivatization GC/MS Method
The 9-xanthydrol derivatization GC/MS method was validated separately for measuring of acetamide in milk and beef. Validation was based on the United States Food and Drug Administration guidelines that are used in residue depletion studies.25 Six different market milk samples were picked for this three-day study. Each day, milk samples were spiked with d3-acetamide at 6 different concentrations (0.0, 0.08, 0.25, 0.6, 1.2, and 2.5 ppm). For each concentration, three random samples were selected. Therefore, 18 milk samples were prepared, derivatized and analyzed each day for three consecutive days, for a total of 54 samples. Spiked d3-acetamide was measured against a calibration curve and final numbers were used to calculate different parameters to validate the method. The same validation procedure was followed for beef. Retention time differences between xanthyl-amide peaks prepared and derivatized in pure solvents and xanthyl-amide peaks from derivatized milk or beef for all the tested samples were less than 0.2% which confirms that retention is unaffected by sample matrix.
LOD and LOQ were determined using the FDA procedure.25 A linear regression was performed for the concentrations measured versus concentrations added (total of 54 data points) graph. Upper and lower 5% confidence interval limit lines were created around the regression line, and LOD and LOQ were calculated based on those. LOD and LOQ were determined to be 10 and 19 ppb for acetamide in milk and 11 and 23 ppb for acetamide in beef.
Comparison of Direct vs After-Derivatization GC/MS Quantitation of Acetamide
Acetamide was measured in a market milk and a market beef sirloin sample using two different protocols; the direct GC/MS method (heated injection), which used methanol extracts of milk and beef (no other processing), and the 9-xanthydrol derivatization method. As anticipated, we found a significant discrepancy in acetamide levels. The direct injection method yielded an average of 5.5 ppm in milk and 3.9 ppm in beef compared to 0.32 ppm in milk and 0.45 ppm in beef for the 9-xanthydrol derivatization method (Figure 6). This finding suggests that acetamide detected using direct injection GC/MS method overestimates the true levels in milk and beef by an order of magnitude, with about 90% of what is measured as acetamide using heated direct injection GC/MS attributable to thermal degradation of other N-acetyl compounds.
Figure 6.
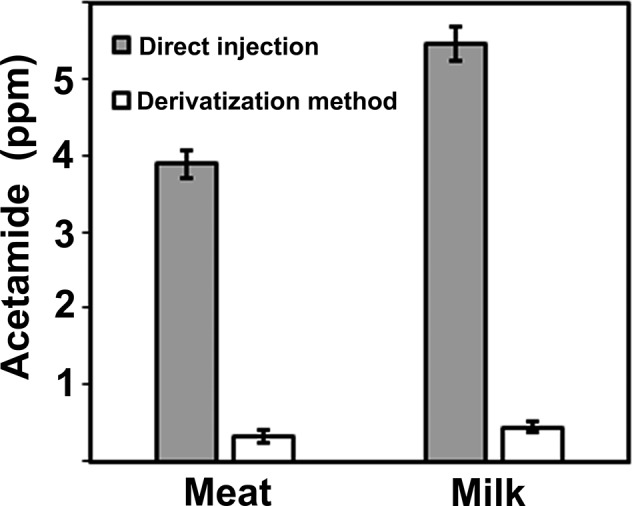
Comparison of the acetamide amounts in the same milk and beef sample analyzed by direct injection and 9-xanthydrol derivatization GC/MS. Error bars show standard deviation for three separate samplings/derivatization for the same beef and milk sample.
Survey of the Acetamide Levels in Marketed Milk, Beef, and Coffee
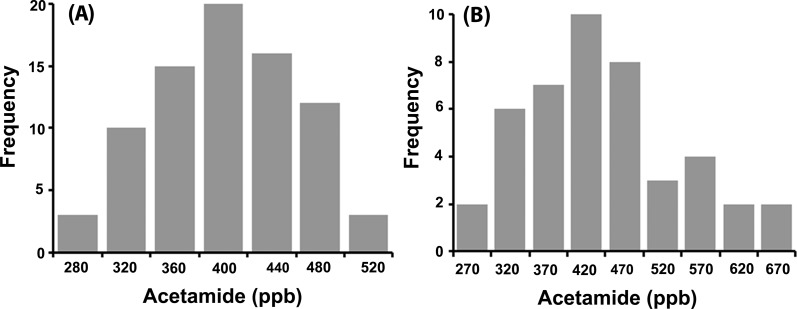
We used the developed 9-xanthydrol derivatization GC/MS method to establish levels of acetamide in market cow milk and beef as two important food resources. Twenty-three milk and 44 beef samples from different grocery stores within Michigan were purchased and analyzed for acetamide content. In addition, we tested the milk of 14 individual cows (for 4 weeks) directly before any pasteurization and industrial packaging. Acetamide was detected in every milk and beef sample tested (Figure 7). Acetamide levels were 390 ± 60 ppb in milk and 400 ± 80 ppb in beef. These values are consistent with an earlier report of 275–500 ppb levels of acetamide in milk purchased from various sources.26 No significant difference was observed among the individual raw cow milk samples and the pasteurized market milk samples, suggesting that the acetamide is not introduced during pasteurization or packaging.
Figure 7.
Histograms of acetamide levels in 79 tested milk samples measured using xanthydrol derivatization and GC/MS of (A) 23 market milk samples plus 56 milk samples from 14 individual cows on regular feed (one milk sample was taken and analyzed from each cow for four consecutive weeks) and (B) 44 tested market sirloin beef samples.
We also surveyed acetamide within coffee and demonstrate that it is a ubiquitous constituent of roasted coffee at levels of ∼39 ppm with none testing below 20 ppm and of instant coffee at levels of ∼86 ppm with none testing below 65 ppm (Table 1). At these levels, the expected range of acetamide concentration in brewed coffee, depending on the method of preparation, is 0.4–2.3 ppm. No acetamide was detected in raw coffee beans. On the basis of the recent observation that acetamide levels rose as chicory roots15 were roasted, and on our finding that raw coffee beans do not contain a detectable level of acetamide, we hypothesize that the likely source of acetamide in roasted coffee is the thermal degradation of N-acetyl compounds during the roasting process.
Table 1. Acetamide Level in Raw and Roasted Coffee Beans and Instant Coffee.
| coffee samples | acetamide (ppm) (means ± SD) | number of samples |
|---|---|---|
| roasted coffee beans | 39 ± 9 | 18 |
| raw coffee beans | not detected | 3 |
| instant coffee | 86 ± 20 | 8 |
Implications of Acetamide in Foods
Despite classification of acetamide by the IARC as a possible human carcinogen (Group 2B) and evidence for its presence in foods, there are no regulatory guidelines for acceptable levels in foods. We are also unaware of any significant information relating acetamide exposures to human cancer risks. Based on EPA risk calculations, it was proposed that meat and poultry could contain as much as 90 ppb of acetamide before the cancer risk reached 10–6, and milk could contain up to 30 ppb.26 Another estimate, based on the California EPA’s establishment of a cancer slope factor of 0.07/(mg/kg/day) and assuming a linear slope to zero from the high acetamide levels at which rodent cancers were detected, suggests that allowable acetamide concentrations in milk, beef, and coffee, corresponding to a de minimiz 10–6 lifetime cancer risk, would be 4, 18, and 180 ppb, respectively.30
Our findings that acetamide is present in these foods at levels significantly exceeding those from existing model-derived de minimis risk levels suggest that a reconciliation is required. Either consumption of milk, beef, and coffee are associated with a significantly higher cancer risk than previously recognized, or the conservative assumptions of existing models significantly overestimate the underlying cancer risks. In the case of milk consumption, epidemiology has failed to demonstrate convincing evidence of increased risks for most cancers.31
Knowledge gaps regarding consumption of acetamide-containing foods should be addressed in part by surveys of acetamide levels in foods and through investigation of the effects of food processing procedures, particularly those involving high temperatures, and agricultural practices on food acetamide levels. More information and insights are needed to further our understanding of the mechanisms of acetamide carcinogenicity, the true cancer risks posed by acetamide at the levels present in foods, and the roles in acetamide metabolism played by gut microbiomes and other dietary constituents.27−29 Finally, improved understanding of the abundance of acetamide in the food chain and the associated risks of cancer are important considerations for future regulatory guidelines ensuring food safety and public health.
Acknowledgments
The authors are grateful for support from Dr. Scott Smith, Ms. Lijun Chen, and Dr. Tony Schilmiller of the Michigan State University Mass Spectrometry and Metabolomics Core.
Supporting Information Available
The Supporting Information is available free of charge on the ACS Publications website at DOI: 10.1021/acs.jafc.7b02229.
Supplementary Table S1: mean recovery, within- and between-run assay precision and accuracy in milk; Supplementary Table S2: mean recovery, within- and between-run assay precision and accuracy in beef (PDF)
Funding for this project was provided by the Bill and Melinda Gates Foundation. The work was additionally supported by Grant Case 48166 of the 21st Century Jobs Trust Fund received through the Michigan Strategic Fund from the State of Michigan. A.D.J. acknowledges support from the USDA National Institute of Food and Agriculture, Hatch Project MICL-02143.
The authors declare no competing financial interest.
Supplementary Material
References
- Coleman G. H.; Alvarado A. M. Org. Synth. 1923, 3, 3–5. 10.15227/orgsyn.003.0003. [DOI] [Google Scholar]
- Cheung H.; Tanke R. S.; Torrence G. P. Acetic Acid. Ullmann’s Encyclopedia of Industrial Chemistry 2011, 1, 209–238. 10.1002/14356007.a01_045.pub2. [DOI] [Google Scholar]
- Humpula J. F.; Chundawat S. P. S.; Vismeh R.; Jones A. D.; Balan V.; Dale B. E. Rapid Quantification of Major Reaction Products Formed During Thermochemical Pretreatment of Lignocellulosic Biomass Using GC-MS. J. Chromatogr. B: Anal. Technol. Biomed. Life Sci. 2011, 879, 1018–1022. 10.1016/j.jchromb.2011.02.049. [DOI] [PubMed] [Google Scholar]
- Chundawat S. P. S.; Vismeh R.; Sharma L. N.; Humpula J. F.; da Costa Sousa L.; Chambliss C. K.; Jones A. D.; Balan V.; Dale B. E. Multifaceted Characterization of Cell Wall Decomposition Products Formed During Ammonia Fiber Expansion (AFEX) and Dilute Acid Based Pretreatments. Bioresour. Technol. 2010, 101, 8429–8438. 10.1016/j.biortech.2010.06.027. [DOI] [PubMed] [Google Scholar]
- Re-evaluation of Some Organic Chemicals, Hydrazine and Hydrogen Peroxide/IARC Working Group on the Evaluation of Carcinogenic Risks to Humans; IARC: Lyon, France, 1999; pp 1211–1221. [PMC free article] [PubMed]
- Jackson B.; Dessau F. I. Liver Tumors in rats fed acetamide. Lab. Invest. 1961, 10, 909. [PubMed] [Google Scholar]
- Fleischman R. W.; Baker J. R.; Hagopian M.; Wade G. G.; Hayden D. W.; Smith E. R.; Weisburger J. H.; Weisburger E. K. Carcinogenesis Bioassay of Acetamide, Hexanamide, Adipamide, Urea and Para-Tolylurea in Mice and Rats. J. Environ. Pathol. Toxicol. 1980, 3, 149–170. [PubMed] [Google Scholar]
- Diekmann J.; Wittig A.; Stabbert R. Gas Chromatographic-Mass Spectrometric Analysis of Acrylamide and Acetamide in Cigarette Mainstream Smoke after On-column Injection. J. Chromatogr. Sci. 2008, 46, 659–663. 10.1093/chromsci/46.7.659. [DOI] [PubMed] [Google Scholar]
- Leenheer J. A.; Noyes T. I.; Stuber H. A. Determination of Polar Organic Solutes in Oil-Shale Retort Water. Environ. Sci. Technol. 1982, 16, 714–723. 10.1021/es00104a015. [DOI] [Google Scholar]
- United States EPA archived document at: https://archive.epa.gov/pesticides/chemicalsearch/chemical/foia/web/pdf/114501/114501-068.pdf (accessed 10 November 2017).
- United States EPA archived document at: https://archive.epa.gov/pesticides/chemicalsearch/chemical/foia/web/pdf/114501/114501-075.pdf (accessed 10 November 2017).
- WHO. Pesticide Residues in Food; 2004 Evaluations. Part I – Residues; World Health Organization: Geneva, 2005; pp 417–607. [Google Scholar]
- Tao N.; Depeters E. J.; Freeman S.; German J. B.; Grimm R.; Lebrilla C. B. Bovine Milk Glycome. J. Dairy Sci. 2008, 91, 3768–3778. 10.3168/jds.2008-1305. [DOI] [PubMed] [Google Scholar]
- Belloque J.; Villamiel M.; López-Fandiño A.; Olano A. Release of Galactose and N-acetylglucosamine During the Storage of UHT Milk. Food Chem. 2001, 72, 407–412. 10.1016/S0308-8146(00)00310-1. [DOI] [Google Scholar]
- Wei F.; Furihata K.; Zhang M.; Miyakawa T.; Tanokura M. Use of NMR-based Metabolomics to Chemically Characterize the Roasting Process of Chicory Root. J. Agric. Food Chem. 2016, 64, 6459–6465. 10.1021/acs.jafc.6b02423. [DOI] [PubMed] [Google Scholar]
- Chen J. H.; Wang M. F.; Ho C. T. Volatile Compounds Generated From Thermal Degradation of N-acetylglucosamine. J. Agric. Food Chem. 1998, 46, 3207–3209. 10.1021/jf980129g. [DOI] [Google Scholar]
- Koll P.; Borchers G.; Metzger J. O. Thermal degradation of chitin and cellulose. J. Anal. Appl. Pyrolysis 1991, 19, 119–129. 10.1016/0165-2370(91)80038-A. [DOI] [Google Scholar]
- Elias G.; Mattson E. D.; Little J. E. A HPLC Method for the Quantification of Butyramide and Acetamide at ppb Levels in Hydrogeothermal Waters. Anal. Methods 2012, 4, 530–533. 10.1039/c2ay05576g. [DOI] [Google Scholar]
- Cho Y. H.; Shin H. S. Determination of Trace Levels of Acetamide, Propanamide, and Butyramide in Surface and Drinking Water Using Gas Chromatography-Mass Spectrometry after Derivatization with 9-Xanthydrol. Anal. Chim. Acta 2013, 787, 111–117. 10.1016/j.aca.2013.06.013. [DOI] [PubMed] [Google Scholar]
- Lim H. H.; Shin H. S. Ultra Trace Level Determinations of Acrylamide in Surface and Drinking Water by GC-MS After Derivatization With Xanthydrol. J. Sep. Sci. 2013, 36, 3059–3066. 10.1002/jssc.201300209. [DOI] [PubMed] [Google Scholar]
- Yamazaki K.; Isagawa S.; Kibune N.; Urushiyama T. A Method for the Determination of Acrylamide in a Broad Variety of Processed Foods by GC-MS Using Xanthydrol Derivatization. Food Addit. Contam., Part A 2012, 29, 705–715. 10.1080/19440049.2011.645217. [DOI] [PubMed] [Google Scholar]
- Molina-Garcia L.; Santos C. S. P.; Melo A.; Fernandes J. O.; Cunha S. C.; Casal S. Acrylamide in Chips and French Fries: a Novel and Simple Method Using Xanthydrol for Its GC-MS Determination. Food Analytical Methods 2015, 8, 1436–1445. 10.1007/s12161-014-0014-5. [DOI] [Google Scholar]
- Ahmadkhaniha R.; Shafiee A.; Rastkari N.; Khoshayand M. R.; Kobarfard F. Quantification of Endogenous Steroids in Human Urine by Gas Chromatography Mass Spectrometry Using a Surrogate Analyte Approach. J. Chromatogr. B: Anal. Technol. Biomed. Life Sci. 2010, 878, 845–852. 10.1016/j.jchromb.2010.01.040. [DOI] [PubMed] [Google Scholar]
- Ahmadkhaniha R.; Shafiee A.; Rastkari N.; Kobarfard F. Accurate Quantification of Endogenous Androgenic Steroids in Cattle’s Meat by Gas Chromatography Mass Spectrometry Using a Surrogate Analyte Approach. Anal. Chim. Acta 2009, 631, 80–86. 10.1016/j.aca.2008.10.011. [DOI] [PubMed] [Google Scholar]
- VICH topic GL49: Studies to Evaluate the Metabolism and Residue Kinetics of Veterinary Drugs in Food-Producing Animals: Validation of Analytical Methods Used in Residue Depletion Studies, Food and Drug Administration Center for Veterinary Medicine 2015. http://www.ema.europa.eu/docs/en_GB/document_library/Scientific_guideline/2011/04/WC500105053.pdf (accessed 10 November 2017).
- National Resource Council Staff . Regulating Pesticides in Foods: The Delaney Paradox; National Academies Press: Washington, DC, 1987. [PubMed]
- Liu G. M.; Cao W.; Fang T. T.; Jia G.; Zhao H.; Chen X. L.; Wu C. M.; Wang J. Urinary Metabolomic Approach Provides New Insights into Distinct Metabolic Profiles of Glutamine and N-Carbamylglutamate Supplementation in Rats. Nutrients 2016, 8, 478. 10.3390/nu8080478. [DOI] [PMC free article] [PubMed] [Google Scholar]
- Liu G. M.; Yang G. J.; Fang T. T.; Cai Y. M.; Wu C. M.; Wang J.; Huang Z. Q.; Chen X. L. NMR-Based Metabolomic Studies Reveal Changes in Biochemical Profile of Urine and Plasma from Rats Fed with Sweet Potato Fiber or Sweet Potato Residue. RSC Adv. 2014, 4, 23749–23758. 10.1039/c4ra02421d. [DOI] [Google Scholar]
- Liu G.; Wu X.; Jia G.; Chen X.; Zhao H.; Wang J.; Wu C.; Cai J. Arginine: New Insights into Growth Performance and Urinary Metabolomic Profiles of Rats. Molecules 2016, 21, 1142. 10.3390/molecules21091142. [DOI] [PMC free article] [PubMed] [Google Scholar]
- California Environmental Protection Agency, 1999. Air toxics hot spots program risk assessment guidelines Part II: Technical support document for describing available cancer potency factors. p 28.
- Davoodi H.; Esmaeili S.; Mortazavian A. M.. Effects of Milk and Milk Products Consumption on Cancer: A Review. Comprehensive Reviews in Food Science and Food Safety. 12, 249−264. [Google Scholar]
Associated Data
This section collects any data citations, data availability statements, or supplementary materials included in this article.


